Color and Edge Histograms Based Medicinal Plants' Image Retrieval

Author: Basavaraj S. Anami, Suvarna S Nandyal, Govardhan. A.
Journal: International Journal of Image, Graphics and Signal Processing(IJIGSP) @ijigsp
Article in issue: 8 vol.4, 2012.
Free access
In this paper, we propose a methodology for color and edge histogram based medicinal plants image retrieval. The medicinal plants are divided into herbs, shrubs and trees. The medicinal plants are used in ayurvedic medicines. Manual identification of medicinal plants requires a priori knowledge. Automatic recognition of medicinal plants is useful. We have considered medicinal plant species, such as Papaya, Neem, Tulasi and Aloevera are considered for identification and retrieval. The color histograms are obtained in RGB, HSV and YCbCr color spaces. The number of valleys and peaks in the color histograms are used as features. But, these features alone are not helpful in discriminating plant images, since majority plant images are green in color. We have used edge and edge direction histograms in the work to get edges in the stem and leafy parts. Finally, these features are used in retrieval of medicinal plant images. Absolute distance, Euclidean distance and mean square error, similarity distance measures are deployed in the work. The results show an average retrieval efficiency of 94% and 98% for edge and edge direction features respectively.
Medicinal plant retrieval, Herbs, Shrubs, Trees, Color histogram, Edge histogram
Short address: https://sciup.org/15012347
IDR: 15012347
Text of the scientific article Color and Edge Histograms Based Medicinal Plants' Image Retrieval
Published Online August 2012 in MECS
Plants are used as food, medicine in Ayurveda, preparation of natural colors, interior decoration etc. Ayurveda is an alternate system of medicine in India. This system of medicine is useful in the treatment of certain chronic diseases such as cancer, diabetes, blood pressure, skin problems etc. The ayurveda medicines are in the form either decoction or tablets or powder of extracts of medicinal plants. Only Ayurveda practitioners and some rural experts have the rich knowledge of identification and usage of medicinal plants. But, the knowledge of these plants dies with the experts, because of the fact that the experts do not share with others. Hence, it is necessary to use technology and develop tools for the recognition and use of medicinal plants for the people.
The forests in India are the principal repositories of large number of medicinal plants, which are largely collected as raw materials in preparation of Ayurveda medicine. Ayurveda practitioners use the parts of these medicinal plants such as leaves, stems and seeds in the preparation of medicines. The medicinal plants are divided into herbs, shrubs or trees. Recently, these plants are cultivated in fields, farms and parks. The experts identify these medicinal plants with ease and efficiency. In order to identify plants and to differentiate between them certain features are used, which act as the distinguishing features. Only ayurved practitioners and rural experts has the rich knowledge of usage of medicinal plant as first aid and ayurvedic treatments. But, the knowledge of these plants dies with these experts or it will not be shared by others. Therefore, it is important for Ayurveda practitioners to preserve this knowledge of identifying the medicinal plants.
The plant structures used for recognition are inflorescence, arrangement of leaves and vein types, stem structure, root structure, fruits, seeds and growth factors such as height. Amongst these, at the outset plants are recognized based on their heights as herbs,shrubs and trees. But, height is a variable feature that changes with age of the plants. Hence it is difficult to use the height as one of the features in recognition of medicinal plants.
It is necessary to develop an automatic method that identifies the medicinal plants from their images. Different features need to be extracted using image processing techniques for identification, such as shape, color and texture. However, automatic medicinal plant retrieval from color feature is challenging in computer vision system because majority of the plants are green in color. The work presented in this paper is based on color and edge information, namely, color histogram, edge histogram, and edge direction histogram. Histograms represent the global feature composition of an image and are invariant to both translation and rotation of the images. Further, normalizing a histogram makes it scale invariant. Taking the advantage of the above properties of the histograms, the authors have attempted for recognition and retrieval of images from the database. We have carried out the literature survey related to the usage of histograms in plant retrieval and other applications and briefly outlined.
(Jianlin Zhang et al., 2010) have presented a novel technique that employs both the color and edge direction feature for Content Based Image Retrieval. (R. Vijay Arjunan et al., 2009) have presented empirical results for the domain of high resolution computed image flowers using color histogram. The retrieval accuracy of 91% is reported using quadratic distance measure and Euclidean distance measure. (Shamuk sural et al.,2002) have proposed a segmentation and histogram generation using the HSV color space and an analysis based on visual perception of the variation in hue, saturation and intensity values of an image pixel in image retrieval. Spatial-Chromatic-Histogram (SCH), (L. Cinque et al.,1999) have developed a method for content based image retrieval. (Dong kwon park et al., 2000) have tried to use edge histogram descriptor for MPEG 7 image matching by global and semi-local edge histograms from the local histogram bins. Efforts have also been made for retrieval technique that combines color and edge features for image indexing. HSV color space is used for color histogram and YC b C r color space for edge histograms with different distance measures. The work describes a 4-bin edge histogram to represent the strengths of edges in the 4 directions 00, 450, 900, and 1350. It is observed that combined features give better efficiency.
(K. Singh, M. Ma, and D.W. Park 2003) have presented a method for color image retrieval by combining color histogram, edge histogram and edge direction histogram features. The performance of image retrieval system is improved by integrating these features. The method was tested on general purpose image database and found efficient retrieval performance.
To the best knowledge of authors, no work on medicinal plant image retrieval is cited in the Indian context. Hence, this paper presents a method for content based image retrieval based on color and edge histogram features.
The remaining part of the paper is organized into four sections. Section two gives image acquisition and details of proposed methodology. The feature extraction and similarity distance computation is also presented in section two. The results are discussed in section three.
The work is concluded in section four.
-
II. PROPOSED METHODOLOGY
The methodology comprises of four phases, namely, image acquisition, plant image segmentation, feature extraction, similarity measurement, and retrieval of images. The phases are shown in Fig. 1.
-
A. Image acquisition and image samples
We have collected the medicinal plants’ samples are acquired from farms and botanical department, Gulbarga University Gulbarga, of Gulbarga district. Few samples are collected from herbal gardens, M.M. Joshi park, Budinal Forest and Ayurved college in Hubli, in the state of Karnataka, India. We have used color digital Camera Canon make with resolution of 12 Mega pixels. A total of 900 images, 300 images of each type, namely, herbs, shrubs and trees are considered in the work. Another set of 100 images of each class are used as query images. The distance between the camera and the medicinal plants is kept constant and fixed to 40 centimeters. The views in all the eight directions, namely, right, left, top, bottom and the four diagonals. The images of medicinal plants are captured in such a way that the trunk and leafy portions are more significant. The images are obtained under natural light.
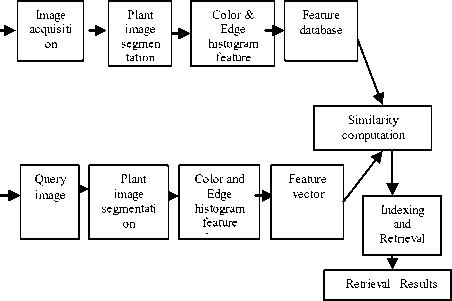
Figure 1: Phases in the proposed methodology
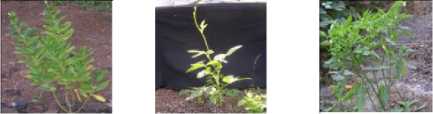
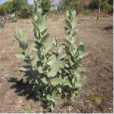
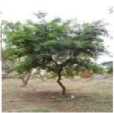
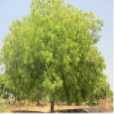
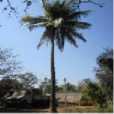
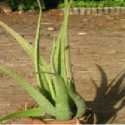
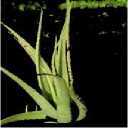
The sample images of different medicinal plants considered in this work are shown in Fig 2. The plants with botanical names and regional names of the plants are given in the brackets, namely,Cathranthus roseus(Sada mallige),Vigna unguiculata(Alasande), Capsicum annum(Chilli), Ocimum sanctum(Tulasi), Aloebarbadensis(Laval sara), Calotropis gigantea(Ekki), Acaciacatechu(Cutch),Azadirachita indica (Bevu),Cocos nucifera (Tengu) etc.
(a) (b) (c)
(d)
(e)
(f)
(g)
(h)
(i)
Figure 2: Medicinal Plants images (a) Cathranthus roseus (b)Vigna unguiculata (c)Capsicum annum (d)Ocimum sanctum (e) Aloebar badensis (f) Calotropis gigantea (g)Acacia Catechu (h) Azadirachita indica (i) Cocos nucifera
The images are subjected to preprocessing using Gaussian filter for noise removal. Each medicinal plant is characterized by certain geometrical features like, height, (branching) edge information, stem and canopy dimensions. The edge or skeleton feature of stem and leafy mass are considered for plant image recognition and retrieval.
The medicinal plant image is divided into background and plant using K-means segmentation technique. We have used RGB, HSV and YC b C r color spaces for obtaining the color histogram. The features, namely, color, edge and edge direction histogram are computed for plant image. The feature vectors include maximum peak value, total number of peaks and valleys of a color histogram and number of edges from Edge Histogram(EH) and Edge Direction Histogram (EDH). Similarly, at the time of retrieval, the features are computed for query image. Then similarity between the images in the database and the query image is computed
using Euclidean distance and absolute difference. In order to obtain the best retrieval results, all the retrieved results are stored in a sorted order of the distance measure and the first immediate neighbor with minimum distance is considered as similar to query image. Further, to increase precision of retrieval, a statistical method, namely, Mean Square Error (MSE) is used. The initial retrieval results are clustered using three approaches and later a voting scheme is adopted to retrieve plant with the highest similarity. The overall retrieval accuracy is validated against visual inspection. It is observed that selected features and distance measures combined have given good medicinal plant image retrieval accuracy. The developed approach helps Ayurveda practitioners, people working in herbal pharmaceutical industry, botany students, rural people in identification of medicinal plant images as herbs, shrubs and trees.
B. Medicinal plant image Segmentation
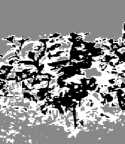
Initially, We have chosen K=2, corresponding to two regions of medicinal plants, namely, plant object and background. The RGB images are converted to L*a*b* color space and clustered region-wise. The morphological images are extracted out of the clustered images. Clustering has produced two distinct data sets based on the distance measure and intensity variations. For each data point, we have obtained Euclidean distance from mean of the each cluster. It is observed that segmentation accuracy using K-means clustering mainly depends on the medicinal plant image quality, type of background and illumination conditions (Basavaraj S. Anami et al., 2011).
original image
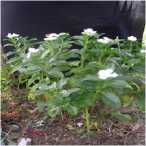
image labeled by cluster index
clustered image
(a) (b) (c)
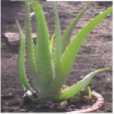
Figure 3: K-means segmentation: (a) Catharanthus roseus (Herb) (b) Image labeled by Cluster index (c)Segmented plant
MEDPLANT IMAGE
(a)
image labeled by cluster index

(b)
clustered image
(c)
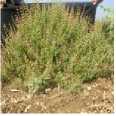
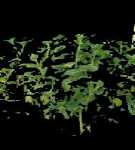
Figure 4: (a) Ocimum sanctum (Shrub) (b)Image labeled by cluster index(c) Segmented shrub image
MEDPLANT IMAGE
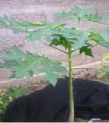
(a)
image labeled by cluster index
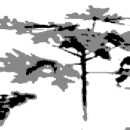
(b)
clustered image
(c)
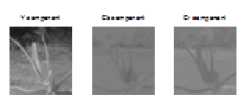
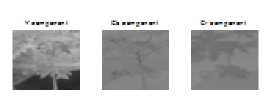
Figure 5: (a) Carica papaya (Tree) (b) Image labeled by cluster index (c)Segmented tree image
Fig. 3, 4, and 5 show the images of Catharanthus roseus, Aloe vera and Carica papaya medicinal plants after the application of K-means clustering respectively. The figures indicate that, compared with herbs and shrubs, tree images have yielded better edge patterns of canopy and stem parts.
-
C. Feature extraction
The features namely, Color histogram(CH), Edge Histogram(EH), Edge Direction Histogram(EDH) are extracted. The details are given as under.
-
1) Color histogram
One of the most important features used in recognition of medicinal plant images by humans is color. We have used color information for recognition of herbs, shrubs and trees. Usually, medicinal plants have different tones of green, brown, red, purple and yellow. But majority of medicinal plant images are certainly with various shades of green color. A tree image has heterogeneous texture and color values. The leafy mass and stem are of different color and texture pattern. The tree images are covered much of the image space with more green color density for canopy and brown/woody color for stem part.
The stems of herbs are short, slender and green in color whereas shrubs do not have stems and has wide green color bushy nature from base itself. Herbs are easily distinguishable from shrubs because shrub images are much covered in image space than herbs. Accordingly, these properties are to be captured by an efficient color feature extraction method. Hence, this makes us to use color histogram as one of feature for medicinal plant recognition.
Color histogram gives the variance in color of all the pixels in the image. The intensity of green tone help us to recognize tree images with other classes more efficiently. There are some existing color model to describe image, such as RGB, HSV,HIS, YUV etc.( Kondekar V. H., Kolkure V. S.,et al., 2010). RGB perhaps the simplest color space for people to understand because it corresponds to three colors that the human eye can detect. However, the RGB color model is found more suitable for similarity computation. The luminance and saturation information are implicitly contained in the R, G and B values. Therefore, two similar colors with different luminance have large Euclidean distances in the RGB color space and are regarded as different. The results are compared using HSV and YCbCr color spaces. (L. Cinque et al.,1999).
In RGB color space, the histograms are quantized into 256 bins in order to represent the coarse color content of medicinal plant image and to reduce dimensionality during matching phase. R,G and B have same distance in its color space. Hence, they are quantized into same levels. In HSV and YC b C r color space the number of bin levels are in the ratio 4:2:2, by taking colors, like green shades of green are grouped into a bin. In HSV color space quantization of hue component has given more importance in the human visual system than saturation (S) and value (V) components. Hence, it is reasonable to assign more bits to hue than to the other components. Accordingly, in YC b C r space, luminance component is given more attention. The HSV and YC b C r color space are quantized with 4x2x2 = 16 histogram bins.
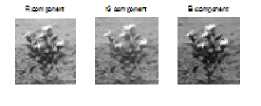
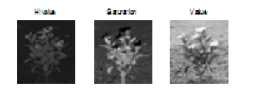
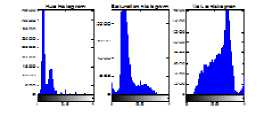
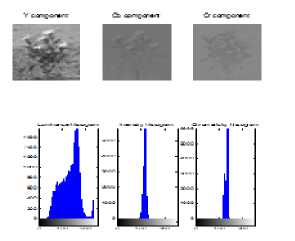
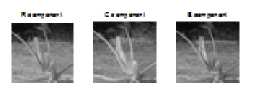
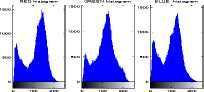
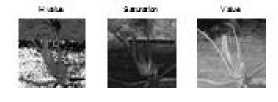
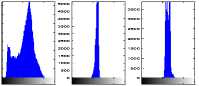
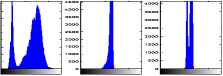
From the color histogram we have extracted the average number of peaks, maximum peak at a specific gray tone level and valleys. Algorithm 1 gives the procedure for computing these features. Fig. 6, Fig. 7 and Fig. 8 show the color histograms in RGB, HSV and YC b C r color space for herbs, shrubs and trees respectively. It is observed that herbs have maximum peak value at gray tone value 170 in RGB plane. An average green tone value is observed between 160 to 215 gray levels. In HSV color space, the Hue plane shows maximum peak at the hue value of 0.3 corresponding to green tone value. It is revealed that the image is much saturated hue range [0.0 - 0.4] and has empty regions for the remaining values. The Value plane provides an even distribution of brightness spread in the range [ 0.2 - 0.9]. Accordingly, luminance component gives maximum peak at the value 156. The color histogram features for three classes are shown in Table 1. An average valley count of three is observed for herbs images.
Herb
RED histogram
GREEN histogram
BLUE histogram
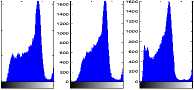
Figure 6: (a) RGB color space
(b) HSV color space
(c) YCbCr color space
Shrub
Tree
F igure 7: (a) rgb color space
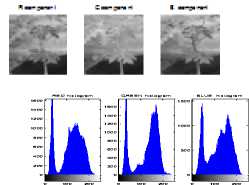
Figure 8: (a) RGB color space
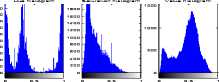
(b) HSV color space
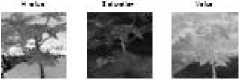
Hue histogram
Saturation histogram
Value histogram
0.5
0.5
0.5
(b) HSV color space
uminance histogram
Intensity histogram
Chromaticity histogram
0 100 200 0 100 200 0 100 200
(c) YCbCr color space
Lu
Intensity histogram
m uminance histogram istogr
Chromaticity
(c) YCbCr color space
Table 1: Color histogram feature values
|
Plant class |
# of Peaks |
Max peak value |
Gray level value |
Valleys |
||||||||
|
R |
G |
B |
R |
G |
B |
R |
G |
B |
R |
G |
B |
|
|
Herbs |
8-14 |
10-12 |
8-15 |
913-1217 |
963-1400 |
917-1275 |
160-181 |
170-115 |
145-165 |
2-4 |
1-4 |
1-7 |
|
Shrubs |
9-14 |
8-14 |
9-13 |
818-935 |
820-924 |
773-856 |
150-165 |
132-180 |
132-164 |
2-5 |
3-7 |
1-4 |
|
Trees |
06-17 |
10-14 |
7-15 |
848-4116 |
843-4412 |
848-4116 |
150-170 |
160-226 |
124-147 |
1-2 |
1-2 |
1-4 |
Algorithm 1: Color Histogram Computation
Input: Original 24-bit color images
Output: Number of peaks, maximum peak value, gray value of maximum peak and number of valleys.
Start
Step 1: Read the RGB medicinal plant images from the database
Step 2: Separate the RGB components from the read original 24-bit color image.
Step 3: Apply Quantization for each plane and number of bins = 256.
Step 4 : Compute the histograms in the three planes.
Step 5: Obtain the pixel count and gray levels in RGB plane.
Step 6: Compute the difference between successive pixel counts.
Step 7: If difference between successive pixel counts < 0 and |difference| >= 100, then valleycount = valleycount +1 else, if difference > =50, peakcount = peakcount+1.
Step 8: Obtain the maximum pixel count, gray level of maximum pixel count, number of peaks and valleys.
Stop.
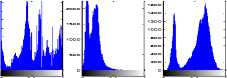
Similarly, the histogram of shrub images shown in Fig. 7, have the maximum peak value at gray tone value 150 with an average valley count of three or four is oberved in RGB color space. In HSV color space, the Hue plane shows high spikes at three positions. Hue plane histogram is clipped off to the right and left. This indicates that image is overexposed and does not have clear mountain peaks. The shrub image is over saturated with peaks clipped to the left and middle peak is clipped off. The Value plane shows an even distribution of brightness spread between [0.1 - 0.8]. The luminance component in YC b C r color space gives smooth mountain peaks with maximum peak at 150. But blue chrominance and red chrominance will not give much details.
The tree images as shown Fig. 8, have two peak values at gray value 30 and 170 in RGB color space. The pixel count of second valley is higher and spreads like bell shape, than that of herbs and shrubs representing high density of green tone value. An average valley count of two is observed with more variation in spikes due to brown/woody component of tree images. Because of these reasons the first peak is very much prominent and narrow. But, second peak shows Gaussian nature with wide distribution of canopy intensity. Accordingly, Hue plane provides more variation in hue color with non-uniform distribution. The luminance component gives two peaks, representing green and brown tone values. Hence, HSV color space is not suitable for tree images. However, it is observed that RGB color space gives better clustering than other spaces. Hence, we have considered only RGB color space features for the retrieval. The features for the three classes are shown in Table 1. Finally, as all plant images are with green or shades of green color. There are some overlapping results with shrubs and not fully grown plants. The color features, such as valleys, gray level value which we have computed are overlapping with few values. Hence, we have eliminated color features from our feature set. Only color information is not sufficient for recognition of herbs, shrubs and trees. Hence, this motivated us to compute edge features.
-
2) Edge histogram descriptor
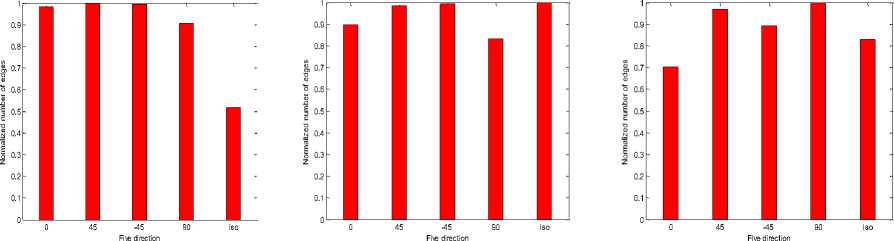
The analysis of edges from the image is considered an important feature to represent the content of the image. Human eyes are known to be sensitive to edge features for image perception. The edges of the medicinal plants’ images give the branching distribution of trunk/stem and leaf. Hence, the edge of a plant image is another important feature that helps for distinguishing varieties of medicinal plant species. These properties are captured by Edge Histogram(EH) descriptor. Edges from the plant image are categorized into vertical, horizontal, 450 diagonal, -450 diagonal and isotropic(non-diagonal) edges based on strengths of directional edges. In addition, edge features represent the plant boundary and is used for contour representation of medicinal plant image from background. An edge filter is applied in each direction and edges are computed in five directions (B S Anami et al.,2010). The normalized values of number of edges in five directions are listed in Table 2.
0o edge #: 6292 45o edge #: 6541
lum. 0o edge #: 5939 45o edge #: 7374
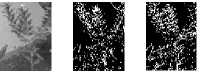
lum.

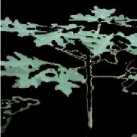
lum. 0o edge #: 3360 45o edge #: 3420

-45o edge #: 712690o edge #: 7284 iso edge #: 7449

■ ■
-45o edge #: 699290o edge #: 5529 iso edge #: 5105

-45o edge #: 356990o edge #: 2753 iso edge #: 2917

(a) (b) (c)
Figure 9: Edge histogram of (a) Herb (b) Shrub (c) Tree image
Table 2: Normalized values of number of Edges from EH
|
Degree |
Herbs |
Shrubs |
Trees |
|
00 |
0.95 |
0.90 |
0.70 |
|
450 |
1.00 |
1.00 |
0.98 |
|
-450 |
1.00 |
1.00 |
0.96 |
|
900 |
0.91 |
0.85 |
1.00 |
|
Iso |
0.52 |
1.00 |
0.78 |
The edge histogram for herbs, shrubs and trees class are shown in Fig. 9. From the nature of Edge Histogram(EH), it is observed that for herbs and shrubs images , the number of edges in 00 and 450 are more than tree images. The number of edges in 450 and -450 for the three classes has approximately same value. It is observed that number of edges in 900 varies marginally for three classes and hence used as a discriminating edge feature. For herb images, the isotropic edges are very sparse. It is observed that the only three directions, namely,00 900 and isotropic(non-diagonal) are considered as discriminating features in the work. Hence, the reduced feature set includes only edges in these three directions for computing the edge histogram.
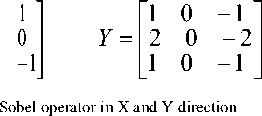
determined for each image and an edge mask is formed with threshold value of 100. The edge pixels are characterized by the magnitudes of gradients greater than 100. The Edge Direction Histogram (EDH) uses the sobel operator to capture the spatial distribution of edges in the six directions, with filter mask shown in Fig. 10. The basic idea is to get a local distribution of five types of edges from canopy and stem regions of the image. The edges of these regions are computed in 00, 450,900,1350,1800,2700 direction. The edge direction histogram of a sample plant images are shown in Fig. 11.The normalized values of number of edges in each direction are shown in Y-axis and are listed in Table 3. The X-axis shows the degree of directedness of edges.
3) Edge direction histogram texture feature
We have used Sobel operator for determining the edges and the direction of edges. The histogram for each of the images of medicinal plants represents the frequencies of occurrences of the six classes of edges in the corresponding images. These directions are
X =
- 1
-
Fig 10:
0o edge #: 7357 45o edge #: 4672 90o edge #: 8623

0o edge #: 51065 45o edge #: 34217 90o edge #: 59284

0o edge #: 51 4 5o edge #: 30950o edge #: 633

135o edge #: 2649 180o edge #: 2011 270o edge #: 1947 135o edge #: 7382 180o edge #: 21372 270o edge #: 12320 135oedge #: 210810oedge #: 2 2 740oedge #: 404
вп
■
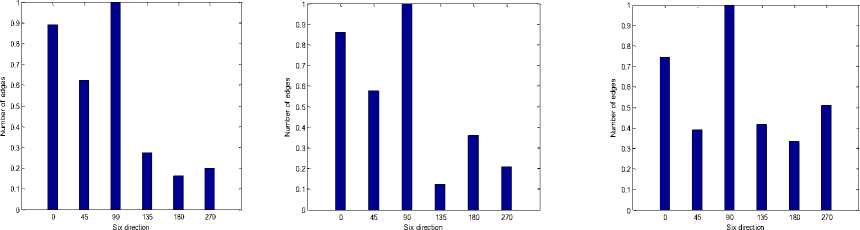
(a)
(b)
(c)
Figure 11: Edge Direction Histogram in six directions (a)Herb(Cathranthus roseus) (b)Shrub(Aloevera) (c) Tree (Azadirachita Indica).
Table 3: Normalized values of number of edges from EDH
|
Degree |
Herbs |
Shrubs |
Trees |
|
00 |
0.91 |
0.98 |
0.75 |
|
450 |
0.62 |
0.56 |
0.38 |
|
900 |
1.00 |
1.00 |
1.00 |
|
1350 |
0.28 |
0.16 |
0.40 |
|
1800 |
0.12 |
0.35 |
0.30 |
|
2700 |
0.20 |
0.20 |
0.50 |
It is observed from Edge Direction Histogram, that number of edges in 00 are more for shrub images than herbs and trees due to bushy appearance. Maximum number of 900 edges are found in each class of plant image. But, the number of edges with 2700 are more in tree images than compared to herbs and shrubs. Hence, the final EDH feature set includes all angles excluding 900. It is revealed that the EDH feature is translation and scale invariant but it is not rotation invariant. The number of edges varies significantly with change in direction.
-
D. Similarity measure
Three similarity measures such as Euclidean distance (ED), sum of Absolute Difference (AD) are used for similarity matching. Later the retrieval results are validated using Mean Square Error (MSE) and results are compared. The distance between feature vectors of query image and data base image is given by equation (1). The feature vector includes edge histogram features with only three angles and five edge direction features amounting to a total of eight features. The use of Absolute difference as similarity measure always gives lesser computational complexity.
ED ■ (tf< - fV’ i■0
k
AD = Z f. — f-\ i ■ -k (1)
MSE ■£ (f. - f-)2
i ■ 1
Where f q is the feature vector of query image and f d is the feature of database image. k is number of feature vector elements.
-
III. RESULTS AND DISCUSSION
We evaluated performance in a quantitative manner, with three classes of query images referring to herbs, shrubs and trees. The retrieval experiments were demonstrated using each edge direction features separately. Once the feature vector is generated for all images in the database a feature database is created. A query image of each class is produced to search the database. The image with exact match gives minimum absolute and Euclidean distance. An ordered list of retrievals are obtained put in ascending order of distances up to a certain threshold value. The threshold value is decided based on simulation runs and visual inspection. To assess the retrieval precision, a voting committee is constructed to retrieve medicinal plant image with highest similarity. Based on the vote with MSE distance, the most relevant images are retrieved.
-
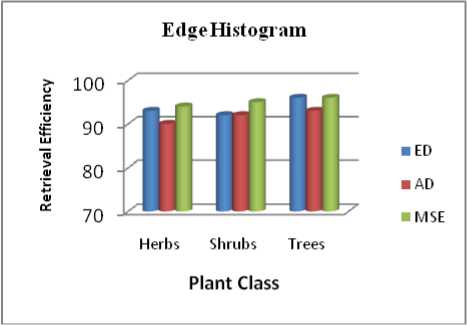
A. Retrieval results based on edge histogram
The edge histogram descriptor captures the spatial distribution of edges. The distribution of edges in plant images is a good texture signature and is useful in image matching evenwhen underlying texture is not homogeneous. The short, slender stem with green color information is a unique feature for recognition of edges of herbs images. But, this information is not present in some of herbs. Hence, some of the herbs images are wrongly retrieved as shrubs. The retrieval efficiency on three classes using three distance measures is presented in Fig. 12(a). The mean square error has given better retrieval accuracy than Euclidean distance and absolute distance for herbs and shrubs images. The average retrieval efficiency is 92%, 90%, 94% for herbs, shrubs and tree images with mean square error similarity measure. The efficiency is less for shrub images, since the stem is absent in shrubs. Hence edge histogram is not able to retrieve all the shrubs with similar edge/leafy pattern. The size of stem varies for different tree species and age, which in turn makes variation in edge pattern of different tree species of same plant species. But, trees have distinguishable edge feature, hence gives encouraging results. The retrieval efficiency for tree images is good compared to herbs and shrubs images.
(a)
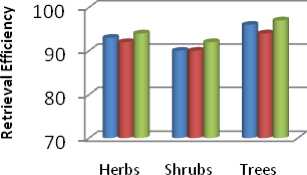
Edge Direction Histogram
Plant Class
(b)
Figure 12: Retrieval Efficiency based on (a) Edge Histogram(EH) (b) Edge Direction Histogram(EDH)
-
B. Retrieval results based on edge direction histogram
The edge direction histogram descriptor captures the edge information in six directions. Therefore, it is found to be quite effective for representing texture and branching pattern. From the Fig.12(b), it is observed retrieval efficiency of 94%, 92%, 97% with herb, shrub and tree images respectively with mean square error similarity measure. The herbs and tree image samples have overlapping results. The tree image samples with clear stem length have given encouraging results than herbs and shrubs samples.
-
C. Retrieval results based on combined features
The average retrieval efficiency of herbs with combined feature approach is 94% as shown in Fig. 13. Since, all the edge features are combined, herbs with an unique branching pattern is recognized efficiently. The shrub images have not shown much improvement in combined approach. The retrieval efficiency remained same as 92% for shrub images. For tree image retrieval, accuracy depends on trunk length and branching pattern. Since, tree images have unique long stem with definite edge direction pattern, hence the retrieval results are almost around 96%-99%.
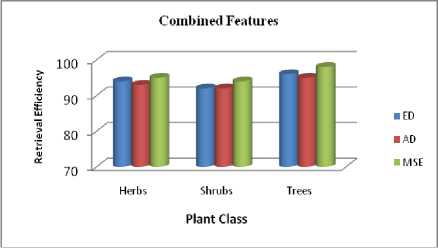
Figure 13: Retrieval accuracy based on combined feature
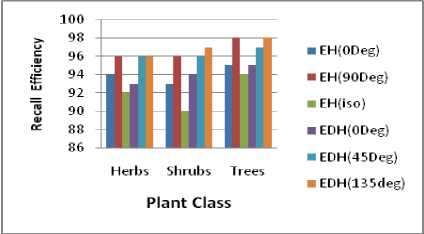
We have also evaluated retrieval performance of EH and EDH histogram based on each direction feature separately. From the analysis of Table 2 and Table 3, we tried to minimize the feature set. It has been found that only 00,900, isotropic(non-diagonal) of EH and 00,450 and 1350 of EDH are discriminating. We have eliminated other direction edges from our feature set. Hence, the minimal feature set is
F min - total = F eh U F edh = { 0 0 ,90 0 , zso } ^ { 00,450,1350 } (2)
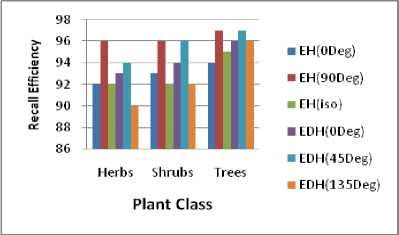
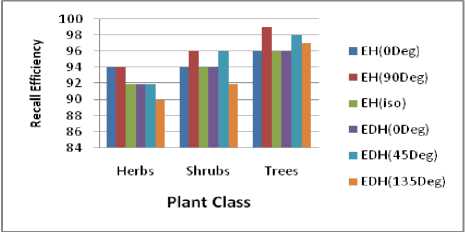
The percentage of recalled images using minimal feature set are reported in Fig.14(a)-Fig. 14(c) for three distance measures respectively.
(a)
(b)
(c)
Figure 14: Recall Efficiency based on Reduced EH and EDH Histogram Feature sets(a)ED (b)AD (c) MSE
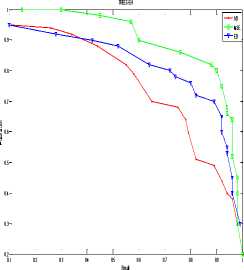
After minimizing the feature set, we have used two metrics to measure the retrieval performance of an image retrieval system, namely, recall and precision. The precision and recall are used together in a graph so that they can show the change of precision values with respect to the recall values. Since the precision drops typically as the recall increases, an image retrieval system is said to be more effective if the precision values are higher at the same recall values. Fig. 15 and Fig 16 depict the precision and recall for three class of image samples using Edge Histogram and Edge Direction Histogram respectively. It is reported that mean square error yields better results than Absolute distance and Euclidean distance. But these distances are also tested in order to compare the effect of edge features on the retrieval of plant images extensively. From the Fig. 15, it is revealed that, the precision and recall curves are almost linear for herbs using EH with all distance measures whereas shrub image samples gives poor performance with Absolute distance. The retrieval precision of tree images is high with an average accuracy of 95%, 96% and 99% with AD,ED and MSE respectively.
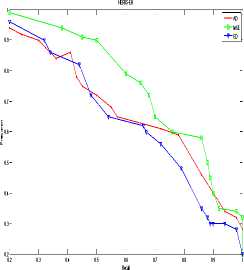
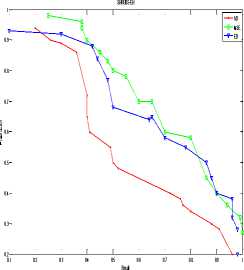
Figure 15: Precision-Recall graph Using EH (a) Herbs(b)Shrubs(c)Trees with three distance measures
HERBS-EDH
Recall
SHRUBS-EDH
AD
-е- MSE
ED
0 9
0 8
0 7
0 6
0 5
0 4
0 3
0 2
0 6 Recall
0 9
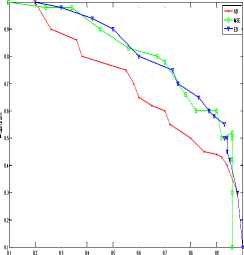
Figure 16: Precision-Recall graph Using EDH (a) Herbs(b)Shrubs(c)Trees with three distance measures
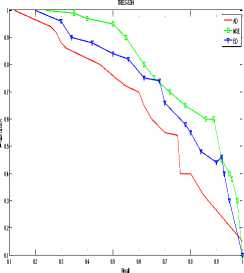
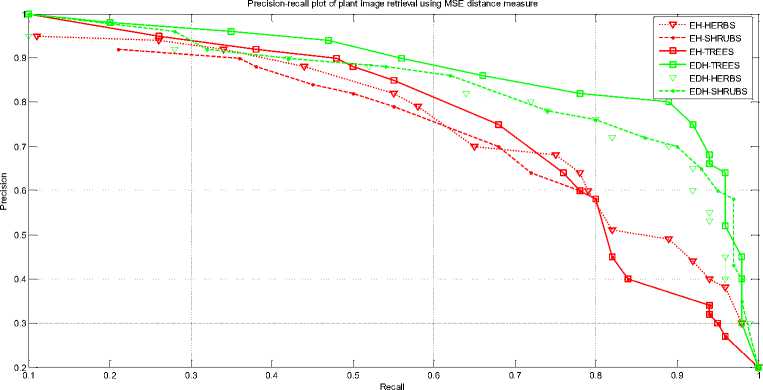
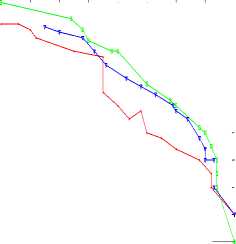
Figure 17: Precision-Recall graph Using EH and EDH on Herbs, Shrubs and Trees using only MSE
Similarly, we can observe from Fig. 16(a), that the more number of relevant images are retrieved for herb class using minimal EDH feature compared to EH. The retrieval performance of shrub images is less with an accuracy of 90%- 92% with AD and ED distance measures than MSE distance. This is because shrub image samples does not have clear stem parts. The tree image samples have given promising retrieval results with a precision 99% -100% using all three distance measures. Hence, it is found that MSE distance is superior to the AD and ED distance in terms plant image retrieval efficiency. A detailed comparison of EH and EDH using MSE on three class images is shown in Fig.17. The EDH outperforms the EH feature for medicinal plant image retrieval.
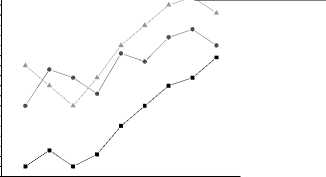
Fig.18 compares the response times for three different feature descriptors. The top line represents the edge direction histogram and line below represent the retrieval time required for edge and color histogram. It is observed that color and edge histogram gives the better response time than edge direction histogram, since EH and EDH involves computation in five directions.
—■— Color Histogram
—•— Edge histogram
—A— Edge direction histogram
santuAmloe vCeraalotropis gigNane a AIncdaiciaa catechu
Plant Species
Plant sp
Figure 18: Average retrieval response time
Hence, the performance of each minimal feature extraction method is evaluated in terms of execution speed and retrieval accuracy. The retrieval results are improved with combined color and edge features.
-
IV. CONCLUSION
In this paper, we have presented an effective histogram based plant image retrieval system using three distance measures. The work presents color and edge histogram based features for recognition and retrieval of plant image into herbs, shrubs and tree images. The retrieval efficiency of tree image samples is good for AD, ED and MSE distance measures. The herbs have short slender stems with green color and height varies with the same species. Hence edge information is inadequate for the detection of herbs. The retrieval results are improved with combined color and edge features. Moreover, the efficiency of shrub images is less due to absence of edges at stem and wide canopy structure. Further scope exists for devising efficient texture and geometrical feature extraction for the improved retrieval performance for herbs and shrubs.
References Color and Edge Histograms Based Medicinal Plants' Image Retrieval
- Basavaraj S. Anami, Suvarna S. Nandyal, A. Govardhan. A Combined Color, Texture and Edge Features Based Approach for Identification and Classification of Indian Medicinal plants. International Journal of Computer Applications, 2010, 6(12): 45-51.
- Basavaraj S. Anami, Suvarna Nandyal, A. Govardhan, P.S.Hiremath. Aspect Ratio Based Identification and Classification of Medicinal Plants in Indian Context.CiiT International Journal of Digital Image Processing, 2011, 3(11): 698-704.
- D Shi, L Xu, L Han. Image retrieval using both color and texture features. The Journal of China Universities of Posts and Telecommunications, 2008, 14:94-99.
- Dong Kwon Park, Yoon Seok Jeon, Chee Sun Won. Efficient Use of Local Edge Histogram Descriptor. International Multimedia Conference Proceedings of ACM workshops on Multimedia, 2000:51-54.
- Dong-cheng Shi, Lan Xu and Ling-yan Han. Image retrieval using both color and texture features. The Journal of China Universities of Posts and Telecommunications. 2007: 94-99.
- Dong-cheng Shi, Lan Xu and Ling-yan Han. Image retrieval using both color and edge histogram. Electronic Imaging and Multimedia Technology, 2008, 6833(2): 6833361-6833367.
- H.J. Tico, M, K. P. A method of Color histogram creation for image retrieval. Proceedings of Nordic Signal Processing Symposium (NORSIG),2000: 157-160.
- Hanife Kebapci, Berrin yanikoglu, Gozde Unal. Plant image Retrieval Using Color and Texture features. The Computer Journal, 2010: 1-16.
- Jianlin Zhang, Wensheng Zou. Content- Based Image Retrieval using Color and Edge direction features. 2nd International Conference on Advanced Computer Control, 2010, 5: 459-462.
- Justin Domke and Yiannis Aloimonos. Deformation and Viewpoint Invariant Color Histograms. Proceedings of British Machine VisionConference(BMVC),2006: 267-270.
- K. Singh, M. Ma, and D.W. Park. Histogram Approach for Content-based Image Retrieval. Proceedings in Visualization, Imaging, and Image Processing.2003, 396: 803-810.
- Kondekar V. H., Kolkure V. S., Kore S.N. Image Retrieval Techniques based on Image Features: A State of Art approach for CBIR. International Journal of Computer Science and Information Security, (IJCSIS), 2010, 7(1): 69-75.
- L. Cinque, S. Levialdi, A. Pellicanò, K.A. Olsen. Color-Based Image Retrieval Using Spatial-Chromatic Histograms. IEEE International Conference on Multimedia Computing and Systems (ICMCS'99), 1999, 2: 969-973.
- R.Vijaya, Arjunan, V. Vijayakumar. Image classification in CBIR systems with colour histogram features. International Conference on Advances in Recent Technologies in Communication and computing, 2009:593-595.
- Shamik Sural, Gang Qian and Sakti Pramanik. Segmentation and histogram generation using the HSV color space for image retrieval. International Conference on Image Processing (ICIP), 2002, 2: 589-592.
- Sheng Yu, Chaobing Huang, Jingli Zhou. Color Image Retrieval Based On Color-Texture-Edge Feature Histograms. International Journal of Image and Graphics, 2006, 6(4): 583-598
