Color and Rotated M-Band Dual Tree Complex Wavelet Transform Features for Image Retrieval

Author: K. Prasanthi Jasmine, P. Rajesh Kumar
Journal: International Journal of Image, Graphics and Signal Processing(IJIGSP) @ijigsp
Article in issue: 9 vol.6, 2014.
Free access
In this paper, a novel algorithm which integrates the RGB color histogram and texture features for content based image retrieval. A new set of two-dimensional (2-D) M-band dual tree complex wavelet transform (M_band_DT_CWT) and rotated M_band_DT_CWT are designed to improve the texture retrieval performance. Unlike the standard dual tree complex wavelet transform (DT_CWT), which gives a logarithmic frequency resolution, the M-band decomposition gives a mixture of a logarithmic and linear frequency resolution. Most texture image retrieval systems are still incapable of providing retrieval result with high retrieval accuracy and less computational complexity. To address this problem, we propose a novel approach for image retrieval using M_band_DT_CWT and rotated M_band_DT_CWT (M_band_DT_RCWT) by computing the energy, standard deviation and their combination on each subband of the decomposed image. To check the retrieval performance, two texture databases are used. Further, it is mentioned that the databases used are Brodatz gray scale database and MIT VisTex Color database. The retrieval efficiency and accuracy using proposed features is found to be superior to other existing methods.
Color, M-band wavelets, Feature Extraction, M-band dual tree complex wavelets, Image Retrieval
Short address: https://sciup.org/15013401
IDR: 15013401
Text of the scientific article Color and Rotated M-Band Dual Tree Complex Wavelet Transform Features for Image Retrieval
Published Online August 2014 in MECS DOI: 10.5815/ijigsp.2014.09.01
With the rapid expansion of worldwide network and advances in information technology there is an explosive growth of multimedia databases and digital libraries. This demands an effective tool that allow users to search and browse efficiently through such a large collections. In many areas of commerce, government, academia, hospitals, entertainment, and crime preventions large collections of digital images are being created. Usually, the only way of searching these collections was by using keyword indexing, or simply by browsing. However, as the databases grew larger, people realized that the traditional keywords based methods to retrieve a particular image in such a large collection are inefficient. To describe the images with keywords with a satisfying degree of concreteness and detail, we need a very large and sophisticated keyword system containing typically several hundreds of different keywords. One of the serious drawbacks of this approach is the need of trained personnel not only to attach keywords to each image (which may take several minutes for one single image) but also to retrieve images by selecting keywords, as we usually need to know all keywords to choose good ones. Further, such a keyword based approach is mostly influenced by subjective decision about image content and also it is very difficult to change a keyword based system afterwards. Therefore, new techniques are needed to overcome these limitations. Digital image databases however, open the way to content based searching. It is common phrase that an image speaks thousands of words. So instead of manual annotation by text based keywords, images should be indexed by their own visual contents, such as color, texture and shape. The main advantage of this method is its ability to support the visual queries. Hence researchers turned attention to content based image retrieval (CBIR) methods. The challenge in image retrieval is to find out features that capture the important characteristics of an image, which make it unique, and allow its accurate identification. Comprehensive and extensive literature survey on CBIR is presented in [1]– [4].
A drawback of standard wavelets is that they are not suitable for the analysis of high-frequency signals with relatively narrow bandwidth. Kokare et al. [16] used the decomposition scheme based on M-band wavelets, which yields improved retrieval performance. Unlike the standard wavelet decomposition, which gives a logarithmic frequency resolution, the M-band decomposition gives a mixture of a logarithmic and linear frequency resolution. Further as an additional advantage, M-band wavelet decomposition yields a large number of subbands, which improves the retrieval accuracy. One of the drawbacks with M-band wavelet in content-based image retrieval is that computational complexity increases and hence retrieval time with number of bands. Gopinath and Burrus [17] introduced Cosine-modulated class of multiplicity M wavelet tight frames (WTF’s). In these WTF’s, the scaling function uniquely determines the wavelets. This is in contrast to general multiplicity M case, where one has to, for any given application, design the scaling function and the wavelets. Hsin [16] used a modulated wavelet transform approach for texture segmentation and reported that texture segmentation performance can be improved with this approach. Guillemot and Onno [19] had used Cosine-modulated wavelet for image compression. They have presented procedure for designing Cosine-modulated wavelets for arbitrary length filters. This procedure allows obtaining filters with high stopband attenuation even in the presence of additional regularity constraints. Their results show that these filter solution provide good performance in image compression. The advantages of the Cosine-modulated wavelet are their low design and implementation complexities, good filter quality, and ease in imposing the regularity conditions, which yields improved retrieval performance both in terms of accuracy and retrieval time.
The main contributions of this paper are summarized as follows. First, in this paper we have presented novel texture features for content-based image retrieval using M-band DT_CWT, M-band DT_RCWT and RGB color histogram. Second, our approach of using the d1 distance metric for similarity measurement improves the retrieval performance from 59.36% to 78.23% compared with the traditional Euclidean distance metric (where same features were used but Euclidean distance metric is used for similarity measurement). This shows that good performance in retrieval comes not just from a good set of features but also together with the use of suitable similarity measurement, which supports our approach.
The organization of the paper as follows: In section I, a brief review of image retrieval and related work is given. Section II, presents a concise review of M-band DT_CWT, M-band DT_RCWT and RGB colorhistogram. Section III, presents the feature extraction and similarity measure. Experimental results and discussions are given in section IV. Based on above work conclusions are derived in section V.
-
II. M-Channel Filter Bank
The structure of the classical one-dimensional filter bank is depicted in Fig. 1. The input signal x(n) is filtered by a set of M filters hi(n) . The desired filter responses are shown in Fig. 2. The response of the ith filter occupies only a subband of [-π , π]. Subband signals are downsampled by M to give the signal d i (n) . At the reconstruction side these subband signals are passed through g i (n) and up sampled by M to get output signal y(n) . The filters h i (n) are analysis filters constituting the analysis filter bank and the filters g i (n) are the synthesis filters constituting the synthesis filter bank. Perfect reconstruction of the signal is an important requirement of M-Channel filter bank. Filter bank is said to be perfect reconstruction if y(n) = x(n) . Under certain conditions, perfect reconstruction filter banks are associated with wavelet frames for L2(R) [17]. This association is a correspondence between the filters and scaling and wavelet vectors associated with the wavelet frames.
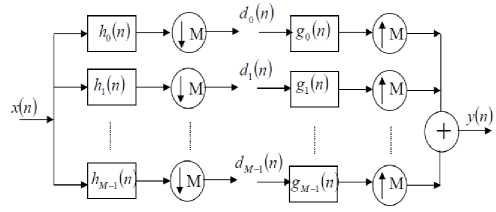
Fig. 1: M- Channel filter bank
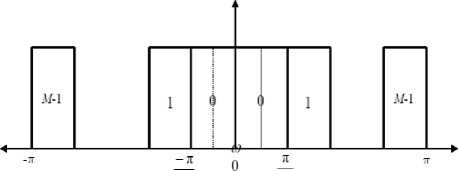
Fig. 2: Ideal frequency responses in M channel filter bank
-
A. Dual Tree Complex Wavelet Transform (DT_CWT)
The 1-D DT-CWT decomposes a signal f ( t ) in terms of a complex shift and dilated mother wavelet ψ ( t ) and scaling function φ ( t )
f ( t ) = E j j i ( t ) + E E c , v j, i (t ) (1)
1 e Z
j — j о l e Z
Where s is scaling coefficient and c is complex wavelet coefficient with ф and Vji complex: ф)о = Ф 0, i + Ф o, i , v j = v , i + i v j 0, i . The v ; о , i and Vi / are themselves real wavelets: the complex wavelet transform is combination of two real wavelet transforms. Fig. 3 shows that the implementation of 1-D DT-CWT.
2-D DT-CWT can be implemented using separable wavelet transforms like 2-D wavelet transform. Impulse responses of six wavelets associated with 2-D complex wavelet transform is illustrated in Fig. 4. These six wavelet sub-bands of the 2-D DT-CWT are strongly oriented in { + 15 0 , + 45 0 , + 75 0 , - 15 0 , - 45 0 , - 75 0 } direction and captures image information in that direction. Frequency domain partition of DT-CWT resulting from two level decomposition is shown in Fig. 5.
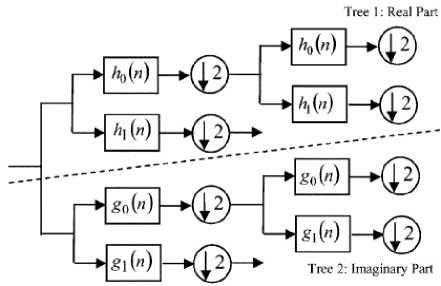
Fig. 3: 1-D dual- tree complex wavelet transform
-
B. M-Band Wavelet
There is a close relationship between M-band wavelets and M-channel filter banks [17]. M-band wavelets are a generalization of the conventional wavelets reported in the literature [20], [21]. Disadvantage of using standard wavelets is that they are not suitable for the analysis of high-frequency signals with relatively narrow bandwidth [5]. To overcome this problem M-band orthonormal wavelet were developed. M-band was developed by generalizing the two band wavelet, which was designed by Daubechies [22]. The M-band orthonormal wavelets give a better energy compaction than two band wavelets by zooming into narrow band high frequency components of a signal [23].
In M-band wavelets there are M-1 wavelets vi ( x ), i = I,2,...., M 1, which form the basis functions and are associated with the scaling functions. The M-band wavelet system forms a tight frame for the set of square integrable functions defined over the set of real
. (L2(R)) f (x) e(L2(R))• numbers [17]. A functionis represented by m —1
f (x) = E E E ( f (x), Vi,m,n (x)} Vi,m,n (x)
i =1 meZneZ where Z represents the set of integers and. . is an inner product. v (x) is scaled and translated to obtain Vi,m,„ (x) functions [17].
V i , m , n ( x ) = Mm /2 Vi ( Mm /2 x - n ); i = 1,2,...., M - 1, m e Z , n e Z
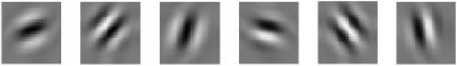
Fig. 4: Impulse response of six wavelet filters of DT-CWT
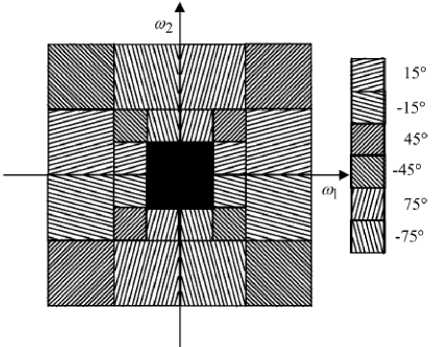
Fig. 5: Frequency domain partition in DT-CWT resulting from two level decomposition.
Gopinath and Burrus [22] have shown that the wavelet functions Vi ( x ) are defined from a unique, compactly supported scaling function V o ( x ) e L ( R ) with support in [0, (N -1) (M -1)] by
v ( x ) = M N E h ( x '^Vq ( Mx - n ); i = 1,2,...., M - 1 (4)
n = 0
The scaling function satisfies the recursion equation:
N - 1
v 0 ( x ) = M EE h 0 ( x ) V o ( Mx - n ); (5)
n = 0
Where h0 is a scaling filter of length N = M*K (K is regularity of scaling function), which satisfies the following constraints.
N - 1
E h o ( n ) = V M (6)
n = 0
N - 1
^ h o ( n ) h o ( n + Mi ) = 8 ( i ) (7)
n = 0
The ( M 1) h l filters are also of length N and are called the wavelet filters and satisfy the equation
N - 1
£ h ( n ) h „ ( n + Mi ) = 5 ( i ) 5 ( l - m ) (8)
n = 0
-
C. M-Band DT_CWT
The dual tree complex wavelet (DT_CWT), which was originally developed using two 2-band DWTs was extended to M-band DWTs recently in [24], and used for image processing in [25]. The M-band DT_CWT in [24, 25] employes two M-band DWTs where the wavelets associated with the two transforms from Hilbert transform pairs.
A typical M-Band DT_CWT analysis filter bank for M =4 is shown in Fig. 6. The filter bank in essence is a set of bandpass filters with frequency and orientation selective properties. In the filtering stage we make use of biorthonormal M-band DT_CWT to decompose the texture image into M×M-channels, corresponding to different direction and resolutions. The one dimensional M (=4) -band wavelet filter impulse responses are given by ^ and their corresponding transfer functions are denoted by h for l=0, 1, 2, 3 . ^ is the scaling function (lowpass filter) and other ^ ’s correspond to the wavelet functions (bandpass filters). In this work we have obtained the
M channel 2-D separable transform by the tensor product of M-band 1-D DT_CWT filters. At each level with M=4, the image is decomposed in to M×M (=16) channels. Table I shows the 4-band dual tree wavelet filter coefficients [16] used in the experiments.
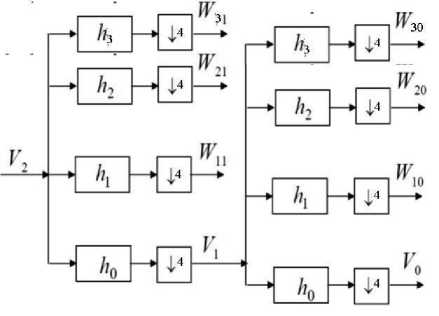
Fig. 6: M- Band (M=4) wavelet filter bank structure
-
D. Rotated M-band Dual Tree Complex Wavelets (M-Band_DT_RCWT)
Rourke and Stevenson [26] have used diamond shaped wavelet filters for image compression. They have shown that this technique incorporates some of the properties of human visual system. Kim and Udpa [27] have designed rotated wavelet filters using Haar wavelet filters for texture classification. Though the Haar wavelet transform has a number of advantages such as conceptually simple, fast and memory efficient, but it has certain limitations, which can be a problem for some applications like capturing high frequency information in an image such as edges. In generating each set of averages for the next level and each set of detail coefficients, the Haar transform performs an average and difference on a pair of values. Then the algorithm shifts over by two values and calculates another average and difference on the next pair. The high frequency coefficient spectrum should reflect all high frequency changes. The Haar window is only two elements wide. If a big change takes place from an odd pixel location to an even pixel location, the change will not be reflected in the high frequency coefficients. Edge information is a very important feature in texture images. The wavelet developed by Daubechies retains edge information by using overlapping windows. This motivates us to use Daubechies wavelet coefficients for designing rotated M-band dual tree complex wavelet filters. Here we have designed a new set of rotated M-band dual tree complex wavelet filters using Table I filter coefficents. We have demonstrated the effectiveness of use of the M_band_DT_RCWT in addition to the M_band_DT_CWT for extracting texture features in CBIR. Rotated M-band dual tree complex wavelet filter sets are obtained by rotating the M-band dual tree complex wavelet filter by 450 so that the decomposition is performed along the new directions f ' and f ' as shown in Fig. 7, which are 450 apart from decomposition directions of the M_band_DT_CWT. The more details about M-band wavelet in [11] and rotated wavelet filter [16].
-
E. RGB Color Histogram
In content based Image retrieval, color descriptor has been one of the first choices because if one chooses a proper representation, it can be partially reliable even in presence of changes in lighting, view angle, and scale. In image retrieval, the color histogram is the most commonly used global color feature. It denotes the probability of the intensities of the three color channels.
Typical characterization of color composition is done by color histograms. In 1991 Swain and Ballard [28] proposed the method, called color indexing, which identifies the object using color histogram indexing. The color histogram is obtained by counting the number of times each color occurs in the image array. Histogram is invariant to translation and rotation of the image plane, and change only slowly under change of angle of view [28].
A color histogram H for a given image is defined as a vector
H = { H [0], H [1],....., H [ i ],.... H [ N ] } (9)
where i represent the color in color histogram and H[i] represent the number of pixels of HSV color i in the image, and N is the number of bins used in color histogram. For comparing the histogram of different sizes, color histogram should be normalized. The normalized color histogram is given as
H ' = (10)
p where p is the total number of pixels in the image.
In this paper, RGB color space is used i.e. histogram for each color channel is used as feature for image database.
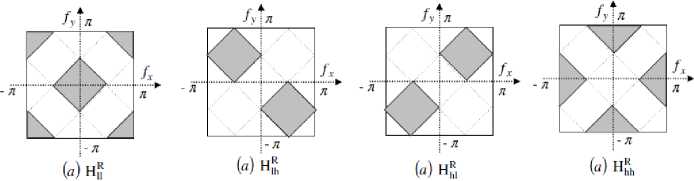
Fig. 7: Frequency domain partition resulting from one level rotated filter.
Table 1. Four band Dual Tree Complex Wavelet Filter Coefficients used in Experiments.
|
h 0 |
h 1 |
h 2 |
h 3 |
|
0.030550699 |
0.01990811 |
0.01990811 |
0.030550699 |
|
-0.01990811 |
-0.030550699 |
0.030550699 |
0.01990811 |
|
-0.058475205 |
-0.038104884 |
-0.038104884 |
-0.058475205 |
|
-0.038104884 |
-0.058475205 |
0.058475205 |
0.038104884 |
|
-0.036706282 |
-0.168841015 |
-0.168841015 |
-0.036706282 |
|
0.168841015 |
0.036706282 |
-0.036706282 |
-0.168841015 |
|
0.4095423 |
0.544260466 |
0.544260466 |
0.4095423 |
|
0.544260466 |
0.4095423 |
-0.4095423 |
-0.544260466 |
|
0.544260466 |
-0.4095423 |
-0.4095423 |
0.544260466 |
|
0.4095423 |
-0.544260466 |
0.544260466 |
-0.4095423 |
|
0.168841015 |
-0.036706282 |
-0.036706282 |
0.168841015 |
|
-0.036706282 |
0.168841015 |
-0.168841015 |
0.036706282 |
|
-0.038104884 |
0.058475205 |
0.058475205 |
-0.038104884 |
|
-0.058475205 |
0.038104884 |
-0.038104884 |
0.058475205 |
|
-0.01990811 |
0.030550699 |
0.030550699 |
-0.01990811 |
|
0.030550699 |
-0.01990811 |
0.01990811 |
-0.030550699 |
-
III. Feature Extraction
Each image from the database was analyzed using M_band_DT_CWT. The analysis was performed up to third level (16×3×2=96 subbands) of the wavelet decomposition. For constructing the feature vector feature parameters such as energy, standard deviation and combinations of both were computed separately on each subband and are stored in vector form. The basic assumption of this approach is that the energy distribution in the frequency domain identifies a texture. Besides providing acceptable retrieval performance from large texture, this approach is partly supported by physiological studies of the visual cortex as reported by Hubel and Wiesel [29] and Daugman [30]. The energy and standard deviation of decomposed subbands are computed as follows:
MN
^ = E k = M X N g gl W (11)
Standard Deviation = 0 =
MN
ZE ( W j - « - ) 2
M x N i = 1 j = 1
where W is the wavelet-decomposed subband, M×N is the size of wavelet-decomposed subband, k is the number of subbands (k=18 for two levels), and ^ is the subband mean value.
A feature vector is now constructed using Ek and σk as feature components. Length of feature vector will be equal to (No. of subbands × No. of feature parameters used in combination) elements. Resulting feature vectors are as follows:
Using only standard deviation feature measure f. = [O"1,^2,.....^k ]
Using combination of standard deviation and energy feature measure fCT = [0-1,02,^kE1, E2,Ek ]
For creation of feature database above procedure is repeated for all the images of the image database and these feature vectors are stored in feature database.
-
A. Similarity Distance Measure
In the presented work four types of similarity distance metric are used as shown below:
Manhattan or L1 or city-block Distance
This distance function is computationally less expensive than Euclidean distance because only the absolute differences in each feature are considered. This distance is sometimes called the city block distance or L1 distance and defined as
D ( Q , T ) = тм ( Q ) - J T )| (16)
Euclidean or L2 Distance
For p=2 in the equation (1.1) give the Euclidean distance and defined as:
D ( Q , T ) =[ L i| f ( Q ) - f j ( T )| J (17)
The most expensive operation is the computation of square root.
1 N 1
Group Precision ( GP ) = — P^P (21)
nx i = 1
1 £
Average Retrieval Precision ( ARP ) = GP (22)
Г j - 1
Number of relevant images retrieved TotalNumberof relevant images
1 N 1
Group Recall ( GR ) = — R (24)
N 1 i = 1
1 ^1
Average Retrieval Rate ( ARR ) = — ^ GR (25)
Г j _ 1
D 1 Distance
Lg
D (Q, T) = £ i=1
f T , i fQ , i
Canberra Distance
D ( Q , T )
Lg
=z
= 1
fT, i fQ, i fr, i + fQ, i
where N is number of relevant images and Г, is number of groups.
Table 2 summarizes the retrieval results of the proposed method (M_band_DT_CWT+ M_band_DT_RCWT) and other previously available methods in terms of average rate and Table 3 and Fig. 8 illustrate the performance of proposed method and other available methods in terms of ARR. Table 4 and Fig. 9 summarize the performance of proposed method with the combination of energy, standard deviation in terms of ARP. Table V and Fig. 10 illustrate the performance of proposed method with different distance measures in terms of average retrieval rate.
where Q is query image, Lg is feature vector length, T is image in database; f is i th feature of image I in the database, f is i th feature of query image Q.
-
IV. Experimental Results and Discussions
-
A. Experiment #1
Brodatz database is used in our experiment that consists of 116 different textures comprising of 109 textures from Brodatz texture photographic album [31], seven textures from USC database [32]. The size of each texture is 512 x 512 and is further divided into sixteen 128 x 128 non-overlapping sub-images, thus creating a database of 1856 (116 x 16) images.
The performance of the proposed method is measured in terms of average retrieval precision (ARP) and average retrieval rate (ARR) by following equations.
Precision ( P ) =
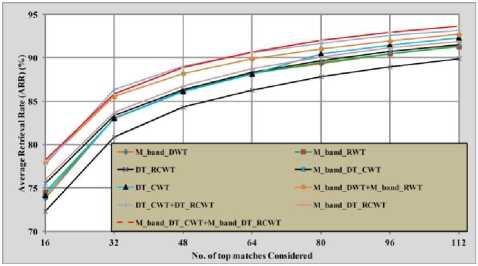
Fig. 8: Comparison of proposed method with other existing methods in terms average retrieval rate.
From the Tables II to V and Fig. 8 to 10 the following points can be observed:
-
1. The average retrieval rate (ARR) of the proposed method (78.23%) is more as compared to M_band_DWT (78.23%) and M_band_RWT (74.52%), DT_CWT (74.73%), DT_RCWT (71.17%), DT_CWT + DT_RCWT (77.75%), M_Band_DT_CWT (75.54%),
-
2. The performance of the proposed method with d 1 distance (78.23%) is more as compared to Canberra (76.61%), Euclidean (59.36%), and Manhattan distance (73.37%).
M_Band_DT_RCWT (75.94%), GT (74.32%) and (DWT (69.61%).
From Tables 2 to V, Fig. 9 to 10, and above observations, it is clear that the proposed method is outperforming the M_band_DWT, M_band_RWT, GT, DT-CWT, DT-RCWT and DWT techniques in terms of ARR and ARP. Fig. 11 illustrates the retrieval results of query image based on the proposed method.
Table 2. Retrieval results of all techniques in terms of average retrieval rate
T1: DT_CWT; T2: DT_RCWT; T3: M_band_DWT; T4: M_band_RWT; T5: M_band_DT_CWT;
T6: M_band_DT_RCWT
|
GT |
DWT |
T1 |
T2 |
T1+T2 |
T3 |
T4 |
T3+T4 |
T5 |
T6 |
PM |
|
|
Average Retrieval Rate |
74.32 |
69.61 |
74.73 |
71.17 |
77.75 |
73.81 |
74.52 |
77.98 |
75.54 |
75.94 |
78.23 |
Table 3 Retrieval results of all techniques in terms of average retrieval rate
|
Number of top matches considered |
|||||||
|
16 |
32 |
48 |
64 |
80 |
96 |
112 |
|
|
M_band_DWT |
73.81 |
83.05 |
86.14 |
88.28 |
89.31 |
90.47 |
91.39 |
|
M_band_RWT |
74.52 |
83.03 |
86.21 |
88.15 |
89.47 |
90.49 |
91.29 |
|
M_band_DWT+ M_band_RWT |
77.98 |
85.52 |
88.22 |
89.89 |
91.05 |
91.93 |
92.71 |
|
DT_CWT |
74.16 |
83.03 |
86.13 |
88.11 |
90.48 |
91.48 |
92.3 |
|
DT_RCWT |
72.33 |
80.88 |
84.32 |
86.28 |
87.82 |
88.98 |
89.92 |
|
DT_CWT+DT_RCWT |
77.75 |
86.33 |
89.02 |
90.57 |
91.65 |
92.57 |
93.19 |
|
M_band_DT_CWT |
75.54 |
83.33 |
86.36 |
88.36 |
89.66 |
90.76 |
91.56 |
|
M_band_DT_RCWT |
75.94 |
83.71 |
86.78 |
88.75 |
90.11 |
91.16 |
91.90 |
|
M_band_DT_CWT + M_band_DT_RCWT |
78.23 |
85.81 |
88.87 |
90.65 |
91.99 |
92.98 |
93.69 |
Table 4. Retrieval results of Proposed Method in terms of average retrieval Precision
|
Number of top matches considered |
|||||||||
|
1 |
3 |
5 |
7 |
9 |
11 |
13 |
15 |
16 |
|
|
M_band_DWT |
100 |
95.31 |
92.17 |
89.07 |
86.23 |
83.26 |
79.85 |
76.03 |
73.81 |
|
M_band_RWT |
100 |
95.38 |
92.24 |
89.22 |
86.19 |
83.19 |
79.92 |
76.49 |
74.52 |
|
M_band_DWT+ M_band_RWT |
100 |
96.06 |
93.08 |
91.05 |
88.08 |
86.02 |
83.02 |
79.08 |
77.98 |
|
M_band_DT_CWT |
100 |
94.64 |
91.53 |
88.77 |
86.19 |
83.59 |
80.702 |
77.47 |
75.54 |
|
M_band_DT_RCWT |
100 |
94.45 |
91.22 |
88.50 |
86.15 |
83.65 |
80.81 |
77.66 |
75.94 |
|
M_band_DT_CWT+ M_band_DT_RCWT |
100 |
96.32 |
93.41 |
90.60 |
88.17 |
85.75 |
83.02 |
79.99 |
78.23 |
Table 5. Performance of Proposed Method with Different Distance Measures
|
Method |
Distance Measure |
Number of top matches considered |
||||||
|
16 |
32 |
48 |
64 |
80 |
96 |
112 |
||
|
Proposed Method (M_band_DT_CWT+ M_band_DT_RCWT) |
Manhattan |
73.37 |
82.46 |
85.99 |
88.07 |
89.35 |
90.39 |
91.29 |
|
Canberra |
76.61 |
84.22 |
87.284 |
89.065 |
90.38 |
91.41 |
92.13 |
|
|
Euclidean |
59.36 |
69.22 |
73.97 |
77.04 |
79.29 |
81.03 |
82.44 |
|
|
d 1 |
78.23 |
85.81 |
88.87 |
90.65 |
91.99 |
92.98 |
93.69 |
|
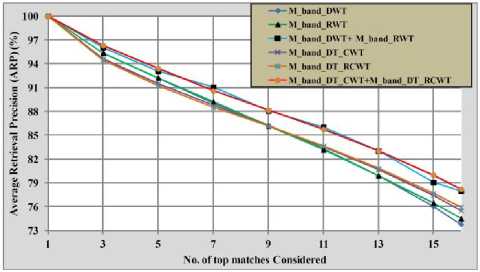
Fig. 9: Comparison of proposed method with other existing methods in terms average retrieval precision.
Band DTCWT+RGB Color histogram) with and other existing methods. Fig. 12 (a) illustrate the retrieval results of proposed method and other existing methods in terms of average retrieval rate respectively. From Fig. 12 (a), it is evident that the proposed method is outperforming the other existing methods. The results of the proposed method are also compared with the different distance measures as shown in Fig. 12 (c). From Fig. 12 (c), it is found that the d 1 distance is outperforming the other distances.
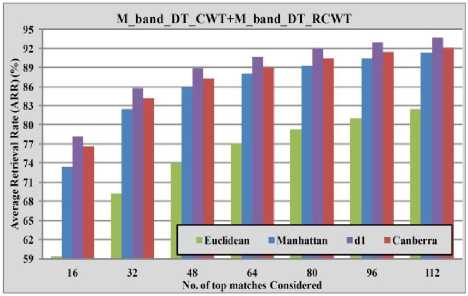
Fig. 10: Performance of proposed method with different distance measures in terms average retrieval rate.
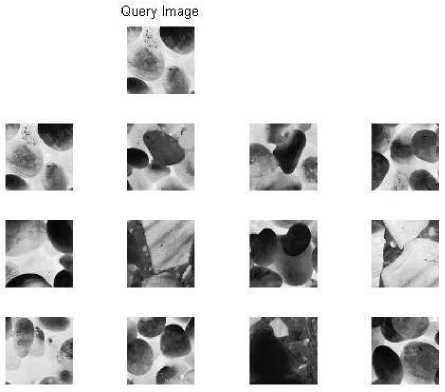
Fig. 11: Query results of proposed method
-
B. Experiment #2
The MIT VisTex database is used in our experiment which consists of 40 different textures [33]. The size of each texture is 512 x 512 . Each 512 x 512 image is divided into sixteen 128 x 128 non-overlapping subimages, thus creating a database of 640 (40 x 16) images. The performance of the proposed method is measured in terms of average retrieval rate (ARR).
This database is used to compare the performance of the proposed method (M-band DTCWT+Rotated M-
-
V. Conclusions
A new image indexing and retrieval algorithm using the combination of M_band_DT_CWT, M_band_DT_RCWT and RGB color histogram is proposed in this paper. The performance of the proposed method is tested by conducting experiments on Brodatz and MIT VisTEx databases. The results after being investigated show a significant improvement in terms of average retrieval rate and average retrieval precision as compared to other existing transform domain techniques
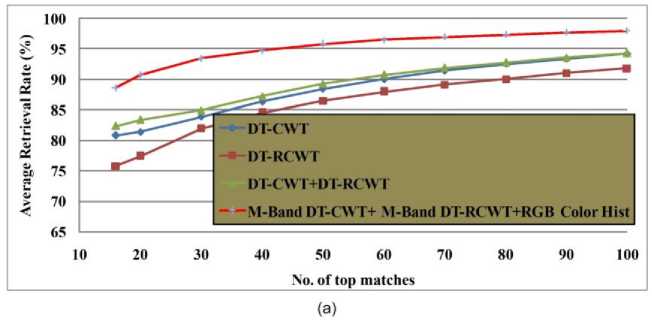
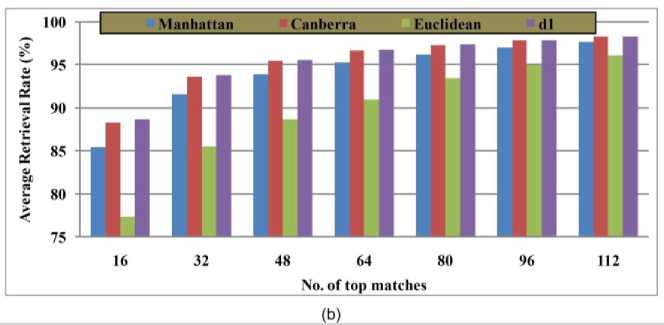
Fig. 12. Comparison of proposed method with other exiting transform domain methods in terms of: (a) average retrieval precision, (b) average retrieval rate and (c) performance of proposed method using various distance measures.
References Color and Rotated M-Band Dual Tree Complex Wavelet Transform Features for Image Retrieval
- Y. Rui and T. S. Huang, Image retrieval: Current techniques, promising directions and open issues, J.. Vis. Commun. Image Represent., 10 (1999) 39–62.
- A. W.M. Smeulders, M. Worring, S. Santini, A. Gupta, and R. Jain, Content-based image retrieval at the end of the early years, IEEE Trans. Pattern Anal. Mach. Intell., 22 (12) 1349–1380, 2000.
- M. Kokare, B. N. Chatterji, P. K. Biswas, A survey on current content based image retrieval methods, IETE J. Res., 48 (3&4) 261–271, 2002.
- Ying Liu, Dengsheng Zhang, Guojun Lu, Wei-Ying Ma, Asurvey of content-based image retrieval with high-level semantics, Elsevier J. Pattern Recognition, 40, 262-282, 2007.
- Liu, F., Picard, R.W., 1996. Periodicity, directionality, and randomness: Wold features for image modeling and retrieval. IEEE Trans. Pattern Anal. Machine Intell. 18, 722–733.
- J. R. Smith and S. F. Chang, Automated binary texture feature sets for image retrieval, Proc. IEEE Int. Conf. Acoustics, Speech and Signal Processing, Columbia Univ., New York, (1996) 2239–2242.
- A. Ahmadian, A. Mostafa, An Efficient Texture Classification Algorithm using Gabor wavelet, 25th Annual international conf. of the IEEE EMBS, Cancun, Mexico, (2003) 930-933.M.
- M. N. Do and M. Vetterli, “The contourlet transform: An efficient directional multi-resolution image representation,” IEEE Trans. Image Process., vol. 14, no. 12, pp. 2091–2106, 2005.
- M. Unser, Texture classification by wavelet packet signatures, IEEE Trans. Pattern Anal. Mach. Intell., 15 (11): 1186-1191, 1993.
- B. S. Manjunath and W. Y. Ma, Texture Features for Browsing and Retrieval of Image Data, IEEE Trans. Pattern Anal. Mach. Intell., 18 (8): 837-842, 1996.
- M. Kokare, P. K. Biswas, B. N. Chatterji, Texture image retrieval using rotated Wavelet Filters, Elsevier J. Pattern recognition letters, 28:. 1240-1249, 2007.
- M. Kokare, P. K. Biswas, B. N. Chatterji, Texture Image Retrieval Using New Rotated Complex Wavelet Filters, IEEE Trans. Systems, Man, and Cybernetics, 33 (6): 1168-1178, 2005.
- M. Kokare, P. K. Biswas, B. N. Chatterji, Rotation-Invariant Texture Image Retrieval Using Rotated Complex Wavelet Filters, IEEE Trans. Systems, Man, and Cybernetics, 36 (6): 1273-1282, 2006.
- L. Birgale, M. Kokare, D. Doye, Color and Texture Features for Content Based Image Retrieval, International Conf. Computer Grafics, Image and Visualisation, Washington, DC, USA, (2006) 146 – 149.
- Subrahmanyam, A. B. Gonde and R. P. Maheshwari, Color and Texture Features for Image Indexing and Retrieval, IEEE Int. Advance Computing Conf., Patial, India, (2009) 1411-1416.
- Manesh Kokare, P.K. Biswas, B.N. Chatterji, Cosine-modulated wavelet based texture features for content-based image retrieval, Pattern Recognition Letters 25 (2004) 391–398.
- R.A. Gopinath, and C.S. Burrus, Wavelets and filter banks, in: C.K. Chui (Ed.), wavelets: A tutorial in theory and applications, Academic Press, San Diego, CA., (1992) 603-654.
- Hsin, H.C., 2000. Texture segmentation using modulated wavelet transform. IEEE Trans. Image Process. 9 (7), 1299–1302.
- Guillemot, C., Onno, P., 1994. Cosine-modulated wavelets: New results on design of arbitrary length filters and optimization for image compression. In: Proc. Internat. Conf. on Image Processing 1, Austin, TX, USA, pp. 820–824.
- S. Mallat, “A Theory for multiresolution signal decomposition: the wavelet representation,” IEEE Trans. on Pattern Analysis and Machine Intelligence, 11(7) 674-693, 1989.
- O. Rioul and M. Veterli, “Wavelets and signal processing,” IEEE Signal Processing Magazine, Vol.8 pp. 14-38, 1991.
- I. Daubechies, “Orthonormal bases of compactly supported wavelets”, Communications on Pure and Applied Mathematics, Vol. 41, pp 909-996, 1988.
- H. Zou, and A.H. Tewfik, “Discrete orthogonal M-band wavelet decompositions,” in Proceedings of Int. Conf. on Acoustic Speech and Signal Processing, Vol.4, pp. IV-605-IV-608, 1992.
- C. Chaux, L. Duval and J. C. Pesquet. Hilbert pairs of M-band orthonotmal wavelet bases. In Proc. Eur. Sig. and Image Proc. Conf., 2004.
- C. Chaux, L. Duval and J. C. Pesquet, “Image analysis using a dual-tree M-band wavelet transform. IEEE Trans. Image Processing, 15 (8): 2397-2412, August 2006.
- Rourke, T.P.O., Stevenson, R.L., 1995. Human visual system based wavelet decomposition for image compression. J. Visual Commun. Image Representation 6, 109–121.
- Kim, N.D., Udpa, S., 2000. Texture classification using rotated wavelet filters. IEEE Trans. Syst. Man Cybernet. Part A: Syst. Human 30, 847–852.
- M. J. Swain and D. H. Ballar, Indexing via color histograms, Proc. 3rd Int. Conf. Computer Vision, Rochester Univ., NY, (1991) 11–32.
- Hubel, D.H., Wiesel, T.N., 1962. Receptive fields, binocular interaction and functional architecture in the cat’s visual cortex. J. Physiol. 160, 106–154.
- Daugman, J., 1980. Two-dimensional spectral analysis of cortical receptive field profile. Vision Res. 20, 847–856.
- P. Brodatz, “Textures: A Photographic Album for Artists and Designers,” New York: Dover, 1996.
- University of Suthern California, Signal and Image Processing Institute, Rotated Textures. [Online]. Available: http://sipi.usc.edu/database/.
- MIT Vision and Modeling Group, Vision Texture. [Online]. Available: http://vismod.www.media.mit.edu.
