Colorization-based U-Net Architecture for Precise Liver Tumor Segmentation in Clinical CT Images

Author: Ika Novita Dewi, Abu Salam, Danang Wahyu Utomo
Journal: International Journal of Image, Graphics and Signal Processing @ijigsp
Article in issue: 3 vol.17, 2025.
Free access
Accurate liver and tumor segmentation from medical imaging plays an important role in effective diagnosis and appropriate treatment planning, especially in the case of liver cancer. This research proposed a novel U-Net architecture enhanced with image colorization techniques for precise liver tumor segmentation in clinical CT images. The proposed image colorization-based U-Net, which integrates both grayscale-based and RGB-based architectures, was tested on the LiTS dataset and real clinical data. This evaluation aimed to measure its effectiveness in liver and tumor segmentation across different imaging conditions. The grayscale-based U-Net achieved high segmentation accuracy, achieving a DICE coefficient of 99.95% for liver segmentation and 90.44% for tumor segmentation. This strong performance suggests its ability to precisely delineate anatomical structures. The model also achieved an RMSE of 0.019, a PSNR of 82.14, and a pixel accuracy of 0.316, reflecting its capability to reduce reconstruction while preserving overall image quality. These findings further support the model’s reliability in challenging imaging scenarios, suggesting its potential as an effective tool for liver tumor segmentation. To further validate its real-world applicability, the model was tested on clinical data, where it effectively segmented liver and tumor regions across diverse imaging conditions. By addressing challenges such as low contrast and variability in tumor characteristics, the use of grayscale-based colorization techniques enhances feature representation, leading to improved segmentation outcomes. The findings demonstrate the potential of the proposed approach to enhance liver and tumor localization, providing a robust framework for clinical applications.
Liver tumor, CT scan, Clinical data, LiTS dataset, Image segmentation, U-Net architecture, Image colorization
Short address: https://sciup.org/15019727
IDR: 15019727 | DOI: 10.5815/ijigsp.2025.03.05
Text of the scientific article Colorization-based U-Net Architecture for Precise Liver Tumor Segmentation in Clinical CT Images
Liver tumors are a significant health concern as they often progress without noticeable symptoms in the early stages, making early detection challenging [1]. In 2020, the World Health Organization (WHO) reported that liver cancer had sixth highest rate of deaths worldwide, which accounted for approximately 830,000 deaths [2]. This alarming mortality rate emphasizes the need for early and accurate detection methods to improve patient outcomes. Computed Tomography (CT) images are widely used for detecting liver tumors, as they provide detailed information about the position, size, and shape of tumors [3, 4]. To fully leverage the detailed anatomical insights provided by CT images, accurate segmentation of the images is essential for identifying and isolating liver tumors [5]. Segmentation of CT images has often been performed manually or semi-manually by radiologists, a process that is time-consuming, laborintensive, and prone to variability due to differences in interpretation [6]. This process faces significant challenges, particularly in grayscale CT images, where overlapping intensities between tumors and surrounding tissues, including vasculature and fibrotic areas, complicate precise delineation. Additionally, low-contrast tumors, such as hypodense lesions, are often difficult to distinguish from normal liver parenchyma, further hindering segmentation accuracy [6].
Advancements in medical imaging have led to the development of automated segmentation techniques to address the limitations of manual processes [7]. Among the various methodologies developed, the U-Net architecture has gained significant attention for its effectiveness in segmentation tasks [8]. Its encoder-decoder structure, augmented with skip connections, enables the model to capture both fine-grained local features and broader contextual information, making it particularly adept at handling the complexities of liver tumor segmentation [10]. U-Net has shown promise in addressing issues such as anatomical variability and the intricate structures associated with liver tumors. Despite these advancements, current methods often struggle with challenging imaging conditions, including low-contrast CT images and high noise levels, which can adversely impact segmentation accuracy.
Several variations of U-Net have been proposed to improve segmentation include multiple layer U-Net [10], fully convolutional neural (FCN) network [11], modified U-Net [12] and EU-Net [13]. These models are each designed to address specific challenges and enhance segmentation performance. These models incorporate various enhancements, such as deeper architectures, advanced feature extraction techniques, and improved regularization, to optimize segmentation performance. While these variations have shown success in addressing general segmentation challenges, they often fail to adequately enhance visual contrast and feature representation in grayscale CT images, limiting their effectiveness in tasks like liver tumor segmentation. Compared to state-of-the-art models like ResNet, which is highly effective in extracting deep global features through residual connections [14] its architecture is primarily optimized for classification tasks. However, ResNet lacks the spatial resolution required for accurately segmenting small or irregularly shaped liver tumors, limiting its effectiveness in precise medical image segmentation [15].
A promising solution to improve segmentation accuracy is the application of image colorization techniques. These techniques have been explored in various medical imaging studies to enhance feature representation and improve segmentation performance [16]. RGB-based models employ pseudo-color transformations, assigning color values to different intensity levels in grayscale images to improve contrast and distinguish between tumor and non-tumor regions [17]. While pseudo-color transformations have shown improvements in segmentation, they introduce higher computational complexity and can create artifacts, which may reduce clinical reliability. Alternatively, grayscale-based colorization provides an efficient alternative by enhancing contrast without altering the original intensity information [18]. This approach enables deep learning models, such as U-Net, to more effectively differentiate anatomical structures and pathological features, particularly in low-contrast CT images. Unlike RGB-based transformations, grayscale-based colorization minimizes the risk of misrepresentation, ensuring more reliable segmentation results even in noisy imaging conditions [19].
Although image colorization techniques have been successfully applied in various medical imaging domains, their integration with U-Net for liver tumor segmentation remains largely unexplored. Several studies have demonstrated the benefits of colorization in enhancing segmentation accuracy. For example, Wang et al. (2022) demonstrated the potential of deep learning models for the automatic colorization of grayscale medical images, which not only reduced network training time but also significantly improved segmentation accuracy [20]. Similarly, Yang and Wei (2022) utilized hybrid methods to colorize COVID-19 lung CT images, achieving substantial improvements in visualization and enabling more precise segmentation of lung tissues [21]. Fajar et al. (2021) applied automatic colorization techniques to 3D volumetric brain CT images using a ray marching algorithm, which enhanced rendering quality and provided more accurate representations of volumetric data, thereby contributing to improved medical imaging and analysis [22]. However, integrating colorization techniques with advanced architectures like U-Net presents challenges, including maintaining anatomical accuracy while minimizing artifacts and misleading visual effects.
This research aims to improve liver tumor segmentation by integrating an innovative image colorization technique with the U-Net architecture. The proposed approach enhances visual contrast and feature representation, enabling more accurate delineation of anatomical structures and pathological features in grayscale CT images. By addressing the limitations of existing segmentation methods, such as poor performance in low-contrast or noisy imaging conditions, this technique seeks to significantly improve both diagnostic accuracy and operational efficiency. The incorporation of colorized images within the U-Net framework is expected to optimize segmentation performance by better distinguishing tumor regions from surrounding tissues. Additionally, this research offers practical utility in clinical applications, as the enhanced segmentation outcomes have the potential to support more precise diagnostic workflows and treatment planning. To validate its effectiveness, the proposed model is evaluated using the Liver Tumor Segmentation (LiTS) dataset, a widely recognized benchmark for liver tumor segmentation. The LiTS dataset consists of a diverse collection of contrast-enhanced CT scans from multiple clinical centers, containing annotated images with varying tumor sizes, shapes, and intensities. Its large sample size and variety provide a robust basis for training and evaluating segmentation models under realistic clinical conditions. However, the dataset also presents challenges, such as low-contrast tumors and tumors with irregular boundaries, making it ideal for testing the robustness of the proposed framework. The resulting model is further applied to real-world clinical data, establishing a specialized framework designed for CT imaging and providing a strong foundation for future advancements. Ultimately, this research aims to contribute to the development of more reliable and effective diagnostic tools, improving patient outcomes in liver cancer care.
2. Related Work
Different methods for liver tumor segmentation have been developed, from expert manual delineation to automated methods utilizing machine learning and deep learning. Conventional approaches commonly utilize intensity-based thresholding and region-growing methods, but they are constrained by their sensitivity to noise and variations in tumor characteristics. The U-net architecture introduced by Ronneberger et al. [23] has become a crucial element in biomedical image segmentation. It utilizes a design with skip connections that maintain spatial data, making it very successful for segmenting medical images. U-net is commonly used in different applications of image processing, such as liver tumor segmentation. Recently, the U-Net architecture, coupled with sophisticated image processing techniques such as colorization, has displayed encouraging outcomes in the realm of medical image examination analysis. Image colorization involves adding color to grayscale images, typically using deep learning models trained on large datasets of colored images. Colorizing grayscale medical images can improve the visibility of important features like tumors, leading to more accurate segmentation. This process converts grayscale images to pseudo-colored images to enhance the distinction between healthy tissue and pathological areas [24].
Several studies have explored the potential benefits of color information in enhancing object detection and segmentation tasks. For instance, An et al. (2020) tackled the challenges faced by traditional image colorization methods, which often struggle with producing natural and consistent colors, especially in complex image regions where color information is ambiguous or lacks context, by proposing a Convolutional Neural Network (CNN)-based approach that effectively colorized a variety of grayscale images and outperformed several traditional techniques in both qualitative and quantitative evaluations; however, the model had limitations, such as a tendency to produce incorrect colorizations in regions where the grayscale input lacked sufficient context or where the model's learned features did not generalize well to new images [25]. Fan et al. (2022) explore the problem of effectively colorizing grayscale images, particularly challenging due to the absence of color information in the input images, by proposing an unsupervised deep learning approach leveraging a CNN architecture, where the model learns to generate plausible colorizations by extracting feature representations from the input images to predict the most likely colors; their experimental results demonstrate improved color consistency and better preservation of image details in the generated colorized images, although the model struggles with images that have complex textures or regions with ambiguous color information [26]. Singh and Kaur (2023) address the issue of contrast enhancement methods failing to preserve brightness, causing artifacts and excessive brightness shifts. It proposes an optimized Multi-Histogram Equalization (OMHE) method using the Artificial Bee Colony (ABC) algorithm to determine optimal threshold levels; however, their approach focuses solely on enhancing contrast in already colored images, without addressing the challenge of generating realistic colors for grayscale medical images [27].
The integration of colorization and segmentation tasks is an emerging area of research. By enhancing the visual contrast through colorization, segmentation algorithms can potentially achieve better performance. Drioua et al. (2023) proposed an unsupervised autoencoder-based approach for segmenting overlapping nuclei in breast cancer histopathological images, which effectively clustered nuclei into tumor or non-tumor cells across various histopathology image sets with different color staining methods, though the computational complexity of the methods, particularly the U-Net model, presents a significant drawback due to its substantial processing power and memory requirements [28]. Zhang et al. (2022) addressed the challenge of medical image colorization by proposing a robust method using a Spatial Mask-Guided Generative Adversarial Network (GAN), which effectively improved colorization accuracy by integrating spatial masks to guide the GAN in distinguishing between different anatomical structures, though the complexity of the GAN model presents challenges in terms of computational efficiency. However, few studies have explored this combined approach for liver tumor segmentation in CT images. While existing studies have demonstrated the potential of integrating colorization techniques with deep learning architectures, including U-Net, for medical image analysis, their application in liver tumor segmentation from grayscale CT images remains largely underexplored. Furthermore, the challenges posed by noise, low-contrast regions, and complex tumor boundaries in CT images highlight the need for more robust and efficient methodologies. This research aims to address these gaps by leveraging grayscale-based colorization techniques in conjunction with the U-Net architecture, providing a novel approach to enhance segmentation accuracy and clinical applicability for liver tumor detection. By building upon the strengths and addressing the limitations identified in prior work, this study contributes to advancing the field of medical image segmentation, particularly for liver cancer care.
3. Research Method
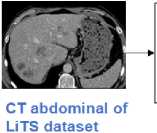
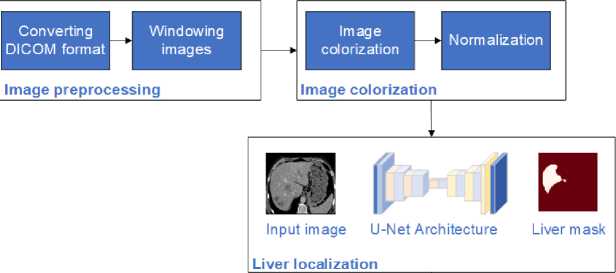
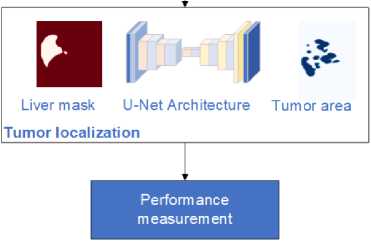
The research flow for this study presents a comprehensive workflow for liver tumor segmentation using a U-net-based image colorization approach. This method is applied to both the LiTS dataset and clinical data, as illustrated in Fig. 1. The process begins with preparing the LiTS dataset, which includes obtaining CT scans of the abdomen crucial for training and validating the U-net architecture. The next step is preprocessing, where the raw DICOM images are converted to JPEG format and windowed to enhance the grayscale range, making different tissues more visible. Following preprocessing, the images undergo colorization. This step involves converting grayscale images to either RGB or enhanced grayscale formats to improve contrast and feature representation. This visual enhancement is critical for the segmentation process. The prepared and colorized images are then fed into the U-net architecture, a specialized convolutional neural network for image segmentation. The U-net model processes the images to first segment and localize the liver and then identify and localize tumors within the liver. Finally, the proposed method is applied to clinical data to validate its effectiveness in real-world settings. This implementation demonstrates the method's practical applicability and accuracy in segmenting liver and tumor regions in clinical CT images. The combination of advanced preprocessing, colorization, and U-net segmentation ensures a robust approach to improving diagnostic accuracy in medical imaging.
Clinical validation
Fig. 1. Flow of the proposed colorization-based U-Net architecture
-
3.1 LiTS dataset
The LiTS dataset comprises 130 contrast-enhanced 3D abdominal CT scans sourced from six different clinical sites, applying various scanners and protocols, leading to a variety of spatial of spatial resolutions and fields of view (FOV) with voxel dimensions ranging from [0.60 - 0.98, 0.60 - 0.98, 0.45 - 5.0] mm. Expert radiologists carefully label liver and tumor regions in each scan, providing precise annotations. The CT images are stored in DICOM format with important metadata such as slice thickness, pixel spacing, and acquisition parameters, which are essential for maintaining the accuracy of the original scans. Each axial slice in the scan is consistently sized at 512 × 512 pixels, with the number of slices per scan varying greatly from 42 to 1026. The features of the LiTS dataset make it a strong standard for testing and assessing liver tumor segmentation algorithms, allowing for the development of models that can perform well in various clinical scenarios and imaging environments.
-
3.2 Clinical dataset
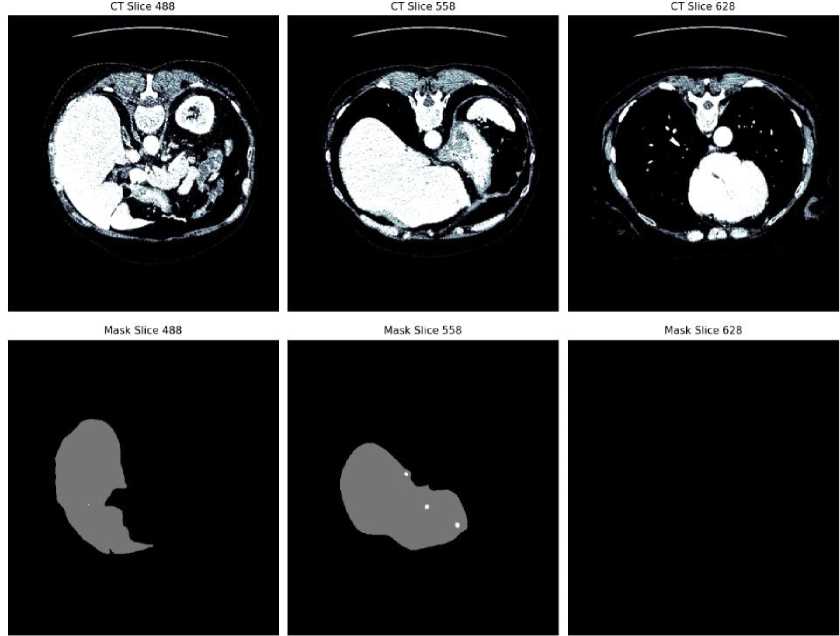
Fig. 2. CT slices and corresponding liver tumor segmentation masks from the LiTS dataset
The image provided in Fig. 2 is an example from the LiTS dataset, showcasing both CT slices and their corresponding mask results. The top row displays three different CT slices (slice 488, slice 558, and slice 628) of abdominal scans. These images highlight various cross-sectional views of the liver and surrounding anatomical structures. The bottom row presents the corresponding segmentation masks for the liver in each CT slice. These masks illustrate the delineated liver region, clearly separated from other tissues and structures. The masks are crucial for training and validating liver tumor segmentation algorithms, such as those using U-net architectures, to ensure accurate and efficient identification of liver boundaries in medical imaging.
The clinical dataset depicted in the provided image includes abdominal CT scans sourced from a hospital in Central Java Province, comprising scans obtained retrospectively patient. Each scan is captured in the DICOM format. The dataset is characterized by its diverse imaging conditions, reflective of real-world clinical scenarios, including variations in patient demographics and clinical backgrounds. Each axial slice measures 512 × 512 pixels, with varying numbers of slices per scan, providing comprehensive insights into different liver and tumor morphologies.
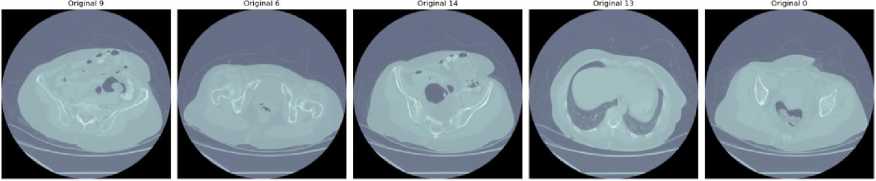
Fig. 3. Clinical dataset
A series of clinical CT scans in Fig. 3 depicting various liver conditions, highlighting the diversity and complexity typically encountered in clinical datasets. Each scan represents a distinct case, illustrating the variability in liver structures and the presence of different pathological features. For instance, Image slice 9 reveals clear delineation of liver structures with noticeable contrast differences, facilitating the identification of liver lesions or abnormalities. Image slice 6 presents a more complex anatomical structure with multiple regions of interest, potentially indicating varying tissue densities and the presence of tumors. In Image slice 14, substantial tissue irregularities suggest significant pathological changes or multiple tumors. Image slice 13 features a large central region with distinctive contrast, possibly signifying a notable liver lesion or tumor. Lastly, Image slice 0 displays multiple high-contrast areas within the liver, indicating potential multifocal lesions or significant variations in tissue density. These clinical images underscore the necessity for advanced segmentation models capable of accurately delineating both liver and tumor boundaries, given the variability in contrast and tissue structures that pose challenges for automated segmentation algorithms in medical imaging.
-
3.3 Data Preprocessing
-
3.4 Image colorization-based U-Net architecture Liver Tumor segmentation
The preprocessing steps are essential to prepare the raw DICOM (Digital Imaging and Communications in Medicine) images for analysis, ensuring that the data is compatible with the segmentation process and optimized for accurate feature extraction. These steps include converting DICOM to JPEG and windowing images, both of which play critical roles in improving the quality and usability of the data. The detail of the data preprocessing are as follows:
The CT images in DICOM format are first converted to JPEG format. The DICOM format is widely used in medical imaging, as it contains metadata and detailed information about the imaging conditions. However, this format is complex and not directly compatible with many image processing libraries and tools commonly used in deep learning frameworks. The conversion to JPEG simplifies data handling, reduces computational overhead, and ensures compatibility with deep learning architectures such as U-Net. In addition, JPEG is a lightweight, standardized format that facilitates easy visualization, storage, and manipulation of images without significant loss of critical anatomical details. While the conversion results in minor compression, the essential features required for liver tumor segmentation, such as grayscale intensity differences, are preserved. This step ensures that the data is prepared efficiently for processing while maintaining the quality needed for accurate segmentation.
Windowing is a critical step in preprocessing that adjusts the grayscale range of CT images to enhance the visibility of specific tissues, such as liver tissue and tumors. Raw CT images often contain a broad range of intensity values, which can make it difficult to differentiate between structures of interest. By applying window width (WW) and window level (WL) settings, the grayscale values are focused on a narrower range that highlights the desired tissues. For the LiTS dataset, windowing is performed using a window width of 150 and a window level of 3, which are optimal for visualizing liver tissues and tumors. These settings enhance the contrast between liver parenchyma and surrounding structures, making tumors more distinguishable from normal tissues. This step is particularly crucial for addressing challenges such as low-contrast lesions or overlapping intensities, as it ensures that the segmentation model has access to images with improved visual clarity. Without this adjustment, the model might struggle to accurately delineate tumor boundaries, leading to suboptimal performance.
This colorization process entails extracting pixel data, applying appropriate adjustments based on image metadata, and transforming the data into the desired color spaces. Grayscale images represent pixel intensity as a single value, while RGB images encode color information using red, green, and blue channels. This process leverages the additional information that color can provide, which is particularly useful for distinguishing between different tissue types and pathological structures. By introducing color information, the segmentation model gains access to additional features that might aid in differentiating tissues. Finally, image pixel values are normalized to a range of [0, 1] to ensure consistency across all scans. The colorized images serve as the input for the subsequent segmentation process.
The core of our segmentation approach is a U-Net architecture, a CNN designed for image segmentation. The illustration of the U-Net structure for segmenting liver tumors through image colorization can be seen in Fig. 4. The process begins by taking an input image through a series of convolutional layers, beginning with a single channel and increasing to 64 filters, followed by another layer with 64 filters, all while maintaining the original image size of 160x160 pixels. The image progresses through the reducing path, with two convolutional layers and LeakyReLU activation in each stage, then max-pooling to down-sample the image During each reduction in size, the number of filters increases by twofold (128, 256, 512, and 1024), while the area is divided by two (80x80, 40x40, 20x20, and 10x10). The U-net begins its expanding path with 1024 filters at the lowest level. This approach involves increasing the resolution of the feature maps by using up-convolutions to reduce the number of filters by half (from 1024 to 512, 256, 128, and 64) while doubling the spatial dimensions in each phase.
Skip connections are used to concatenate feature maps from the contracting path to the corresponding layers in the expanding path, providing localized information lost during down-sampling. The final layer restores the image to its original size (160x160 pixels) with three output channels representing the segmented liver, tumor, and background. This output layer applies a softmax activation function to classify each pixel. The detailed architecture demonstrates how the U-net model efficiently captures features at multiple scales and integrates them to produce accurate segmentation masks for liver tumors.
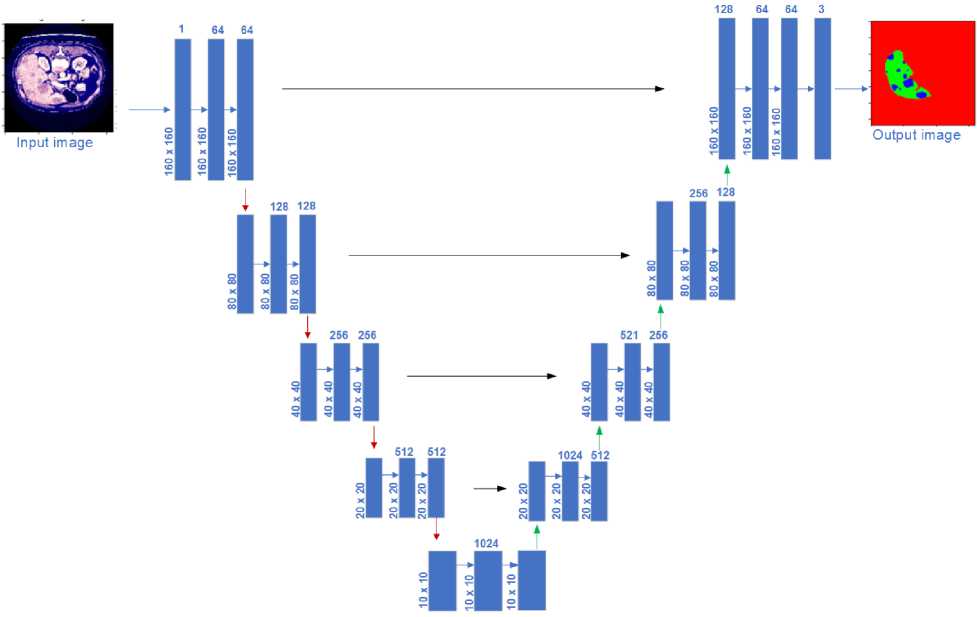
Fig. 4. Illustration of four-layer U-Net architecture for image colorization-based liver tumor segmentation
3.5 Experimental setting
3.6 Performance evaluation
4. Result and Discussion
4.1 Result of preprocessing LiTS dataset
Experiments were conducted using Keras framework with TensorFlow as the backend. To optimize the model’s performance, the Adam optimizer was employed with a learning rate of 0.001, в1 =0.9, and вг =0.999. These settings were selected for their well-documented ability to balance convergence speed and stability in deep learning tasks. The Adam optimizer combines the benefits of Adaptive Gradient Algorithm (AdaGrad) and Root Mean Square Propagation (RMSProp), which adapt the learning rate for each parameter, making it particularly effective for segmentation tasks with complex data such as CT images. The default settings of в1 =0.9 and вг =0.999 were retained as they have been shown to work well across a wide range of applications, including medical imaging, by maintaining a balance between momentum and adaptive learning rates. The learning rate of 0.001 was chosen after preliminary experiments indicated it provided an optimal trade-off between convergence speed and model performance. A higher learning rate led to instability in loss convergence, while a lower rate resulted in slow training. The selected learning rate ensured smooth convergence without overshooting the optimal minima, leading to robust performance in liver tumor segmentation.
The model was trained with a batch size of 16. This choice was influenced by a balance between memory constraints and ensuring stable gradient updates. Smaller batch sizes were observed to result in noisier gradient estimates, which hindered model performance, while larger batch sizes were not feasible due to memory limitations, even with the use of a DGX A100 NVIDIA Tensor Core GPU equipped with 40GB of memory. To prevent overfitting, early stopping was implemented with a patience of 5 epochs. Early stopping monitors the validation loss and halts training when no improvement is observed for five consecutive epochs. This approach ensures that the model does not overfit the training data and avoids unnecessary computations, contributing to a more generalizable model.
To evaluate the segmentation performance and validate the reliability of the proposed model, a comprehensive set of metrics and statistical analyses was employed. The Dice Similarity Coefficient (DSC) was used to measure the spatial overlap between the predicted and ground truth segmentations, providing a key metric for assessing segmentation accuracy. The Root Mean Square Error (RMSE) quantified the average pixel-wise intensity differences, reflecting the model’s ability to minimize reconstruction errors. The Peak Signal-to-Noise Ratio (PSNR) evaluated the quality of the segmentation by measuring image fidelity, with higher values indicating better preservation of structural details. Additionally, pixel accuracy calculated the proportion of correctly classified pixels across the entire image, offering a straightforward measure of overall classification performance.
To ensure the statistical significance of these results, further analysis was conducted using p-values and confidence intervals. Paired t-tests were performed to compare the performance metrics of the grayscale-based U-Net against benchmark models, such as the RGB-based U-Net and other existing approaches. The resulting p-values confirmed the statistical significance of the observed differences across all key metrics, with confidence intervals providing a robust range for the magnitude of improvements. These analyses reinforce the reliability of the model's performance and ensure that the reported improvements are not attributable to random variation.
The results of the preprocessing steps applied to the LiTS dataset are shown in Fig. 5. The process includes converting DICOM images to JPEG format, applying windowing of (150,3) to enhance visibility, and generating corresponding masks. In practice, using a window width of 150 HU and a window level of 3 HU adjust the CT image so that tissues within this range are shown with the most contrast.
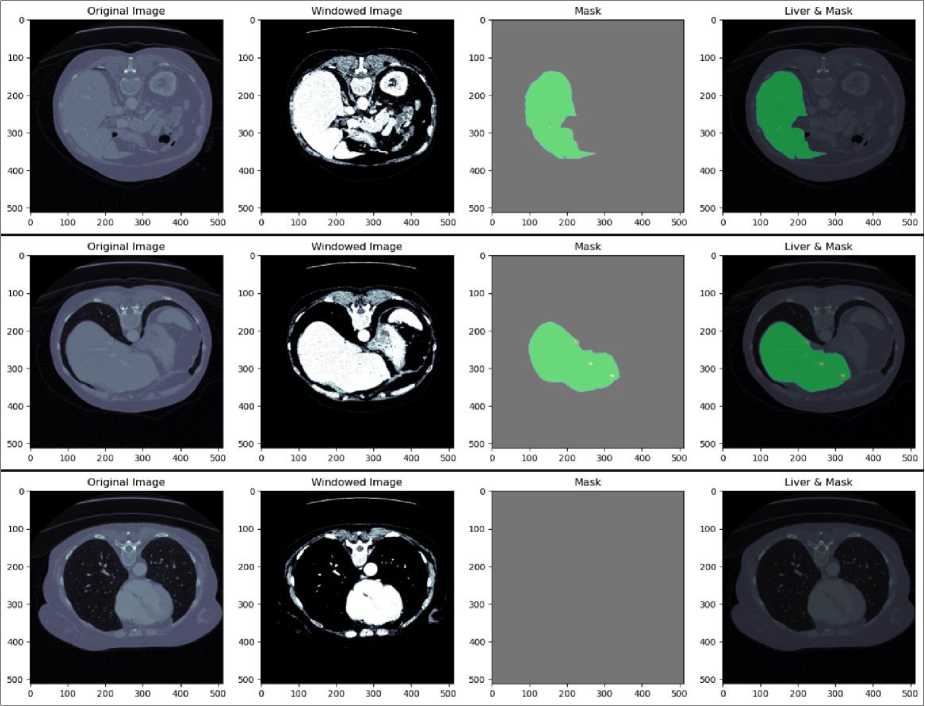
Fig. 5. Result of preprocessing LiTS dataset
The first column in each row of Fig. 5 displays the original CT images in DICOM format. These images are converted to JPEG format to standardize the input for further processing. The second column shows the windowed images. The third column presents the ground truth masks for the liver. These masks are binary images where the liver regions are marked in white, and the background is black. The masks are used as reference labels during the training of the U-Net model, guiding it to learn the correct segmentation boundaries. The fourth column displays the overlay of the liver regions on the original images, with the masks highlighted in green. This visualization demonstrates the accuracy of the mask in delineating the liver boundaries on the CT images. The overlay helps visually assess the effectiveness of the preprocessing and segmentation steps. The meticulous preprocessing ensures the model receives high-quality inputs, leading to accurate and reliable segmentation outcomes.
-
4.2 RGB-based U-Net image segmentation of the LiTS dataset
-
4.3 Grayscale-based U-Net image segmentation of the LiTS dataset
The outcomes of using an RGB-based U-Net architecture for liver and tumor segmentation on the LiTS dataset are shown in Fig.6. Section (A) presents the original RGB CT image, the true mask with manually annotated liver and tumor regions, the predicted mask generated by the U-Net model, and an overlaid visualization that combines the original image with the predicted mask to highlight the liver and tumor regions. Section (B) emphasizes on liver localization, showcasing the RGB image, the actual liver mask, the predicted liver mask, and an overlay image illustrating the model's accuracy in localizing the liver. In the same way, Section (C) discusses tumor localization by showing the initial image, actual tumor mask, predicted tumor mask, and an overlaid visualization highlighting the model’s accuracy in detecting the tumor in the liver.
The comparisons between the true and predicted masks across all sections indicate that the RGB-based U-Net model accurately captures the relevant anatomical structures. The alignment between the predicted and ground truth masks demonstrates the model's capability to segment liver and tumor regions effectively. Utilizing RGB images enhances contrast and feature representation, improving the model’s performance in distinguishing between different tissue types. Overall, the results show that the RGB-based U-Net model is proficient in segmenting liver and tumor regions in CT images from the LiTS dataset, as evidenced by the visual comparisons with ground truth annotations.
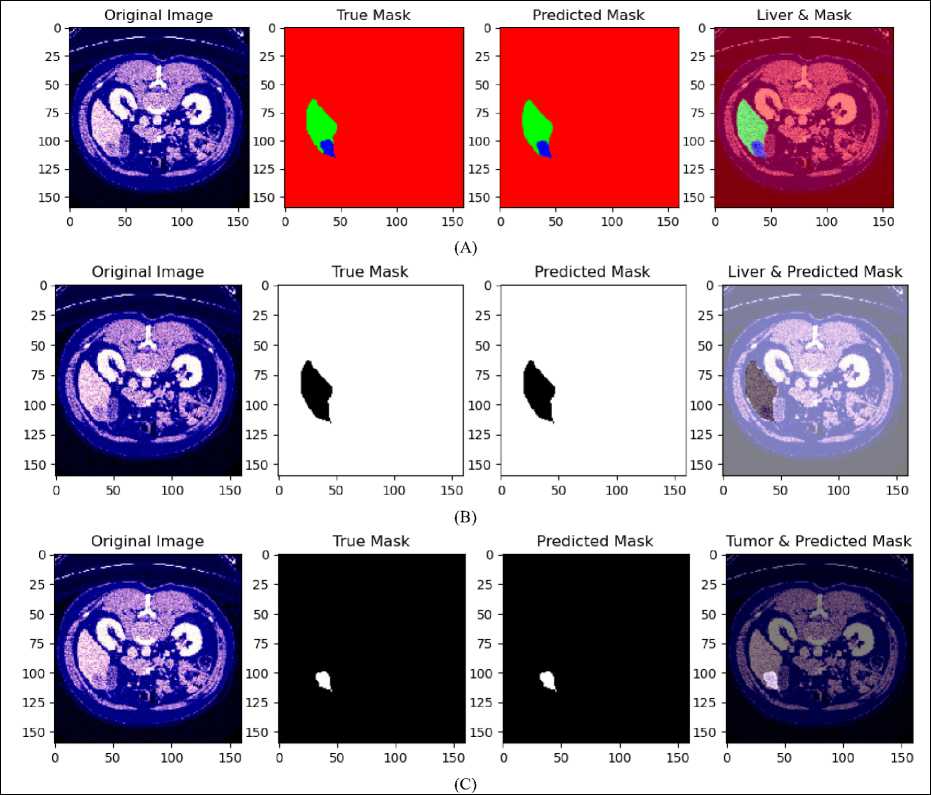
Fig. 6. (A) Result of liver and tumor segmentation on RGB-based U-Net for LiTS dataset, (B) predicted liver localization, (C) predicted tumor localization
The results of using a grayscale-based U-Net architecture for liver and tumor segmentation on the LiTS dataset are shown in Fig. 7. Section (A) presents the original grayscale CT image, the true mask with manually annotated liver and tumor regions, the predicted mask generated by the U-Net architecture, and an overlaid visualization combining the original image with the predicted mask. This section focuses the model's ability to accurately recognize and outline the liver and tumor areas.
Section (B) focuses on liver localization, showing the original image with preprocessing for improved visibility, the true mask for the liver, the predicted liver mask, and an overlaid image demonstrating the model's accuracy in localizing the liver. In the same way, Section (C) addresses tumor localization with corresponding images, showcasing the true tumor mask, the predicted tumor mask, and an overlaid visualization. The comparisons between the true and predicted masks across all sections indicate that the U-Net architecture captures relevant anatomical structures with reasonable accuracy. Despite the inherent limitations of grayscale imaging, such as low contrast and high noise levels, the model performs well, demonstrating its robustness in segmenting liver and tumor regions in CT images.
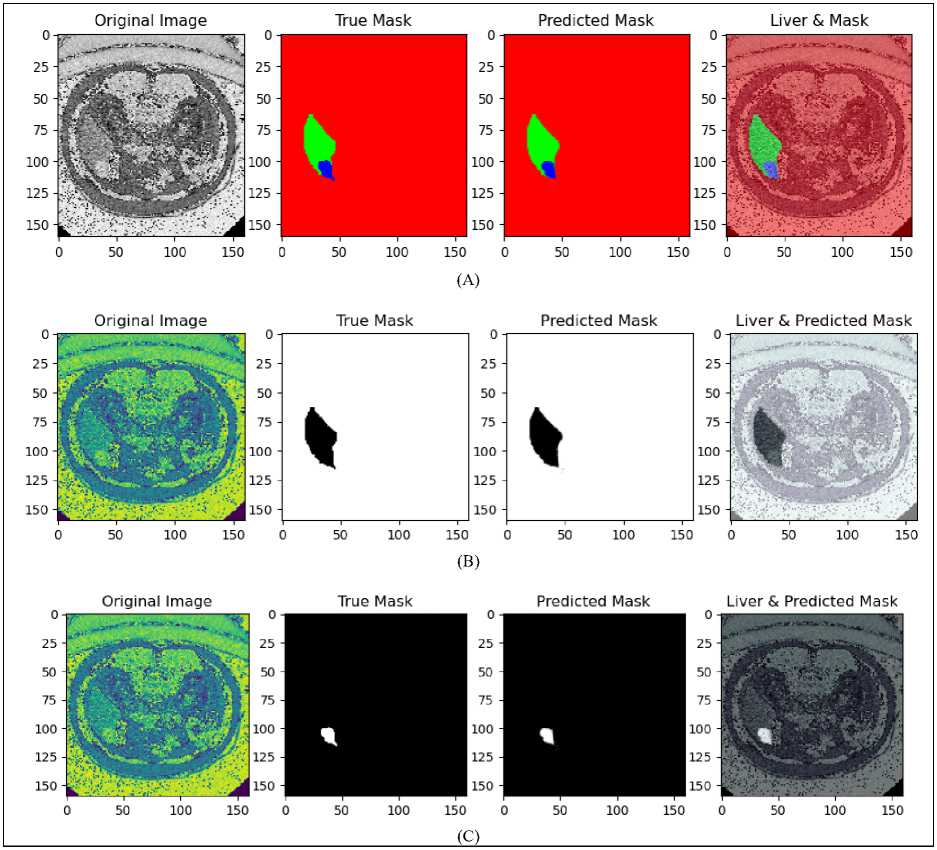
Fig. 7. (A) Result of liver and tumor segmentation on Grayscale-based U-Net for LiTS dataset, (B) predicted liver localization, (C) predicted tumor localization
Table 1. Performance comparison of RGB-based and Grayscale-based U-Net image segmentation
|
Dataset |
Image Colorization |
DICE Coefficient (%) |
RMSE |
PSNR |
Pixel accuracy |
||
|
Liver |
Tumor |
Overall |
|||||
|
LiTS |
RGB |
99.93 |
89.25 |
99.85 |
0.026 |
79.51 |
0.292 |
|
LiTS |
Grayscale |
99.95 |
90.44 |
99.89 |
0.019 |
82.14 |
0.316 |
Table 1 shows comparison performance of RGB and grayscale-based model of the U-Net architecture for liver and tumor segmentation on the LiTS dataset. The evaluation focuses on key metrics, including the DICE Coefficient for liver, tumor, and overall segmentation, RMSE, PSNR, and pixel accuracy. The results indicate that employing grayscale-based model yields better results than using RGB-based model, leading to enhanced segmentation accuracy and image quality in various metrics. The grayscale-based model shows a slightly higher DICE Coefficient, achieving 99.95% for liver segmentation and 90.44% for tumor segmentation, compared to the RGB-based model, which attained a DICE Coefficient of 99.93% for liver and 89.25% for tumor segmentation. Overall, the grayscale-based model demonstrates a DICE Coefficient of 99.89%, marginally outperforming the RGB-based model, which shows a performance of 99.85%.
In the grayscale-based model, there is a decrease in RMSE to 0.019, as opposed to 0.026 in the RGB-based model, showing improved segmentation accuracy. Furthermore, the grayscale-based model has a higher PSNR of 82.14, indicating better image quality, compared to 79.51 in the RGB-based model, showing that the grayscale-based model provides superior segmentation quality. The grayscale-based method shows an enhanced pixel accuracy of 0.31, surpassing the 0.29 of the RGB-based models, demonstrating superior precision in outlining liver and tumor areas. In general, these findings show that the U-Net model based on grayscale offers small but noteworthy enhancements in segmenting liver and tumor regions in LiTS dataset CT images, proving it to be a better strategy for medical imaging.
-
4.4 Statistical Analysis
In addition to the reported performance metrics, including DICE, RMSE, PSNR, and pixel accuracy, a statistical analysis was conducted to assess the significance of the observed improvements in segmentation accuracy achieved by the proposed grayscale-based U-Net compared to the RGB-based U-Net. Paired t-tests were performed to compute p-values, ensuring that the observed differences in performance metrics were statistically significant and not attributable to random variation. The results of this statistical analysis, which further validate the robustness and reliability of the proposed approach, are presented in Table 2.
DICE Coefficient : The grayscale-based U-Net achieved a DICE coefficient of 99.95% for liver segmentation and 90.44% for tumor segmentation. Compared to the RGB-based model (99.93% liver, 89.25% tumor), the improvement was statistically significant with p-values of < 0.01 for both liver and tumor segmentation. The 95% confidence interval for the improvement in tumor DICE ranged from 0.85% to 1.25%.
RMSE : The RMSE was reduced to 0.019 in the grayscale-based U-Net from 0.026 in the RGB-based U-Net. The difference was statistically significant, with a p-value of < 0.01, and the 95% confidence interval for the reduction in RMSE ranged from 0.005 to 0.009.
PSNR: The grayscale-based U-Net improved PSNR to 82.14, compared to 79.51 for the RGB-based model. The p-value for this improvement was 0.002, and the 95% confidence interval for the increase was 2.00 to 3.50.
Pixel Accuracy : Pixel accuracy improved to 0.316 from 0.292 in the RGB-based U-Net. This improvement was statistically significant, with a p-value of < 0.01, and the 95% confidence interval for the improvement ranged from 0.018 to 0.028.
Table 2. Statistical Analysis of Segmentation Metrics
|
Metric |
p-value |
Confidence Interval |
|
DICE Coefficient (Liver) |
< 0.01 |
N/A |
|
DICE Coefficient (Tumor) |
< 0.01 |
0.85% - 1.25% |
|
RMSE |
< 0.01 |
0.005 - 0.009 |
|
PSNR |
0.002 |
2.00 - 3.50 |
|
Pixel Accuracy |
< 0.01 |
0.018 - 0.028 |
These findings confirm that the proposed grayscale-based U-Net significantly outperforms its RGB-based counterpart and prior methods across all key metrics. The low p-values indicate that the observed differences are highly unlikely to have occurred by chance, and the confidence intervals provide a robust range for the magnitude of improvements. This rigorous statistical validation underscores the reliability of the proposed method and its potential for clinical deployment.
-
4.5 Comparative Analysis of Proposed Method with Previous Liver and Tumor Segmentation Approaches
-
4.6 Clinical Validation
-
4.6.1 Preprocessing result of clinical data
A boxplot representing the distribution of values in a clinical data array of liver tumor CT image shown on Fig. 8 (A). The data has a minimum value of -2000 and a maximum value of 2428 indicating a wide range in the data. The boxplot visualizes the spread and skewness of the data, with the central box representing the interquartile range (IQR), which contains the middle 50% of the data. The line within the box marks the median, or the 50th percentile, of the data. There appears to be an outlier to the far left of the plot, with a value at the minimum (-2000). This suggests that there may be some extreme values in the dataset that are far from the majority of the data points. The length of the box shows the IQR, which is the range between the 25th and 75th percentiles. The "whiskers" extend from the box to the smallest and largest values within 1.5 times the IQR from the lower and upper quartiles, respectively. Values beyond the whiskers are considered potential outliers.
-
We conducted a comprehensive comparison of various liver tumor segmentation methods using the LiTS dataset, with results summarized in Table 3. The methods compared include multiple layer U-Net by Tran et al., fully convolutional neural network (FCN) by Alirr, modified residual U-Net and modified U-Net by Manjunath and Kwadiki, EU-Net by Liu et al., and our proposed grayscale-based U-Net model. The comparison highlights the strengths and limitations of each approach in terms of liver and tumor segmentation performance.
Table 3. Comparative evaluation of U-Net architecture for liver tumor segmentation approaches
|
Study |
Method |
Dice’s Similarity Coefficient (%) |
|
|
Liver segmentation |
Tumor segmentation |
||
|
Tran et al. [7] |
Multiple layer U-Net |
96.38 |
73.69 |
|
Alirr [8] |
Fully convolutional neural network |
95.6 |
70 |
|
Manjunath and Kwadiki [14] |
Modified residual U-Net |
96.35 |
89.28 |
|
Manjunath and Kwadiki [9] |
Modified U-Net |
91.94 |
69.80 |
|
Liu et al [10] |
EU-Net |
94.19 |
84.32 |
|
Ours |
Grayscale-based U-Net |
99,95 |
90,44 |
Tran et al.'s multiple layer U-Net achieved a Dice score of 96.38% for liver segmentation and 73.69% for tumor segmentation, indicating reasonable performance but challenges in delineating tumor boundaries. Alirr's FCN network demonstrated a Dice score of 95.6% for liver segmentation and 70% for tumor segmentation, reflecting similar struggles in segmenting tumors accurately. Manjunath and Kwadiki's modified residual U-Net significantly improved tumor segmentation, achieving Dice scores of 96.35% for liver segmentation and 89.28% for tumor segmentation. However, their modified U-Net underperformed compared to other methods, with Dice scores of 91.94% for liver segmentation and 69.80% for tumor segmentation. Liu et al.'s EU-Net delivered a balanced performance, reporting Dice scores of 94.19% for liver segmentation and 84.32% for tumor segmentation, addressing some challenges but leaving room for improvement in complex tumor cases.
Our proposed grayscale-based U-Net model demonstrated superior performance with Dice scores of 99.95% for liver segmentation and 90.44% for tumor segmentation, setting a new benchmark for segmentation accuracy. The superior performance of the proposed grayscale-based U-Net can be attributed to its ability to address critical challenges in liver tumor segmentation with precision and efficiency. Handling Low-Contrast Tumors : Low-contrast tumors, such as hypodense lesions, present significant challenges for segmentation due to their subtle intensity differences relative to surrounding healthy tissues. The grayscale-based colorization process directly addresses this issue by enhancing the contrast within the grayscale intensity spectrum. Unlike RGB-based methods, which rely on pseudo-color transformations that may introduce visual artifacts or distortions, the grayscale-based approach selectively amplifies intensity variations critical for segmentation. This allows the model to accurately identify tumor regions even in challenging imaging conditions where traditional segmentation methods often fail. Delineating Irregular Tumor Shapes: Liver tumors frequently exhibit irregular and complex boundaries, making them difficult to segment using conventional models. The U-Net architecture, with its encoder-decoder structure and skip connections, provides a strong foundation for capturing both local and global features. When combined with enhanced feature representation achieved through grayscale-based colorization, the model is able to effectively delineate tumors with complex shapes and varying textures. This integration ensures that the model can adapt to diverse tumor morphologies, improving segmentation accuracy across a wide range of clinical cases. Improving Efficiency: One of the key advantages of the grayscale-based approach is its computational efficiency. RGB-based methods add computational overhead by introducing additional color channels, increasing memory and processing requirements. In contrast, the grayscale-based U-Net retains a singlechannel format while enhancing contrast, which reduces the overall complexity of the model. This not only accelerates training and inference times but also ensures the model remains practical for deployment in large-scale clinical applications. Importantly, the approach achieves this efficiency without compromising segmentation accuracy, making it an optimal choice for scenarios where both precision and speed are essential.
Although the proposed grayscale-based U-Net model demonstrates significant improvements in liver tumor segmentation, it is not without limitations, particularly in challenging scenarios that involve extreme noise or heterogeneous tumor textures. Extremely Noisy Data: CT images with excessive noise can obscure critical anatomical details, making it difficult for the model to accurately differentiate between tumor regions and surrounding tissues. Noise often arises from low-dose imaging protocols or patient motion during image acquisition, which introduces random variations in pixel intensities. These artifacts can degrade the quality of feature representation, leading to reduced segmentation accuracy. While the proposed grayscale-based U-Net enhances contrast and feature representation, its reliance on the underlying pixel intensity values means that extreme noise can still impair its performance. Incorporating advanced denoising techniques, such as pre-processing filters or integrating noise-robust loss functions, could mitigate this limitation and further improve the model's robustness. Heterogeneous Tumor Textures : Tumors with highly variable textures and intensities pose another challenge for segmentation. Heterogeneous tumors often exhibit regions of necrosis, calcification, or fibrosis, which create significant intra-tumoral variability. This variability can confuse the model, leading to partial segmentation or missed regions within the tumor. Although the U-Net's encoder-decoder structure, combined with grayscale-based colorization, enhances the model’s ability to capture fine-grained details and complex boundaries, it may still struggle to generalize effectively across such diverse patterns. Future enhancements could involve incorporating multi-scale feature extraction or attention mechanisms to focus on distinct tumor regions, allowing for more precise segmentation of heterogeneous tumors.
While Fig. 8(B) illustrates the distribution of pixel intensity values within the LiTS dataset, specifically highlighting the range from a minimum value of -3024 to a maximum of 1509. The central box, representing the interquartile range (IQR), encapsulates the middle 50% of the data, indicating that most pixel values are clustered around lower intensities. This is characteristic of medical imaging, where the majority of the image can include low-intensity background regions. The right whisker extends towards higher intensity values, suggesting a broader range of higher intensities in the dataset, while the presence of an outlier on the lower end indicates some extreme low-value pixels. The LiTS dataset shows significant outliers at the lower end, indicating a wider variability in pixel intensity values compared to the clinical data. This variability in the LiTS dataset can affect the performance of image processing and segmentation algorithms differently than the clinical data, potentially requiring more robust methods to handle the broader range of intensities.
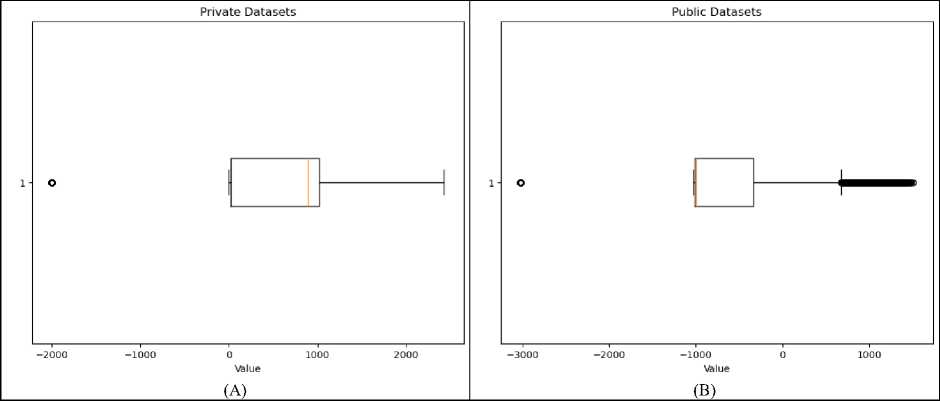
Fig. 8. Boxplot representing the distribution of values in (A) clinical data and (B) LiTS data array
The results of applying windowing process to clinical CT images shown in Fig. 9. Each column of Fig. 9 illustrates different slices of the abdomen before and after windowing. Initially, the clinical data is stored in DICOM format. For further processing and visualization, these DICOM images are converted to JPEG format. Following this conversion, windowing is performed to enhance the visibility of specific tissues and structures within the images.
Windowing with a level of 250 and a width of 1000 adjusts the contrast by setting the grayscale midpoint to 250 Hounsfield Units (HU) and allowing a display range that spans 1000 HU. This specific configuration is chosen to optimize the contrast in the images, particularly highlighting high-density structures such as bones and tumors. The original images, as shown in the upper row, present the unprocessed scans where the various tissues and anomalies are not as distinct due to the raw grayscale intensity range. In contrast, the lower row displays the windowed images where the contrast is significantly enhanced, making it easier to differentiate between different tissues, including the liver and potential tumor regions.
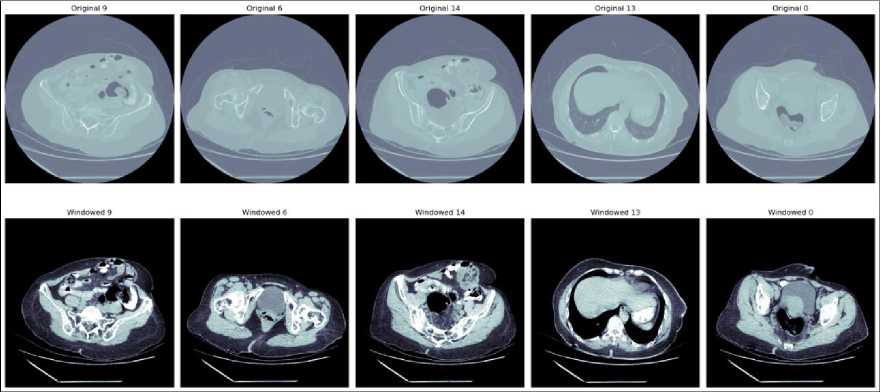
Fig. 9. Windowing of clinical data
4.6.2 RGB-based U-Net image segmentation for clinical data
0 50 100 150 0 50 100 150 0 50 100 150
1/1 [——————————— 1 - 0S 37ms/step
0 50 100 150 0 50 100 150 0 50 100 150
Fig. 10. Result of RGB-based U-Net in clinical data
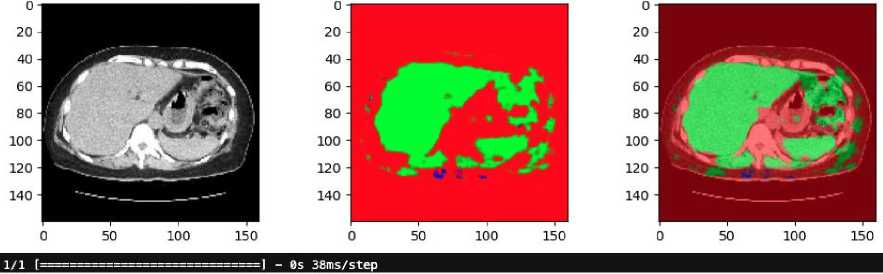
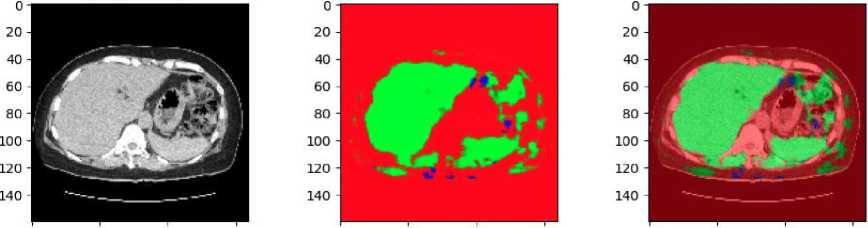
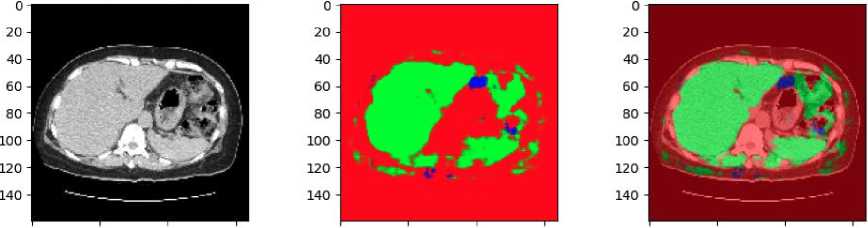
The results of applying an RGB-based U-Net model to clinical CT shown in Fig.10. The clinical data has not been pre-annotated with liver and tumor localization. The original CT scan in grayscale, converted to an RGB format. The middle image shows the predicted segmentation mask generated by the U-Net model. In this mask, the green regions represent the areas identified as liver tissue by the model. The presence of red and other colors indicates areas that the model has not classified as liver, suggesting that some parts of the image are either non-liver tissues or regions of uncertainty. The final image on the right overlays the predicted liver mask onto the original CT scan. The green overlay highlights the liver region as predicted by the U-Net model, while the surrounding red areas show the non-liver tissues.
The absence of pre-annotations in this clinical data underscores the model's importance in identifying the liver and distinguishing it from surrounding tissues. The results suggest that while the model is effective in identifying the liver, there may be areas where further refinement is needed, particularly in differentiating between the liver and other anatomical structures or potential tumors.
-
4.6.3 Grayscale-based U-Net image segmentation for Clinical data
-
4.6.4 Implications for Patient Outcomes and Diagnostic Efficiency
The results of applying a grayscale-based U-Net model to a clinical CT scan for liver and tumor segmentation shown in Fig. 11. Similar to the previous example, the clinical data used here has not been annotated with specific liver and tumor localization, making the model's predictions essential for identifying these regions.
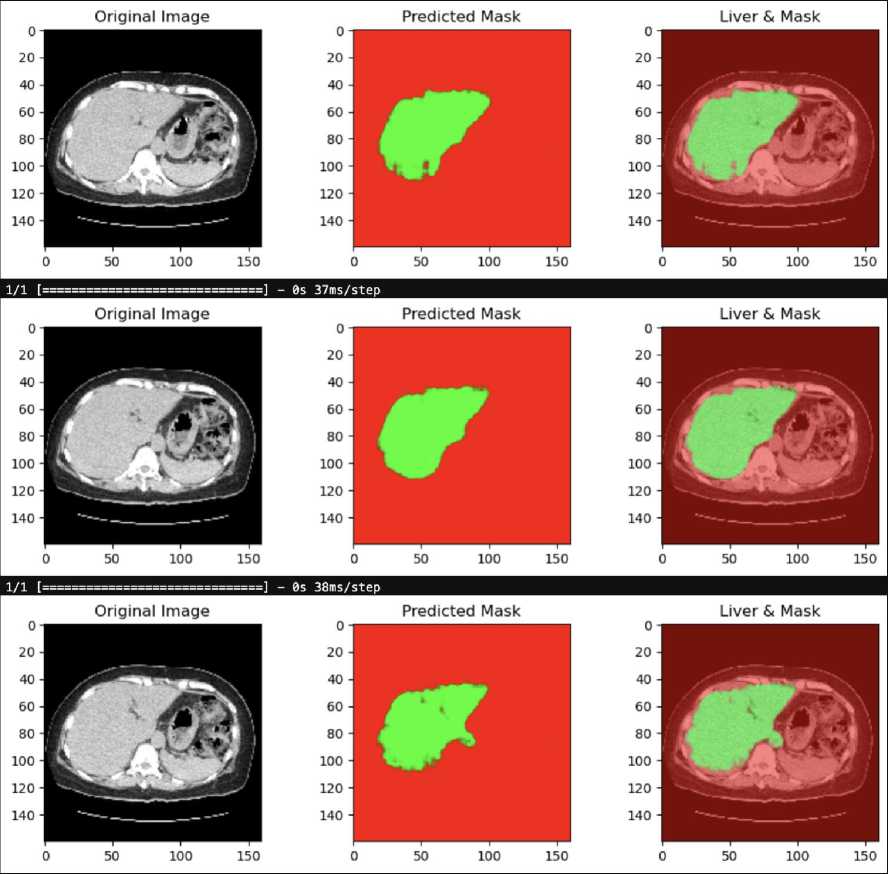
Fig. 11. Result of Grayscale-based U-Net in clinical data
The first image on the left is the original CT scan in grayscale. This image is the input to the U-Net model, which processes it to predict the location of the liver and any potential tumors. The middle image displays the predicted segmentation mask generated by the grayscale-based U-Net model. The green area represents the region identified as liver tissue by the model, while the red background indicates areas that the model did not classify as liver. The clarity and focus of this mask suggest that the model has successfully isolated the liver region from the rest of the anatomical structures. The final image on the right overlays the predicted liver mask onto the original grayscale CT scan. The green region corresponds to the liver as predicted by the U-Net model, while the underlying grayscale CT image is visible in the background. This overlay helps to visualize how accurately the model has segmented the liver in relation to the original scan.
This result demonstrates the effectiveness of the grayscale-based U-Net model in segmenting the liver from clinical CT scans, even in the absence of annotated localization data. The clear and well-defined liver region in the predicted mask highlights the model's potential for clinical applications where accurate liver segmentation is crucial.
The grayscale-based U-Net architecture has demonstrated significant improvements in segmentation accuracy, offering the potential to enhance the precision of liver tumor detection in real-world clinical settings. Precise tumor delineation is crucial for effective treatment planning, as it directly impacts the accuracy of surgical interventions, radiation therapy, and overall patient outcomes. The model’s strong performance across multiple metrics indicates its readiness for integration into existing clinical workflows with minimal adjustments. Its compatibility with common clinical data formats, such as DICOM images, ensures seamless deployment in hospitals and clinics without necessitating extensive retraining of staff or substantial modifications to current systems.
In addressing real-world challenges, the model’s robustness to variations in imaging conditions, such as low contrast, irregular tumor shapes, and standard clinical noise levels, enhances its applicability. However, noisy or low-resolution scans, which are common in low-resource or emergency settings, remain a potential limitation. While the model’s grayscale-based colorization enhances contrast and feature representation, future adaptations could incorporate preprocessing steps, such as advanced denoising filters or super-resolution techniques, to mitigate the impact of these conditions. This would ensure that anatomical structures are preserved even under suboptimal imaging conditions, thereby maintaining segmentation accuracy.
By automating the segmentation process, the grayscale-based U-Net significantly reduces the time required for manual delineation of tumors, freeing up radiologists and oncologists to focus on more critical diagnostic and treatment tasks. This efficiency accelerates decision-making, enabling prompt initiation of treatment—a critical factor for aggressive cancers like liver cancer. Furthermore, the reduction in manual intervention lowers the likelihood of human error, enhancing diagnostic consistency and reliability.
The cost-effectiveness of the automated segmentation approach is another key implication for healthcare systems. By streamlining workflows and reducing manual workload, the model can lower operational costs, making advanced diagnostic capabilities more accessible to a broader patient population. Additionally, the ability to handle standard clinical imaging formats ensures its scalability and adaptability for deployment across diverse hospital infrastructures, from high-end urban medical centers to resource-limited rural clinics.
4.6.5 Limitations of the study
5. Conclusion and Future Research Directions
While this study presents significant advancements in liver and tumor segmentation using the U-Net architecture with both RGB-based and grayscale-based colorization techniques, several limitations remain that require further attention. Generalizability to New, Unseen Data: A key limitation of the study is its reliance on the LiTS dataset, a widely used benchmark dataset. While the dataset provides high-quality annotations and standardized evaluation metrics, it does not fully encompass the diversity encountered in real-world clinical settings. Specifically, the LiTS dataset lacks representation of imaging variations such as different CT scanner models, acquisition protocols, and contrast enhancement techniques. Additionally, it does not capture a wide range of patient demographics, disease stages, or rare tumor subtypes. These factors limit the model's ability to generalize effectively to new, unseen data. Preliminary results show that the model performs well on the LiTS dataset with high Dice coefficients (99.95% for liver segmentation and 90.44% for tumor segmentation); however, performance may degrade when applied to external datasets or clinical cases with more variability. This is particularly critical for low-contrast tumors or scans with artifacts, where the model may misidentify tumor boundaries or fail to distinguish between tumor and healthy tissue. To assess generalizability, the model should be tested on independent datasets, such as those acquired from different institutions or imaging modalities. Cross-validation across multiple datasets could also provide a more robust evaluation of its performance in varied clinical contexts.
Error Analysis: Another limitation lies in the model's potential for false positives and false negatives. False positives, where non-tumorous regions are incorrectly classified as tumors, can lead to unnecessary clinical interventions, while false negatives, where true tumor regions are missed, could result in delayed or inadequate treatment. Although the grayscale-based U-Net improves segmentation accuracy compared to previous methods, false positive rates may increase in regions with overlapping intensities between tumors and surrounding vasculature or fibrotic tissues. Similarly, false negatives are more likely to occur with hypodense or heterogeneous tumors, where subtle intensity differences may not be captured sufficiently by the model’s feature representation.
Computational Constraints : The computational complexity of the RGB-based U-Net, which involves processing three-channel inputs, demands significant memory and processing power, making it less feasible for deployment in realtime clinical environments. Although the grayscale-based approach reduces this computational overhead, the overall architecture still requires optimization for edge computing or deployment on devices with limited resources.
This study demonstrated the effectiveness of the proposed grayscale-based U-Net model for liver and tumor segmentation in clinical CT images. Comparative analysis with an RGB-based U-Net model revealed that the grayscale approach outperformed its counterpart across multiple key metrics. The grayscale-based U-Net achieved a DICE coefficient of 99.95% for liver segmentation and 90.44% for tumor segmentation, surpassing the RGB-based model. Additionally, it recorded superior performance with an RMSE of 0.019, a PSNR of 82.14, and a pixel accuracy of 0.316. Both models demonstrated high effectiveness in liver segmentation, underscoring the robustness of U-Net architectures in capturing complex anatomical structures. However, the grayscale-based model's enhanced performance in tumor segmentation highlights its potential for clinical applications, where precise and efficient segmentation is critical for diagnosis and treatment planning. These results establish the grayscale-based U-Net as a reliable and scalable solution for improving segmentation accuracy in liver tumor diagnosis, offering a promising pathway for further advancements in medical imaging.
Future work on the proposed grayscale-based U-Net model could focus on several key directions to enhance its applicability, accuracy, and clinical impact. Expanding the evaluation to larger and more diverse datasets, including annotated tumor localization datasets from different patient populations and imaging protocols, would improve the model’s generalizability and robustness. Advanced techniques, such as incorporating attention mechanisms or multiscale feature extraction, could further refine the model’s segmentation performance. For instance, attention modules, such as spatial or channel-wise attention, could enable the model to focus on critical regions like tumor boundaries, while multi-scale processing could improve its ability to capture both global context and fine-grained details, addressing challenges associated with heterogeneous tumors. Exploring hybrid models that integrate grayscale and RGB features could also enhance segmentation accuracy in cases involving complex or subtle anatomical features. Additionally, adapting the model for real-time clinical applications by optimizing it for lightweight architectures or edge computing devices, such as GPUs in clinical workstations, would enable immediate diagnostic support for radiologists. Validation of the model across different imaging modalities, such as MRI or PET, would further extend its utility, as these modalities often provide complementary information for tumor characterization. Broadening its application to other organs or diseases, including lung nodules, cardiac imaging, or brain tumor segmentation, could significantly expand its impact in medical imaging. Finally, incorporating explainability techniques, such as Grad-CAM or SHAP, could improve the interpretability of the model’s outputs, fostering greater trust and adoption in clinical practice. By addressing these directions, the proposed method could pave the way for more personalized, efficient, and accurate medical care across diverse clinical scenarios.
Acknowledgment
We thank the Office of Research and Community Service (LPPM) Universitas Dian Nuswantoro (UDINUS) for all the support that made this study possible, under contract number 076/A.38-04/UDN-09/VII/2024.
