Combined approach to UV-Vis study of 2-allyl and 2-ethylthioquinolines in various solutions

Author: Matveychuk Yu.V., Ilkaeva M.V., Vershinina E.A., Batalov V.I., Bartashevich E.V.
Journal: Вестник Южно-Уральского государственного университета. Серия: Химия @vestnik-susu-chemistry
Section: Физическая химия
Article in issue: 1 т.8, 2016.
Free access
Combined approach to analysis of 2-allylthioquinoline and 2-ethylthioquinoline solutions has been performed on the basis of UV-Vis spectroscopy. Experimental and calculated electronic absorption spectra of these compounds in various solvents: acetone, benzene, carbon tetrachloride, dichloromethane, ethanol have been considered. The negative solvatochromic effect has been observed. The results of our calculations have revealed that the spectra of various conformers of 2-allylthioquinoline differ more essentially than the spectra of 2-ethylthioquinoline conformers. It has been shown that the location of λ max band doesn’t drastically depend on allyl or alkyl substitution at the sulfur atom.
Electronic absorption spectra, substituted 2-thioquinolines, solvatochromic effect, td dft calculation, td dft расчёты
Short address: https://sciup.org/147160342
IDR: 147160342 | UDC: 544.18, | DOI: 10.14529/chem160105
Комбинированный подход к исследованию УФ-Вид спектров 2-аллил и 2-этилтиохинолинов в различных растворителях
Комбинированный подход к анализу растворов 2-аллилтиохинолина и 2-этилтиохинолина выполнен на основе УФ-Вид спектроскопии. Рассмотрены экспериментальные и расчётные электронные спектры поглощения этих соединений в различных растворителях: ацетоне, бензоле, четырёххлористом углероде, дихлорметане, этаноле. Наблюдался отрицательный сольватохромный эффект. Результаты наших расчётов показали, что спектры разных конформеров 2-аллилтиохинолина отличаются более существенно, чем спектры конформеров 2-этилтиохинолина. Показано, что положение полосы поглощения λ max значимо не зависит от типа (аллильного или алкильного) заместителя при атоме серы.
Text of the scientific article Combined approach to UV-Vis study of 2-allyl and 2-ethylthioquinolines in various solutions
The studies of theoretical electronic spectra of organic heterocycles with the use of TD-DFT method [1, 2] are widely used at present. For example, in [3] the spectra of azoalkanes were observed, attempts to improve initial conditions of calculations and to explain differences in theoretical and experimental data were made. In work [4] along with comprehensive experimental research of benzodithiazol derivatives the calculations of electron density were performed, as well as of spectra and reaction activity of the synthesized substances, which proved to be consistent with the measured data. In [5] with the help of calculations the changing of fluorescence ability of phosphonate derivatives of 8-oxyquinoline and their complexes with zinc was explained. It should be noted that functional B3LYP [6, 7] and all-electron basis sets of 6-311G family [8, 9] are most frequently used at present for characterization of organic molecules.
As a rule, in order to account for medium (solvent) influence on features of electronic spectra of the investigated compounds, refining models are used; in them the different types of interactions of a solvate and a solvent are considered [10]. The precise numerical continual polarization model (PCM) [11, 12] has been developed in the past decade. The widespread usage of PCM model is related to speed of electron state calculation in an environment of solvent molecules, which is somewhat slower in comparison with gas phase calculations. In such a case theoretical results and tendencies in the change of compound spectra, obtained with use of a given model, most adequately correlate with experimental spectra of these compounds in solutions and explain their features, the fact that was noted by many researchers [3]. In particular, the results of experimental investigation of 2-amino-5-bromobenzoic acid were in good approximation to calculations of the Raman activities and UV spectra in solutions [13], and the authors explained some features with due regard for conformers’ existence and differences of their energy characteristics.
It is obviously important to study the spectral characteristics of S-substituted thioquinolines as the initial compounds for halocyclization reaction leading to biologically active compounds. The prime aim of the work is the research of the characteristic features of alkenyl- and alkyl-substituted 2-thioquinoline with the use of UV-Vis spectra, both experimental and calculated. For this purpose, the following objective points have been achieved:
-
– The analysis of the experimental UV-Vis spectra of 2-allylthioquinoline and 2-ethylthioquinoline solutions in various solvents has been carried out.
-
– The modeling of 2-allylthioquinoline and 2-ethylthioquinoline conformers has been carried out.
-
– The comparison of calculated wavelengths corresponding to the basic electronic transitions and experimental UV-Vis characteristics has been made under solvent change conditions.
Experimental
2-Allylthioquinoline and 2-ethylthioquinoline compounds were synthesized according to [14, 15] in order to investigate their spectral properties. Dichloromethane, carbon tetrachloride, benzene, acetone, ethanol (analytical grade) were used as solvents. Concentration of solution of the compounds was 10–4 M. UV-Vis spectra of the prepared solutions were registered by means of the Shimadzu UV-2700 spectrophotometer in the range of 220-850 nm at the recording speed of 450 nm/min.
Calculations
It is mentioned above that the functional B3LYP [6, 7] in a combination with basis sets of 6-311G family [8, 9] is most frequently used at present. However, comparative calculations of electronic spectra were also carried out [16, 17] with the use of functional PBE0 [18] and similar basis sets. Thus, the calculated lines, obtained at level B3LYP, reproduce the experimental absorption bands of phenothiazine in the best way, and the lines, obtained at level PBE0, reproduce the absorption bands of halogensubstituted azo-compounds. Also, we have previously noted [19] that the electronic spectra, calculated with the use of functional B3LYP, better correspond to experimental spectra of 2- and 8-thioquinoline, in comparison with the spectra, calculated on level PBE0. So we have carried out the optimization of structure geometry of 2-allylthioquinoline and 2-ethylthioquinoline at level B3LYP/6-311G(d,p). These compounds were considered as several conformation isomers. Optimization of structure was performed in necessary number of steps up to the stationary point with the greatest magnitude of the energy gradient, not more than 1Е-5 (in Hartree/Bohr units). In such case there were no imaginary frequencies in the Hessian obtained for all structures.
We took account of the solvent influence with the use of model D-PCM (dielectric PCM) [11, 12] in its basic variant with the following parameters: the same coefficient for all tesserae of a cavity, without calculation of energies of cavitation, repulsion and dispersion, at standard temperature 298 К. Van der Waals radii of atoms were taken in [20].
Energies of excited states and the corresponding electronic spectra of the optimized structures were obtained by method TD-DFT [1, 2] at the same level, also with allowance made for solvent influence. We carried out such calculation for 10–30 excited states with the necessary number of iterations and the convergence criteria in energy for each state (not more than 3Е-5 in Hartree/Bohr units), so that the spectrum range had the lower boundary of 250 nm.
All the calculations of the optimized structures and their energy characteristics were made with software package Firefly v.8 [21]. Graphical representation of molecular structures was obtained with the use of software package Chemcraft [22].
Discussion
The influence of interaction of the investigated compounds with a solvent has made itself evident in the common shift trend of the solution absorption bands and absorption lines in the calculated spectra to the long-wave side as the polarity of a solvent decreases. The negative solvatochromic effect is observed. The data for experimental spectra and the data for calculations are listed in Tables 1 and 2, correspondingly. The experimental spectra of 2-allylthioquinoline solutions are shown on Fig. 1 and the calculated spectra of the different stable conformers of 2-allylthioquinoline in benzene, dichloromethane and ethanol are performed on Fig. 2. According to experimental UV-Vis spectra the shift in the range 310…390 nm equals 4-5 nm for λ max ; for the lines in the range 230…300 nm the shift is 11–22 nm. The calculated absorption lines have exhibited a similar shift with the experimental absorption lines, but they are less pronounced – an average of 3 nm for lines within stated ranges.
Solvatochromic effect was described in detail in [23]; the dipole moments in solvent media essentially increased at molecule transition from the ground state into the first excited state for most compounds described by the authors. As a rule, such a change of dipole moments causes the positive solva-tochromic effect. For 2-allyl and 2-ethylthioquinoline we can note, that possible development of the positive solvatochromic effect (as the calculated dipole moments of molecules increase at excitation) is neu- tralized by influence of other factors. Effect of stabilization of the ground state at solvation by the polar solvents can manifest more efficiently. It can be the result of steric difficulties or direction change of the dipole moment in a complex with a solvent. It is supposed that the influence of proton solvents and formation of hydrogen bonds with a solvent is inessential in this case, as the spectra in ethanol medium are consistent with the common trend.
Table 1
Absorption maxima in the experimental spectra of solutions of the compounds in various solvents, nm
|
Solvent Соmpound |
Acet on e |
Ethanol |
Dichloromethane |
Benzene |
Carbon tetrachloride |
|
33 7. 5 32 6. 5 |
339 |
339 |
342 |
||
|
2-allylthioquinoline |
328 |
328 |
328 |
– |
|
|
255.5 |
257 |
277.5 |
|||
|
339.5 |
343 |
343 |
|||
|
2-ethylthioquinoline |
– |
329 |
– |
330 |
|
|
255.5 |
257 |
266 |
Table 2
Most intensive absorption lines in the calculated spectra in various solvents, nm (oscillator strength is in the brackets)
|
Solvent Соmpound |
Acet on e |
Ethanol |
Dichloromethane |
Benzene |
Carbon tetrachloride |
|
2-allylthioquinoline (conformer “А”) |
318.5 ( 0 .0 98 ) 246.3 ( 0 .3 90 ) |
319.5 ( 0.098 ) 253.8 ( 0.098 ) 245.6 ( 0.365 ) |
– |
321.4 ( 0.094 ) 251.7 ( 0.237 ) 241.0 ( 0.277 ) |
321.4 ( 0.094 ) 251.7 ( 0.238 ) 241.0 ( 0.278 ) |
|
2-allylthioquinoline (conformer “В”) |
314.7 ( 0 .1 15 ) 248.6 ( 0 .4 83 ) |
315.5 ( 0.117 ) 248.8 ( 0.518 ) |
315.4 ( 0.115 ) 248.9 ( 0.496 ) |
318.5 ( 0.115 ) 250.2 ( 0.530 ) |
318.7 ( 0.115 ) 250.4 ( 0.530 ) |
|
2-ethylthioquinoline |
316.9 ( 0 .1 09 ) 248.4 ( 0 .5 16 ) |
316.7 ( 0.109 ) 248.3 ( 0.517 ) |
316.9 ( 0.108 ) 248.3 ( 0.517 ) |
318.3 ( 0.106 ) 248.7 ( 0.516 ) |
318.3 ( 0.106 ) 248.7 ( 0.516 ) |
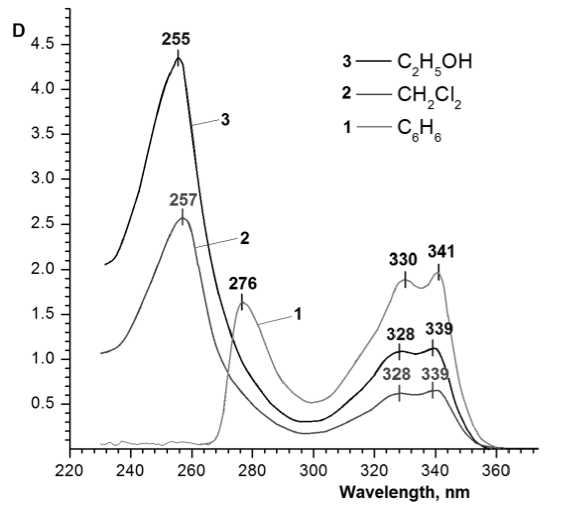
Fig. 1. Electronic absorption spectra of 2-allylthioquinoline solutions in benzene, dichloromethane, ethanol
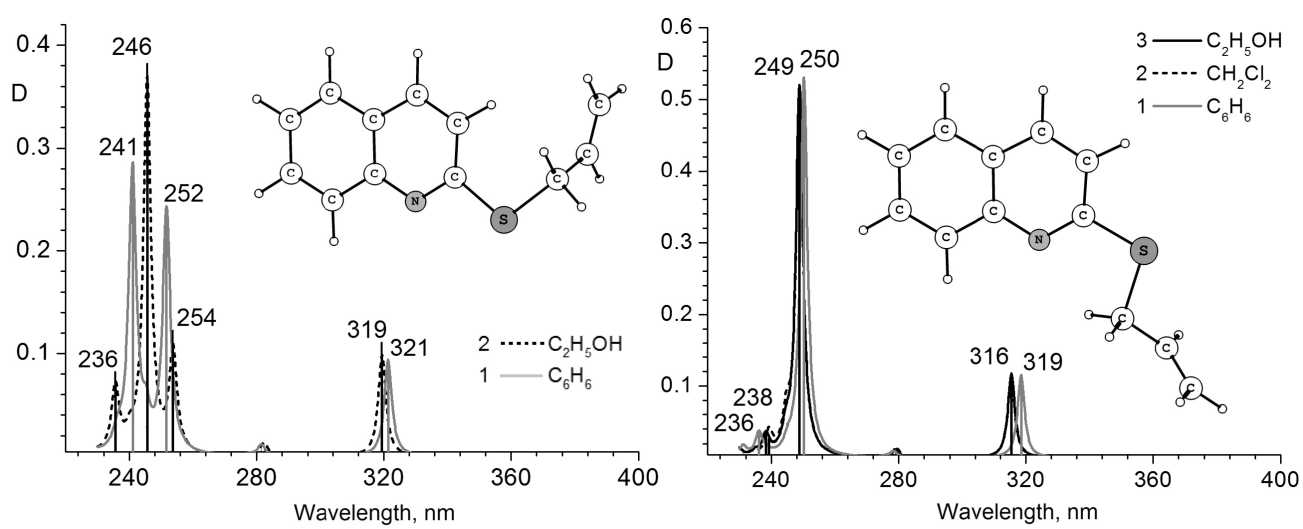
Calc ulated s pectra of v arious 2-ethylthioquinoline conformers are shown to be identical to each oth er, w it h the shi ft of abs o r pt i on lin es to on e s i de or a n ot h e r by 1–10 nm. Thus, the bathochromic shift 1–6 nm of absorption line λ max for conformer with the smaller total energy was obs erve d. T he calcu la t e d spectra of various 2- ally lth ioqu in olin e c onfor mers differ more essentially (Table 2). Such features can pr ov ide po s sib le exp lan a t io ns of experimentally observable spread of absorption b ands .
a)
b)
Fig. 2. Calculated electronic spectra of 2-allylthioquinoline: (a) conformer “A” in ethanol and benzene solutions; (b) conformer “B” in ethanol, dichloromethane and benzene solutions
Calculated absorption lines λ max for all solutions of 2-ethylthioquinoline and 2-allylthioquinoline are within the limits of experimental absorption band 310…350 nm. The width of all these bands is similar for all experimental spectra. As a whole, it can be stated that both the calculated spectra and the spectra of solutions of studied compounds are similar and do not significantly depend on the character of a substituent at the sulfur atom, within limits of observable absorption bands.
Comparing of the electron transitions between molecular orbitals (МО) that define the excited states of a molecule and the corresponding absorption lines in UV-Vis spectra, we can conclude the following. The calculated value λ max , which always determined by transition HOMO-LUMO for the presented compounds, is within the narrow range 315…325 nm. We classify the given transition as n →π *, which affects interaction of the lone electron pairs of the sulfur atom with the delocalized electrons of the quinoline heterocycle conjugated with the sulfur atom. It explains the fact that the λ max value is very weakly influenced by the alkyl substituent at the sulfur atom changing into alkenyl group. The calculations confirm (Table 3) that Δ E HOMO-LUMO for the presented compounds varies not more than 0.1 eV, if the allyl group was replaced by the ethyl group. This value does not exceed the range of Δ E HOMO-LUMO for various conformers of the same compound.
Table 3
Calculated energy characteristics of HOMO-LUMO electron transitions in various solvents, eV
|
Solvent Соmpound |
Ethanol |
Dichloromethane |
Benzene |
||||||
|
E HOMO |
E LUMO |
Δ E |
E HOMO |
E LUMO |
Δ E |
E HOMO |
E LUMO |
Δ E |
|
|
2-allylthioquinoline (conformer “А”) |
–6.316 |
–1.894 |
4.422 |
– |
–6.155 |
–1.761 |
4.394 |
||
|
2-allylthioquinoline (conformer “В”) |
–6.324 |
–1.850 |
4.474 |
–6.335 |
–1.859 |
4.476 |
–6.174 |
–1.739 |
4.435 |
|
2-ethylthioquinoline |
–6.272 |
–1.820 |
4.452 |
–6.240 |
–1.793 |
4.447 |
–6.120 |
–1.690 |
4.43 |
For the calculated structure of 2-allylthioquinoline (in benzene media) it has been established that the distance between the nitrogen atom and the double bonded atoms of the allyl group in different conformers varies slightly. However, while for conformer “А” (Fig. 2) in the range 240…260 nm the calculated spectrum shows two intensive absorption lines, in the spectrum of conformer “B” there is only one intensive line. It is caused by sharp decreasing of oscillator strength (λ=241 nm) associated with the electron transition HOMO-3→LUMO, in which the orbitals of π-bond of the allyl group and the quinoline ring are involved. Thus, the influence of the spatial arrangement of the double bond of allyl substituent on changing atomic contributions into some electron transitions is shown. In such a case for con- former “А” the increasing media polarity promotes the change of the basic contribution into HOMO-3 from the allyl group carbon to the orbitals of nitrogen and carbon in the quinoline. This modification also decreases the oscillator strength λ=241 nm. For conformer “B” no active contributions to electron transitions depend on a solvent, and all calculated spectra are virtually the same.
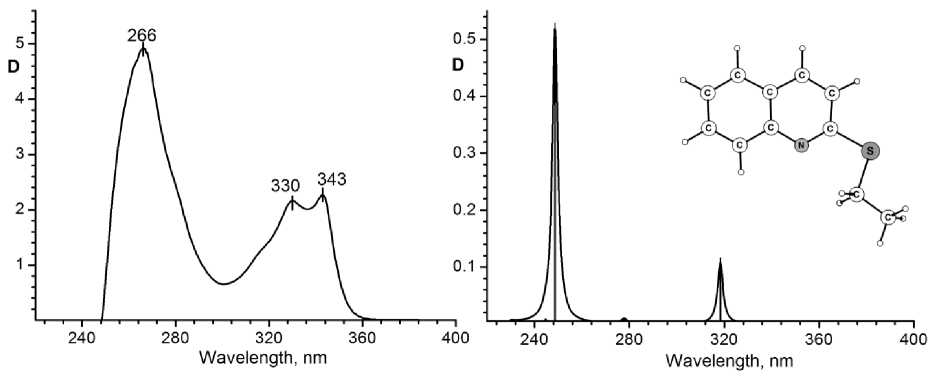
The typical experimental a nd c alc u la t e d ele ctr on ic s pe c t r a of 2 -ethylthioquinoline are shown in Fig. 3. A ppar ent ly a bse n t e f fe c t of solvent polarity on the set of active contribut i ons int o МО is observed for 2- ethy lth ioqu ino lin e . T h e c ont r i but ion s int o МО of various conformers are identical for polar and nonpo lar me dia , a nd th e pa t terns of absorption lines are practically identical. T hu s, th e spec t ral c h aracteristics of 2-ally lth ioqu inol ine depend on conformational variety and polari ty of a solv e nt g r e a ter, than the spectra of 2- ethy lthioqu ino lin e , a s f o llows f ro m the c a lc u lati on data .
a) b)
Fig. 3. (a) Electronic absorption spectrum of 2-ethylthioquinoline solution in tetrachloromethane. (b) Typical calculated electronic spectrum of 2-ethylthioquinoline (in tetrachloromethane)
Conclusion
C ompa ra tiv e a n a ly sis of experimental and calculated electronic absor pt io n spec t r a o f 2 -allylthioquinoline and 2-ethy lthio quinoline solutions has been performed. It has be e n found that in b ot h cases the absorption band of 3 1 0. . . 350 nm c or r e s pon ds to λ max in the calculated spectra. Due to the fact t hat on ly mole c ula r or b it a l s wit h contributions of sulfur atom and atoms of the quino li ne r ing a re inv olv e d i n thi s ele ctr o n t r a n sit ion, the r e p la ce me nt of t he a lk y l g r oup by the a l kenyl one does not influenc e d r ast ic ally on the e nergy c h aracteristics of the considered electron transitio n . T h is obs e r v a t io n has b e e n v e r i f i e d in the a n a ly si s of v a rious conformational states of the compounds. W e ha v e a l so f ou nd t hat the decrease of solvent po lar i ty in the se ries etha n ol – dichloromethane – benzene is accompanied by the negative solvatochromic effect.
Acknowledgements
The wor k wa s suppo r t e d by the Russian Ministry for Education and Science GZ 729 a nd w a s ca rr i e d out on a supercomputer “TO R NADO”.
References Combined approach to UV-Vis study of 2-allyl and 2-ethylthioquinolines in various solutions
- Runge E., Gross E.K.U. Density-Functional Theory for Time-Dependent Systems. Physical Review Letters, 1984, vol. 52, pp. 997-1000. DOI: DOI: 10.1103/PhysRevLett.52.997
- Dreuw A., Head-Gordon M. Single-Reference ab Initio Methods for the Calculation of Excited States of Large Molecules. Chemical Reviews, 2005, vol. 105, pp. 4009-4037. DOI: DOI: 10.1021/cr0505627
- Jacquemin D., Perpète E.A., Ciofini I., Adamo C. On the TD-DFT UV/Vis Spectra Accuracy: the Azoalkanes. Theoretical Chemistry Accounts, 2008, vol. 120, pp. 405-410. DOI: DOI: 10.1007/s00214-008-0424-9
- Makarov A.Yu., Chulanova E.A., Semenov N.A., Pushkarevsky N.A., Lonchakov A.V., Bogomyakov A.S., Irtegova I.G., Vasilieva N.V., Lork E., Gritsan N.P., Konchenko S.N., Ovcharenko V.I., Zibarev A.V. A Novel Sulfur-nitrogen π-heterocyclic Radical Anion, (6H-1,2,3-benzodithiazol-6-ylidene)malononitrilidyl, and its Homo-and Heterospin Salts. Polyhedron, 2014, vol. 72, pp. 43-49. DOI: DOI: 10.1016/j.poly.2014.01.027
- Siud Pui Man, Benoit D.M., Buchaca E., Fola Esan, Motevalli M., Wilson J., Sullivan A. Synthesis, Structural Characterization, Experimental, and Computational Spectrophotometric Studies of 8-Quinolinyloxymethyphosphonate Compounds. Inorganic Chemistry, 2006, vol. 45, pp. 5328-5337. DOI: DOI: 10.1021/ic052085g
- Becke A.D. Density-functional Thermochemistry. III. The Role of Exact Exchange. The Journal of Chemical Physics, 1993, vol. 98, pp. 5648-5652. DOI: DOI: 10.1063/1.464913
- Lee C., Yang W., Parr R.G. Development of the Colle-Salvetti Correlation-energy Formula into a Functional of the Electron Density. Physical Review B, 1988, vol. 37, pp. 785-789. DOI: DOI: 10.1103/PhysRevB.37.785
- Krishnan R., Binkley J.S., Seeger R., Pople J.A. Self-consistent Molecular Orbital Methods. XX. A Basis Set for Correlated Wave Functions. The Journal of Chemical Physics, 1980, vol. 72, No. 1, pp. 650-654. DOI: DOI: 10.1063/1.438955
- McLean A.D., Chandler G.S. Contracted Gaussian Basis Sets for Molecular Calculations. I. Second Row Atoms, Z=11-18. The Journal of Chemical Physics, 1980, vol. 72, No. 10, pp. 5639-5648. DOI: DOI: 10.1063/1.438980
- Klamt A. Calculation of UV/Vis Spectra in Solution. The Journal of Physical Chemistry, 1996, vol. 100, pp. 3349-3353. DOI: DOI: 10.1021/jp950607f
- Mennucci B., Tomasi J., Cammi R., Cheeseman J.R., Frisch M.J., Devlin F.J., Gabriel S., Stephens P.J. Polarizable Continuum Model (PCM) Calculations of Solvent Effects on Optical Rotations of Chiral Molecules. The Journal of Physical Chemistry A, 2002, vol. 106, pp. 6102-6113 DOI: 10.1021/jp020124t
- Tomasi J., Mennucci B., Cammi R. Quantum Mechanical Continuum Solvation Models. Chemical Reviews, 2005, vol. 105, pp. 2999 3094 DOI: 10.1021/cr9904009
- Karabacak M., Cinar M. FT-IR, FT-Raman, UV Spectra and DFT Calculations on Monomeric and Dimeric Structure of 2-Amino-5-bromobenzoic Acid. Spectrochimica Acta A, 2012, vol. 86, pp. 590-599 DOI: 10.1016/j.saa.2011.11.022
- Kim D.G. Synthesis and Halocyclization of 2-Alkenylthioquinolines. Chemistry of Heterocyclic Compounds, 2008, vol. 44, pp. 1355-1358 DOI: 10.1007/s10593-009-0195-9
- Kim D.G., Vershinina E. A. Synthesis of the Thiazoloquinolinium System. Chemistry of Heterocyclic Compounds, 2010, vol. 46, pp. 773-774 DOI: 10.1007/s10593-010-0585-z
- Bremond E., Kieffer J., Adamo C. A Reliable Method for Ftting TD DFT Transitions to Experimental UV-visible Spectra. Journal of Molecular Structure: THEOCHEM, 2010, vol. 954, pp. 52 56 DOI: 10.1016/j.theochem.2010.04.038
- Bremond E., Le Bahersc T., Riccid G., Ciofinia I., Adamo C. In Silico Assessment of the HPLC-UV Response Coefficients. Computational and Theoretical Chemistry, 2014, vol. 1040-1041, pp. 1 5 DOI: 10.1016/j.comptc.2014.03.028
- Adamo C., Barone V. Toward Reliable Density Functional Methods without Adjustable Parameters: The PBE0 Model. The Journal of Chemical Physics, 1999, vol. 110, pp. 6158-6170 DOI: 10.1063/1.478522
- Matveychuk Yu. V., Ilkaeva M.V., Krivtsov I.V., Bartashevich E.V. Comparative Analysis of Theoretical and Experimental UV-Spectra of 2-and 8-Thioquinoline. Bulletin of the South Ural State University. Ser. Chemistry, 2015, vol. 7, No. 2, pp. 45-55.
- Emsley J. The Elements (3rd ed.). Oxford, Oxford University Press, 1998. 300 p.
- Granovsky A.A. Firefly version 8. Available at: http://classic.chem.msu.su/gran/firefly/index.html (accessed 2 January 2016).
- Andrienko G.A. Chemcraft v.1.6. Available at: http://www.chemcraftprog.com/index.html (accessed 2 January 2016).
- Reichardt C. Solvents and Solvent Effects in Organic Chemistry (2nd Ed.). Weinheim, VCH Verlagsgesellschaft mbH, D-6940, 1988. 750 p.
