Common Carotid Artery Lumen Segmentation in B-mode Ultrasound Transverse View Images

Author: Xin Yang, Mingyue Ding, Liantang Lou, Ming Yuchi, Wu Qiu, Yue Sun
Journal: International Journal of Image, Graphics and Signal Processing(IJIGSP) @ijigsp
Article in issue: 5 vol.3, 2011.
Free access
To evaluate atherosclerosis, common carotid artery (CCA) lumen segmentation requires outlining the intima contour on transverse view of B-mode ultrasound images. The lumen contours are automatically segmented using a morphology method in this paper. The proposed method is based on self-adaptive histogram equalization, non-linear filtering, Canny edge detector and morphology methods. Experiments demonstrated that the merit (FOM) value of lumen segmentation is 0.705. The comparison between proposed method and manual contours on 180 transverse images of the CCA showed a mean absolute error of 0.47±0.13 mm and mean max distance of 2.08±0.63 mm respectively. These results compare favorably with a clinical need for reducing use variability.
Common Carotid Artery (CCA), B-mode Ultrasound (US), Transverse View, Morphology, Lumen Contour Segmentation
Short address: https://sciup.org/15012179
IDR: 15012179
Text of the scientific article Common Carotid Artery Lumen Segmentation in B-mode Ultrasound Transverse View Images
Published Online August 2011 in MECS
Stroke is the most serious, common neurological problem globally and the second leading cause of mortality around the world [1]. Carotid atherosclerosis is the major cause of ischemic stroke, amounting to almost 90% of strokes. Patients who have at risk of stroke are treated with lifestyle, medical treatment and dietary changes. Therefore, it is important to monitor carotid plaques progression and regression in patients for assessing the efficacy of the treatment.
Parameters measurement and analysis to diagnose the cerebrovascular and cardiovascular pathologies have been shown significant attention in the coming year [2]. Ultrasound has been employed as the valid standard for inexpensive but non-invasive clinical diagnosis of
This project is supported by National Natural Science Foundation of China (NSFC) 30911120497/H0215 and 60975011/F030403. And we would like to thank the Robarts Research Institute at The University of Western Ontario, Canada, for providing data sets in this work.
atherosclerosis [3, 4] (the hardening of the arteries). The significance of the common carotid artery is that the long-term outcome of patients with carotid artery disease rest on modifying risk factors for circulation problems that can also lead to blockage in the heart, which would cause morbidity and mortality [5].
Segmentation and identification of CCA lumen in B-mode US images is an important step in evaluating arterial disease severity and finding vulnerable atherosclerotic plaques susceptible to rupture causing stroke [6]. Because of the complexity of anatomical structures, much noise as well as the requirement of accurate segmentation, interactions are needed between observers and computer segmentation algorithms.
Although interactivities provide users with the control over the final result of segmentation, they also introduce the potential for errors and variability because of the variable interaction among inter-observers and intraobservers. Accurate labeling the geometry of lumen in CCA is a crucial step in the assessment and management of the risk of heart attack or stroke. Therefore, the aim of the present study is to segment the lumen contour of CCA automatically and reduce medical physicians’ daily boring and tedious workload to label the boundary manually.
Contour identification in US images is still a challenge and difficult problem due to the lack of automation. And currently, most physicians segment the CCA inner region and related tissues in US images by manually tracing the boards to best fit the data based on their practitioner experience. Several studies are being conducted to improve the quality and detection within US images.
Haller and G. Li tried to measure the intima media thickness (IMT) of the arterial wall from longitudinal section by using a computerized method and active contour model [7, 8]. However, its role in clinical practice is not clear yet, as although IMT does predict cardiovascular risk, its addition to traditional risk factors in predictive risk models does not seem to improve risk classification [9]. And the region to select for IMT measurement is still a problem [10].
Two new methods proposed by Jun Wan et al. [11] for recognizing B-mode US imaging of CCA also in longitude view rather than cross section view.
Jayanthi K. B. [12] proposed a scheme for only detecting the normal regions in carotid artery US images. However, no step was taken to remove the noise in the images and therefore the contour obtained was not close to nature.
Fast Marching Method (FMM) had been developed for vascular US image segmentation, though most were developed for intravascular ultrasound (IVUS) images [13, 14].
-
L. Lou and M. Ding used particle motion mechanics to segment object boundaries, [15] but it is sensitivity to noise within US image.
N. Sang [16] and E. Kyriacou [17] dealt with the problem via morphology method on enhancement and classification rather than segmentation.
None of the methods discussed above have segmented the lumen contour from US images directly. In this paper, a novel algorithm base on morphology method is presented in order to segment lumen contour automatically on transversal section of the artery. And the contour could be easily used for physicians.
The following of this paper is organized as follows. In Section II, the proposed scheme modules are details explained in details. The results of the scheme are shown in Section III. Section IV and Section V will contain the discussion and conclusion.
-
II. Proposed Method
This paper is combined with the following series of steps to detect and segment the lumen wall:
Step1: Image acquisition through US;
Step2: Self-adaptive histogram equalization to improve the contrast of the US image;
Step3: Non-linear filtering to reduce speckle noise;
Step4: Extracting the edge data;
Step5: Creating a closed region of the lumen wall using morphological operation;
Step6: Creation of concrete contour of the lumen wall;
Step7: Overlapping lumen contour on original US image.
In the following subsections, each step will be discussed in details and all the steps are combined as a pipeline for a whole scheme.
-
A. Image Acquisition
All the arterial scans were performed using a Philips/ATL HDI 5000 US machine with a L12-5 probe (central frequency of 8.5 MHz) attached to a motorized linear mover 3D US acquisition system [18, 19]. The probe moved along the neck at a uniform speed of 3 mm/s around the bifurcation (BF) of the CCA in measurement of all subjects. A Pentium III computer with a frame grabber digitized two-dimensional 2D frames at 30 Hz from the ultrasound machine. The pixel size of 2D frames was 0.1 mm in both lateral and axial
directions, whereas the average number of pixels was 391 and 266 in lateral and axial directions, respectively. The 3D images were then reconstructed from the set of 2D frames during the scan. Since this study focused on segmentation of lumen contour, we only analyzed the special region, which from bifurcation extended 15 mm into the CCA. 3D US carotid artery image as shown in Figs. 1 and 2.
Fig.1 showed that 3D US carotid artery image to be segmented from bifurcation extended 15 mm into CCA. And the segmentation was performed on parallel slices separated by 1 mm as shown in Fig. 2. Therefore, the US images are recorded for each subject to show the transverse view of the CCA.
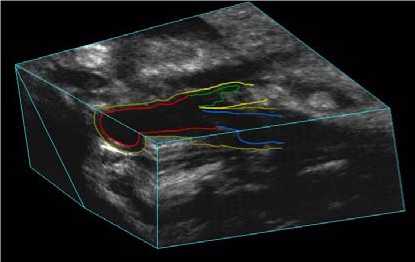
Figure 1. Regions to be segmented from BF extended 15 mm into CCA.
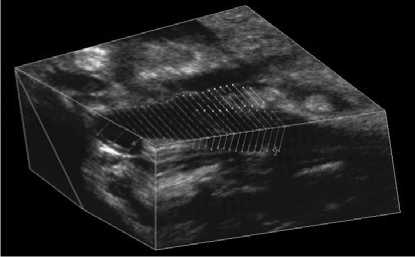
Figure 2. Segmentation to be performed on parallel slices separated by 1 mm.
-
B. Histogram Equalization
Currently, US images have the tendency to be extremely low in contrast. Histogram equalization was used to improve the contrast of the image without affecting the structure of the information contained. Moreover, self-adaptive histogram equalization enhances the contrast of the grayscale image by transforming the values using contrast limited adaptive histogram equalization (CLAHE).
CLAHE operates on small regions in the image, rather than the entire image. Therefore the contrast, especially in homogeneous areas, can be limited to avoid amplifying the noise in the image.
-
C. Speckle Reduction
US images have some inherent problems, including speckle noise and interference. This pre-processing step evolved non-linear filtering to de-noise using Speck Reducing Anisotropic Diffusion Method (SRAD). SRAD method has been used to enhance the edges by inhibiting diffusion across edges and allowing diffusion on either side of the edge. Speckle smoothing is carried out by considering an intensity image. The output image has been evaluated using a series of Partial Derivative Equation (PDE) in [20].
This SRAD-PDE is adopted because it exploits the instantaneous coefficient of variation in reducing speckle and provides superior performance over conventional anisotropic diffusion method in terms of smoothing uniform regions and preserving edges and features.
-
D. Edge Detection
There are many edge operators such as Roberts, Prewitt, Robinson, Kirsch, Laplacian and Frei-Chen [21]. Edge-based techniques are computationally fast and do not require a priori information about the image content.
Empirically, we found that Canny gave accurate representation of the true edge of the CCA lumen while helping eliminate the false lines due to speckle noise in the prior step of US images.
-
E. Morphology operation
Our aim is to find lumen contour and segment region enclosed by the boundary. However, a common problem is that the edges may not enclose the object completely. Morphological operators are used as a post-processing to clean the edge dataset generated by the Canny edge detector. Generally speaking, OPENING smoothes the contour of an object, breaks narrow isthmuses, and eliminates thin protrusions. CLOSING tends to smooth sections of contours, as opposed to OPENING, and it generally fuses narrow breaks and long thin gulfs, eliminates small holes, and fills gaps in the contour. Therefore, in order to create concrete contour of the artery wall, CLOSING is reasonable. Gaps and holes in the plaque contour can be eliminated and sealed by using a morphological close function.
Different structuring elements (SEs) could be used to close the lumen contour. When using morphological closing with US images presented, a SE of size N by N with octagon is used and N was empirically chosen as 21 to be geared for the highest degree of accuracy. The SE provides the necessary size to seal the plaque contour on the B-mode US image. A flat and octagonal SE gives a better representation of smooth lines since the lumen is actually irregular in some stenosis cases. Here N must be a nonnegative multiple of 3.
-
F. Contour Extraction
Following the closing of the US images, contour extraction is applied also via image morphology. This is achieved by using a dilation function, with a SE of 3 by 3 in size, and by subtracted this resulting image from the non-dilated contour image, as shown in (1):
Contour ( X ) = ( X ⊕ Y ) - X . (1)
Y represents the SE, and dilation of X by Y is denoted as X ⊕ Y . Finally, single pixel lumen contour is remained.
-
G. Image Composition
The final contour is superimposed on the original US image for the physician evaluating the disease. The desired segmented region can be selected and for further examined.
III. Results
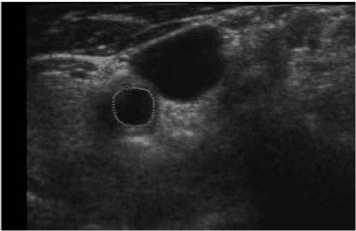
A whole scheme of our method was shown in the following pictures. And an example of B-mode US cross sectional images of CCA was used. Fig. 3 shows an example B-mode US image of transversal section. Note that the image quality is not good and the contrast is low. Fig. 4 shows the histogram equalized image after CLAHE and obviously the contrast has been improved. Fig. 5 shows the non-linear filtering image which the speckle noise is reduced effectively. This step is preferred since it not only smoothed the speckle noise but also preservers the edges. Fig. 6 shows the Canny edge detection. True contours are discovered with some false edges. Fig. 7 is generated by applying the morphological closing function on previous image in order to create a closed connected region. Fig. 8 shows the extracted contour and Fig. 9 is the lumen contour labeled on the original US image.
For comparison, we finally also superimposed our and manual segmentation results together as shown both in Fig. 10 and Fig. 11. Our lumen results were highlighted as magenta solid lines, while the corresponding manual lumen result are red dot lines.
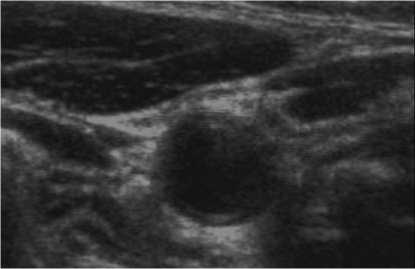
Figure 3. Original image.
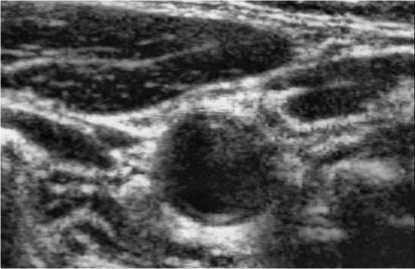
Figure 4. Histogram equalization.

Figure 5. Speckle reduction.
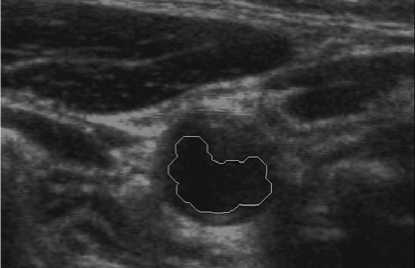
Figure 9. Lumen contour superimposed on original US image.
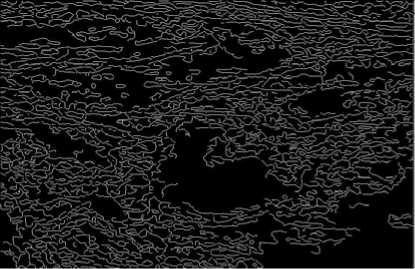
Figure 6. Canny edge detection.
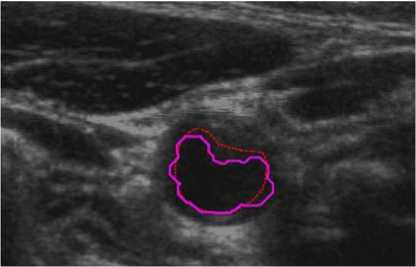
Figure 10. Comparison between manual and proposed method (P1).

Figure 7. Lumen contour extraction.
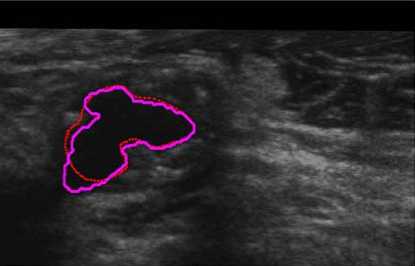
Figure 11. Severe stenosis comparison (P2).

Figure 8. Lumen contour extraction.
In Fig. 10 (Patient 1 with mild stenosis), we could infer that the lumen contour is sunken inside from right-top to left-down. It indicates that the patient is with mild stenosis and our method is capable of extracting carotid lumen contours of close to natural shapes.
While in Fig. 11 (Patient 2 with severe stenosis), it could implies that our result cover most of the lumen region except the left-down corner. The reason is that the corner of the image contrast and visibility is extremely low. Our method is suit for complex size.
Our scheme was also tested on another patient data (Patient 3), which had 60 series CCA images included double sides (Left and Right) obtained at two different times. Five of them were shown in Fig. 12. Note that 2 mm, or 10 mm was indicated the distance to the bifurcation point from each slice. In Fig. 12, we labeled our result as green solid line, while manual results were red dot line. Similar results were also obtained from the judgment. The tested results showed the robustness of our method, as a normal CCA could be extracted automatically.
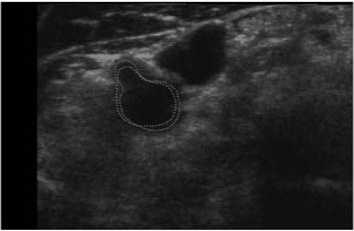
(a) 2mm
IV. Dicussion
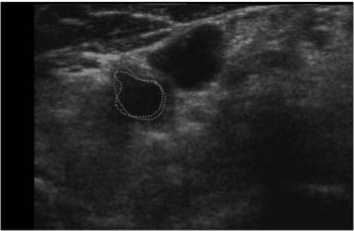
(b) 4mm
Although manually outlined contours are typically the only standard for evaluating computerized algorithm, it may suffer human observers’ bias and variability. In addition, it is time consuming and not suitable for a large database. In our work, three patients’ data sets with 180 US images experimental results showed that the segmented areas could accurately define the locations of CCA lumen and plaque contours.
The manual results are delineated by an experienced sonographyician as ground truth. To compare the contour similarity performance in our experiments, we were quantifying the algorithm performance in terms of contour similarity, we adopted the Pratt’s figure of merit (FOM) [20] defined by:
Np
FOM =
—1—s -J-r-max{ N p , N m } t!1 + ad
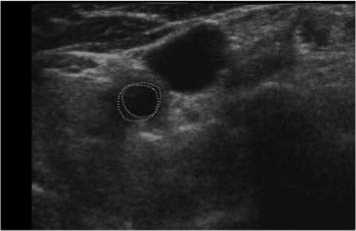
(c) 6mm
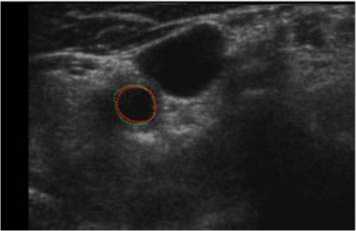
(d) 8mm
where Np and Nm are the number of proposed and manual contour pixels, respectively, di is the Euclidean distance between the i th proposed contour pixel and the nearest manual contour pixel, and a is a constant typically set to 1/9. FOM ranges between 0 and 1, with unity for ideal contour segmentation.
The lumen FOM value was listed in Table 1. It is obvious that the lumen FOM value is bigger than 0.5, which represents we got relatively better lumen segmentation result.
Furthermore, to evaluate our segmentation results we measured the mean absolute distance (MAD) and maximum distance (MaxD) between proposed method and manual contours. Table 1 also provided the mean and standard deviations of MAD and MaxD between 180 manual and automatic contours selected from 3 patient data sets.
TABLE I.
C omparison of manual and proposed method on FOM
Lumen FOM
FOM 0.705
MAD(mm) 0.47 ± 0.13
MaxD(mm) 2.08 ± 0.63
(e) 10mm
Figure 12. Segmentation on series of US images (P3).
Analysis the figures in Table 1, the reasons may affect the segmentation result could be: 1) Inside lumen mainly is liquid blood, while the outside is complex connective tissue from the view of CCA physiology. However, there was no clear boundary between different components in US images, which is shown in Figs. 10, 11 and 12. 2) Morphology could be suitable on irregularities contours, but the size and the shape of SE may be sensitive to the final results, which could be shown in Fig. 10. There is a little patch over-write in the right part. 3) The method could not cover up the deficiencies of nature of US images completely with extremely low contrast and high noise. 4) Also note that if the probe is not properly placed, it is not possible to get a proper view of the CCA for a wide and clear range of scenarios.
V. Conclusion
We have developed a novel segmentation technique for exacting carotid lumens in 2D US transverse view automatically. The method is based on self-adaptive histogram equalization, non-linear filtering, Canny edge detection and morphology methods. It could extract the lumen contours excellent in both normal and abnormal CCA US images regardless of the noise. This method could save the physicians’ invaluable time to take care of the atherosclerotic patients. Our work provides an easy-handle technique to simplify the job of labeling the lumen in CCA manually. Experimental results showed that the segmented areas could accurately define the locations of CCA lumen contours. The merit (FOM) value of lumen segmentation is 0.705. And mean absolute error and mean max distance are 0.47 ± 0.13 mm and of 2.08 ± 0.63 mm respectively compared with manual results as the ground truth.
This method could meet the demand of the clinical usage and save the physicians’ invaluable time to take care of the atherosclerotic patients.
In the further, we would like to adapt to our method for more accurate segmentation results firstly. And then, extend it to the adventitia segmentation work. Because of the degree of carotid atherosclerosis having positive correlation to cerebral infarction, the final segmentation contours both lumen and adventitia could offer the physician a better visualization on the atherosclerosis and plaques. And reducing doctors’ work load for labeling contours is at the same time.
Acknowledgment
We would like to sincerely thank the Robarts Research Institute at The University of Western Ontario in Canada for providing the US images used in this work. This project is supported by National Natural Science Foundation of China (NSFC) 30911120497/H0215 mainly and 60975011/F030403 partly. It is also supported by China Postdoctoral Science Foundation under the grants of 20100480906; and by the Fundamental Research Funds for the Central Universities under the grants of HUST: 2010JC036.
References Common Carotid Artery Lumen Segmentation in B-mode Ultrasound Transverse View Images
- Lopez, A. D. Mathers, C. D. Ezzati, M. Jamison, D. T. and Murray, C. J. “Global and regional burden of disease and risk factors, 2001: Systematic analysis of population health data,” The Lancet 367(9524), 1747–1757 (2006).
- N. Santhiyakumari and M. Madheswaran, “Non-invasive Evaluation of Carotid Artery Wall Thickness using Improved Dynamic Programming Technique,” Signal, Image and Video Processing J., vol. 2, pp. 183–193, Jan. 2008.
- Peter N.T. Wells, “Current Status and Future Technical Advances of Ultrasonic Imaging,” IEEE Engineering in Med and Bio, vol. 19, Issue 5, pp. 14–20, Sep./Oct. 2000.
- Aldons J. Lusis, “Atherosclerosis,” Nature, vol. 407, pp. 233–241, Sep. 2000.
- Stephanian E, “Carotid Endarterectomy – a patient’s guide,” http://medinformer.org/page/3948/.
- Iris Shai, J. David Spence, and Dan Schwarzfuchs, et al., “Dietary Intervention to Reverse Carotid Atherosclerosis,” Circulation, vol. 121, pp. 1200–1208, Mar. 2010.
- C. Haller, Janina Schulz and A. Schmidt-Trucks¨aß, et al., “Sequential Based Analysis of Intima-Media Thickness (IMT) in Common Carotid Artery Studies,” Atherosclerosis, vol. 195, pp. e203–e209, 2007.
- Li Guo-kuan, Cheng Xin-yao, Zhou Yuan and Song En-min, “Intima and Adventitia Segmentation of the Common Carotid Artery in Ultrasound Images Based on Active Contour Model,” J. Huazhong Univ. of Sci. & Tech. (Natural Science Edition), vol. 38, No. 6, pp. 75–79, Jun. 2010. (in Chinese).
- Matthias W. Lorenz, Carolin Schaefer, Helmuth Steinmetz, and Matthias Sitzer, “Is Carotid Intima Media Thickness Useful for Individual Prediction of Cardiovascular Risk? Ten-year Results from the Carotid Atherosclerosis Progression Study (CAPS),” European Heart Journal, vol. 31, Issue 16, pp. 2041–2048, Jun. 8 2010.
- Silvia Delsanto, Filippo Molinari, Pierangela Giustetto, William Liboni, and Sergio Badalamenti, “CULEX-Completely User-independent Layers EXtraction: Ultrasonic Carotid Artery Images Segmentation,” Proceedings of the 2005 IEEE Engineering in Medicine and Biology Society (IEEE-EMBS 2005) 27th Annual Conference, Shanghai, China, pp. 6468–6471, Sep. 1–4, 2005.
- Jun Wan, Qiuqi Ruan and Wei Li, “Using Two Methods for Recognition Common Carotid Artery of B-mode Longitudinal Ultrasound Image,” 2010 IEEE 10th International Conference on Signal Processing (ICSP2010 Proceedings), Beijing, China, pp. 1–4, Oct. 24-28 2010.
- Jayanthi K. Balasundaram and R. S. D. Wahida Banu, “A Non-invasive Study of Alterations of the Carotid Artery with Age using Ultrasound Images,” Med Bio Eng Comput, vol. 44, pp. 767–772, 2006.
- Marie-Hélène Roy Cardinal, Gilles Soulez, Jean-Claude Tardif, Jean Meunier and Guy Cloutier, “Fast-marching Segmentation of Three-Dimensional Intravascular Ultrasound Images: A pre- and post-intervention Study,” Med. Phys., vol. 37, No. 7, pp. 3633–3647, Jul. 2010.
- Marie-Hélène Roy Cardinal, Jean Meunier, Gilles Soulez, Roch L. Maurice, Éric Therasse, and Guy Cloutier, “Intravascular Ultrasound Image Segmentation: A Three-Dimensional Fast-Marching Method Based on Gray Level Distributions,” IEEE Trans. on Medical Imaging, vol. 25, No. 5, pp. 590–601, May 2006.
- L. Lou, M. Ding, “Principle and Approach of Boundary Extraction Based on Particle Motion in Quantum Mechanics,” Optical Engineering, vol. 46, Issue 2, pp. 027005-1–16, Mar. 01 2007.
- K.Q. Sun and N. Sang, “Morphological Enhancement of Vascular Angiogram with Multi-scale Detected by Gabor Filters,” Electronics Letters, vol. 44, Issue 2, pp. 86–87, Jan. 17 2008.
- E. Kyriacou, M.S. Pattichis and C.S. Pattichis, et al., “Classification of Atherosclerotic Carotid Plaques using Morphological Analysis on Ultrasound Images,” Appl Intell, vol. 30, pp. 3–23, 2009.
- A. Krasinski, B. Chiu, A. Fenster, and G. Parraga, “Magnetic Resonance Imaging and three-dimensional Ultrasound of Carotid Atherosclerosis: Mapping Regional Differences,” J. Magnetic Resonance Imaging, vol. 29, pp. 901–908, 2009.
- Joseph Awad, Adam Krasinski, Grace Parraga and Aaron Fenster, “Texture Analysis of Carotid Artery Atherosclerosis from Three-Dimensional Ultrasound Images,” Med. Phys., vol. 37, Issue 4, pp. 1382–1391, Apr. 2010.
- Yongjian Yu and Scott T. Acton, "Speckle Reducing Anisotropic Diffusion", IEEE Trans. on Image Processing, vol. 11, Issue. 11, pp. 1260–1270, Nov. 2002.
- Mohiy Hadhoud, Mohamed Amin and Walid Dabbour, “Detection of Breast Cancer Tumor Algorithm using Mathematical Morphology and Wavelet Analysis,” the International Congress for Global Science and Technology (ICGST) International Conference on Graphics, Vision and Image Processing (GVIP 2005) and Conference Venue: Cairo International Conference Centre (CICC), 2005.
