Comparative Analysis of Different Fabric Defects Detection Techniques

Author: Ali Javed, Mirza Ahsan Ullah, Aziz-ur-Rehman
Journal: International Journal of Image, Graphics and Signal Processing(IJIGSP) @ijigsp
Article in issue: 1 vol.5, 2013.
Free access
In last few years’ different textile companies aim to produce the quality fabrics. Major loss of any textile oriented company occurs due to defective fabrics. So the detection of faulty fabrics plays an important role in the success of any company. Till now most of the inspection is done using human visual. This way is too much time consuming, cumbersome and prone to human errors. In past, many advances are made in developing automated and computerized systems to reduce cost and time whereas, increasing the efficiency of the process. This paper aims at comparing some of these techniques on the basis of classification methods and accuracy.
Machine Learning, Computer Vision, multi-layer neural networks, 3D analysis, Novelty Detection, Texture Analysis
Short address: https://sciup.org/15012522
IDR: 15012522
Text of the scientific article Comparative Analysis of Different Fabric Defects Detection Techniques
Published Online January 2013 in MECS
Different machine vision techniques and pattern detection are helpful in the fault detection process of fabric. An efficient automated system should have minimum labor cost [1] and shorter duty cycle with respect to resources and time [2]. Fabric defaults make up 85% of the defects so produced in the fabric industry [3]. The producers of fabric earn some 45-65% of their earns from second quality or sub-graded fabric products [4]. So it is important to prevent these faults from happening. Most of these are caused by the malfunction of the machines and broken yarn reasons. Other faults may occur due to inadequate quality of yarn used. Oil spots may also appear in the fabric manufactured; these spots are generally along horizontal axis, irregular and warp direction [own]. An efficient automated system increases the quality and production of the fabric. Recently, the fault detection is mostly done manually by the human inspectors. This process is time consuming and all the times the inspection doesn’t produce the same results. Here the quality is subjective as it varies time to time and with the persons. The common practice today for the fault detection is, sufficient amount of fabric is produced and then it is detached from the weave machines and send to the quality control department or testing laboratories in the form of large rolls. An efficient solution to this situation is that we develop such a system that is completely automated and which inspects the whole fabric production process. Whenever a fault is occurred the process is stopped and triggers an alert to intimate that some error has occurred and it needs the attention to be corrected or the parameters need to be changed, so that quality is improved automatically. Nickoloy et al. [5] have shown that the investment in the automated fabric inspection system is economically profitable when we consider the associated personnel cost and benefits.
This paper comprises of four sections. First section includes a brief introduction about fabric defects, followed by section II, in which some texture analysis techniques used for fabric fault detection are discussed. In section III results of comparative analysis of different techniques are presented. Last section concludes the paper.
-
II. Texture Analysis Techniques for fabric fault
DETECTION
So far different techniques have been proposed for detection of defects. This paper is related to make a comparative analysis of some of the common fabricdefect identification techniques. These techniques are compared by using different measuring mechanism. The techniques are:
-
1. Regular Band based Methodology
-
2. Gabor Wavelet Filter Methodology
-
3. Methodology of Wavelet-Texture Analysis and LVQ Neural Network
-
4. Usage of Computer-Vision and Artificial Neural Network
5. Methodology of Digital Image Analysis
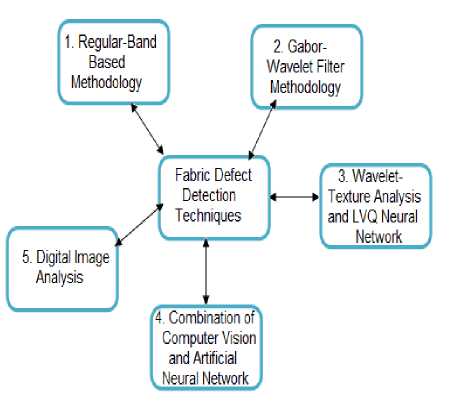
Fig 1. Common Methodologies for Fabric-Defect Detection
-
A. Regular Band-based Methodology
Regular band is a new pattern-texture driven inspection technique. This technique is constructed on the impression of periodic synchronization. This methodology helps in identifying defects with the help of change in pixel intensities such as fragmented end or dense bar. This technique uses only one parameter i.e. the duration of a period. And this methodology also outlines the defective portion of fabric in the final image. The regular band methodology consists of two subbands;
-
a) Light Regular Band (LRB): It is used to detect the lighter defects that become sometimes impossible to detect.
-
b) Dark Regular Band (DRB): It is used to detect the darker defects on various types of fabrics.
Light Regular Band:
At the defective region the original moving average (Avg) is greater than zero and standard deviation (SD) is smaller.
Avg >0, and SD is smaller
The severity of defect (M) is calculated by using the formula:
M= |Avg-SD| + SD (1)
Dark Regular Band:
At the defective region the original moving average (Avg) is less than zero and standard deviation (SD) is smaller.
Avg <0, and SD is smaller
The severity of defect (M) is calculated by using the formula:
M= |Avg+SD| -SD (2)
Regular band is distributed into two phases;
-
a) Training Phase
-
b) Testing Phase
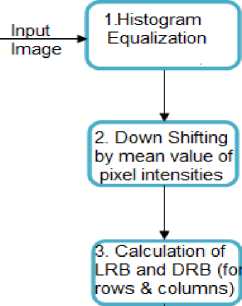
Training Phase:
As shown in figure 02, it is a 4-stage process in which firstly takes the input image and applies histogram equalization along with down-shifting the pixel intensities by means of values. Firstly the images are obtained and observe the image. There is a presence of Gaussian noise in the image that can blend with some major defects in the fabric. This noise can be removed by using histogram equalization to get the constant distribution of intensity and get the better contrast. For down shifting apply two lemmas such as for LRB and DRB. In the third phase find out LRB and DRB for both rows and columns. This produces overall two LRB’s and DRB’s for row and columns. Obtain threshold value for each regular band. This generates 8 threshold values such as:
-
a) 2 threshold values for Row LRB
-
b) 2 threshold values for Column LRB
-
c) 2 threshold values for Row DRB
-
d) 2 threshold values for Column DRB
Я. Obtain threshold value (upper and -lower bound )
Output to testing stage
Fig 2. Training Stage of RB
Testing Phase:
In this stage the resultant images obtained from training phase and apply zero padding for row and column LRB and DRB according to figure 03. Combine the result of row and column LRB while at the same time combine the result of row and column DRB. At the end combine all these results.
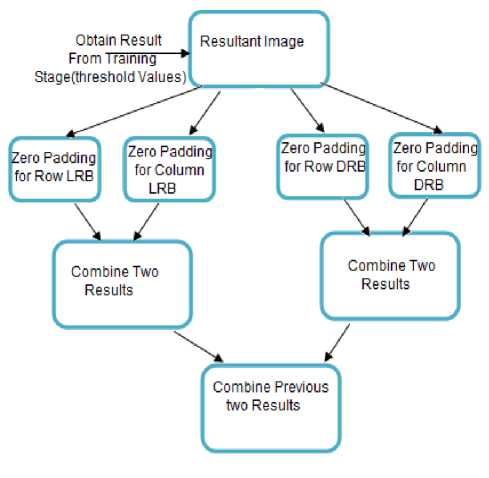
Fig 3. Testing Stage of Regular Band
-
B. Gabor Wavelet Filter Methodology
This methodology consists of morphological analysis and Gabor filter wavelet responses. It is divided into three stages as shown in figure 04. In this methodology defects appeared as basins on domes. So while finding the defects we can easily detect the domes or basins on the surface instead of finding the threshold.
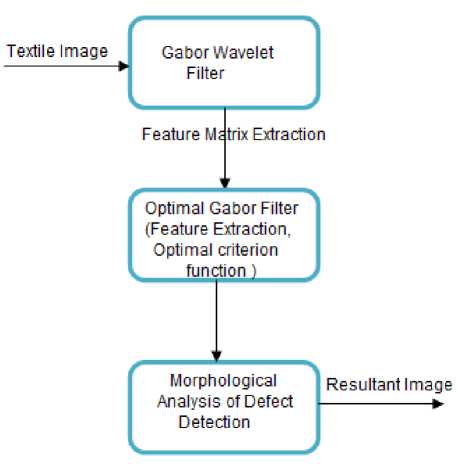
Fig 4. 3-Stages Process of Morphological Analysis and Gabor Filter Responses
In the first stage apply 2D Gabor Filter on the images because 2D Gabor filters are very helpful in computer vision and image processing [6][7]. This filter forms the matrix full of extracted features. In second stage (optimal Gabor Filter), firstly classify the images as defective and non-defective in nature then determine the frequency response of each of pixel [8]. The optimal criterion function includes fisher criteria to enhance the discrimination of defects in the fabric by using the Gabor Filter technique.
Last stage is related to the analysis of morphology in order to detect the defects[9]. This includes three phases:
-
a) Featured Image Normalization: Place different threshold values for the changing defects such as dark –colored and light colored defects.
-
b) Grayscale Image Reconstruction: Redesign the mask of the image. Find out the maxima and minima of the region in any grayscale image.
-
c) Regional Maxima and Domes Extraction: lets us to find out the “structural maxima” of any image named as “H-domes” or “H-basins”
This technique doesn’t involve the histogram equalization of input image due to the reason of inaccurate result generation while using histogram equalization. This methodology is also helpful for the detection of other textured material such as steel, wood etc.
-
C. Approach of Wavelet-Texture Analysis and LVQ Neural Network
This approach supports in detecting 7 diverse categories of defects in silk fabric. This methodology consists of the combination of Generalized Gaussian Density (GGD) [10] [11], wavelet transform [12], defect segmentation and Learning Vector Quantization (LVQ) Neural Network [11]. This methodology is four staged process as shown in figure 05.
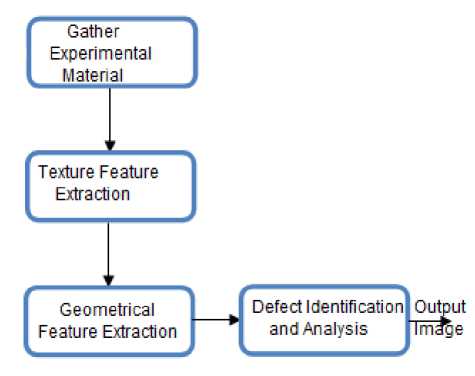
Fig 5. Methodology of Wavelet-Texture Analysis and LVQ Neural Network
In this approach two drive centered features are removed. These features are removed by the direct use wavelet coefficients. It contains identical features as the shape and size factors predicted by GGD model with ML (maximum likelihood) predictor. In this methodology there are basically 6 types of defects are taken as sample and fabric without defect is taken in order to find out the identification rate of defects [13].
-
D. Usage of Computer-Vision and Artificial Neural Network
This approach is a combination of computer vision and artificial neural networks. Considering the defect recognizer that implements the concept of computer vision. This defect recognizer is trained to detect 4 types of fabric defects. After that gathers the input for the neural network configuration. Firstly any image capturing device captures the images of fabric through. After acquisition phase convert the RGB image into binary image through image restoration and threshold process [14]. This output image contains the defected portion along with the other objects. The output is constantly consumed as an input by neural network process. This network classifies the defected portion out of the fabric material [15].
Figure 6 depicts the whole process of this methodology. Application of computer vision and neural networks are used to get the desired results.
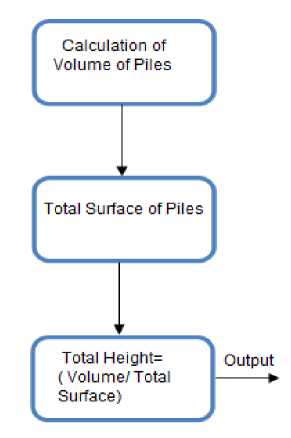
Fig 7. Digital Image Analysis 3-Stage Procedures
Image Acquisition
Convert RGB imag । into Binary -JmageRestoration
Back-Propagation
Algorithm
Computer Vision Process
Decision Logic for Result

Neural Network Process
Fig 6. Computer-Vision and Neural Networks based Approach
-
E. Methodology of Digital Image Analysis
Digital image processing technique is used to evaluate the fabric pills. This technique is related to find out the pills and measure its average intensity on the basis of three criteria’s such as heights, volumes and surface. The result is shown on the basis of number of revolutions and pills oriented fabric quality. This technique was only implemented in pure cotton fabrics [16].
To distinguish the pilled area in fabrics, three stage procedures are followed as shown in Figure 7. First stage is related to the calculation of piles volume which is actually the aggregate value of elements in matrix. Then the total surface of piles is 1cii+dentified. This is completed by summing up all defects from the matrix [17].
In last stage calculate the mean height is calculated using below given formula [18].
Mean Height= Volume/Total Surface (3)
-
III. Comparative studies
The comparative study of above mentioned techniques is not easy enough, as all the techniques use different parameters. Different techniques use different dataset of information. The resolution of the images used for the detection process also matters a lot. Regular Band based Methodology is used to detect small defects with box, star or dot patterns. About 166 images were taken as samples to vary out the experiment. The results were about 99.4% accurate. Gabor Wavelet Filter Methodology is used to detect with almost 30 types of different defects. Its accuracy is about 96 %. WaveletTexture Analysis technique is tested over 350 images and its accuracy turns to be 95% with 7 different types of defects tried. Computer vision and neural networks techniques are applied to 200 images and accuracy is about 77 % overall for 4 types of defects. Here the size of the image also affects the efficiency of the algorithm devised. Digital Image Analysis techniques are tried over 2000 images and accuracy turns to be about 83 %.
-
IV. Conclusion
After comparing different metrics and parameters we analyzed that RB is far better than any other described techniques as it revolves around the simple concept of standard deviation and moving average as shown in Table-1. It produces crystal clear result at the end with the accuracy rate of 99.4% by considering only one parameter i.e. Length of Period. It has an excellent capability to detect the outlines of defective shape. But it contains only one weakness that it cannot detect the defects near the border areas. If we priories the techniques considering the no. of defects along with the accuracy then Gabor Wavelet Filter Methodology is best of all with about 96 % accuracy.
Table I Comparative Analysis of Fabric Defects Detection Methodologies
|
Sr # |
Technique/ Classification Name |
Classification Technique |
Accuracy %age of Fabric Defect Classification |
Total Fabric Samples and Defect Types |
|
1 |
Regular Band based Methodology |
Light Regular Band (LRB), Dark Regular Band (DRB), Need one constraint “Length of the period” |
99.4%, |
166 images (with three patterned fabrics such as Box, Star and Dot Pattern) with 6 common types of defects and various other small defects |
|
2 |
Gabor Wavelet Filter Methodology |
Feature Matrix Extraction, Morphological Analysis of Defect Detection |
96% with 3.2 % of False Rate |
71 fabric images (39 of them are defect free), more than 30 types of defects are tested |
|
3 |
Methodology of Wavelet-Texture Analysis and LVQ Neural Network |
Texture Feature Extraction, Geometrical Feature Extraction, Defect Analysis and Identification |
The accuracy of Identification is on average of 7 type of defects is 95% |
Total 350 images with 7 types of defects (including wrap missing, weft missing, double weft, materialize bar, oil pigment, hole, non-defected ) |
|
4 |
Usage of Computer Vision and Artificial Neural Network |
Image Acquisition, Image Restoration, Output to the neural network, back propagation algorithm |
Overall average is 77%. Average identification for hole is 72%, for Scratch is 65%, For other faults 86% and for no faults is 83%. |
Total 200 images. Trained to 4 types of defects (Hole, Scratch, Other and no-fault) |
|
5 |
Methodology of Digital Image Analysis |
Calculation of Volume of Piles, Total Surface and Mean Height |
83% Accuracy |
Total 2000 Rotations |
References Comparative Analysis of Different Fabric Defects Detection Techniques
- Chin R. T. and Harlow C. A.,”Automated visual inspection ” IEEE Trans .Pattern Anal. Machine Intell., 4(6), 557-573, 1982.
- Smith, M.L., Stamp, R.J., "Automated inspection of textured ceramic tiles", Computers in Industry, Vol. 43 No.1, pp.73-82, 2000.
- Sengottuvelan P., Wahi A. and Shanmugam A.,“Automatic Fault analysis of Textile fabric Using. Imaging Systems”, Research Journal of Applied Sciences, 3(1), pp 26-31, 2008.
- K. Srinivasan, P. H. Dastor, P. Radhakrishnaihan, and S. Jayaraman, "FDAS: A knowledge-based frame detection work for analysis of defects in woven textile structures," Journal of Textile Institute, vol. 83, no. 3, pp. 431-447, 1992.
- Nickolay B. N. and Schmalfub H.,” Automatic Textile Inspection”, Study for the Textile Industry, vol. 73, 33-37, 1993.
- Hao Liu and Jiuqiang Han, "Defect Detection in Textiles Using Optimal Gabor Wavelet Filter". Proceedings of the 6th World Congress on Intelligent Control and Automation, 10005-10007, 2006.
- Lianping Chen, Guojun Lu and Dengsheng Zhang, “Effects of different Gabor filters parameters on image retrieval by texture,” Multimedia Modelling Conference, pp. 273 – 278, 2004.
- K. Fukunaga. “Statistical Pattern Recognition.”, Academic,New York, 2nd edition, 1990.
- Hamid Alimohamadi, Alireza Ahmadyfard and Esmaeil shojaee, “Defect Detection in Textiles Using Morphological Analysis of Optimal Gabor Wavelet Filter Response”, International Conference on Computer and Automation Engineering, 2009.
- Wang T., Li H., Li Z., Wang Z., “A Fast Parameter Estimation of Generalized Gaussian Distribution”, 8th International Conference on Signal Processing, 2006.
- Bashar, M. K., Ohnishi, N., Matsumoto, T., Takeuchi, Y., Kudo, H., Agusa, K., “Image Retrieval by Pattern Categorization using Wavelet Domain Perceptual Features with LVQ Neural Network”, Pattern Recognition Letters, Elsevier Ltd. , UK, 26, pp. 2315-1335, 2006.
- Wouwer G. V., Scheunders P., Dyck D. V., “Statistical Texture Characterization from Discrete Wavelet Representation”, IEEE Transactions on Image Processing, IEEE Signal Processing Society, USA, 8, pp. 592-598, 1999.
- Jianli Liu and Baoqi Zuo, “The Recognition of Fabric Defects Using Wavelet Texture Analysis and LVQ Neural Network”, 2nd International Congress on Image and Signal Processing, 2009.
- R. C. Gonzalez, R. E. Woods, S. L. Eddins, “Digital Image Processing using MATLAB”, ISBN 81-297-0515-X, pp. 76-104,142-166,404-407, 2005.
- Atiqul Islam, Shamim Akhter, and Tumnun E. Mursalin , “Automated Textile Defect Recognition System Using Computer Vision and Artificial Neural Networks” , World Academy of Science, Engineering and Technology , 2006.
- ASTM, D 3511-76, “Standard Test Method for Pilling Resistance and Other Related Surface Changes in Textile Fabrics”, Brush Pilling Tester Method.
- ASTM, D 3511-76, “Standard Test Method for Pilling Resistance and Other Related Surface Changes in Textile Fabrics”, Random Tumble Pilling Tester Method.
- Dariush Semnani, Hossein Ghayoor , “Detecting and Measuring Fabric Pills Using Digital Image Analysis” , World Academy of Science, Engineering and Technology 49, 2009.
