Comparative assessment of innovative development of the Far North regions

Author: Egorov Nikolay E., Kovrov Grigoriy S.
Journal: Arctic and North @arctic-and-north
Section: Social and economic development
Article in issue: 41, 2020.
Free access
The paper deals with the assessment of the level of innovative development of the Northern regions. Based on the data of the annual rating of innovative economies, performed by Bloomberg, a comparative analysis of the rating of innovative economies in the Nordic countries is presented. It is noted that Russia has been consistently ranked 25-27 in the last four years, although in 2016, it was in the 12th place. An overview analysis of methodological approaches and methods for assessing the level of innovative development of a region in Russia is carried out. On the basis of statistical data on the composite integral index, a comparative assessment of the level of innovative development of 17 regions of the Far North of the Russian Federation for 2017 is carried out, and the corresponding ranks are analyzed separately for 5 sub-indices of thematic blocks: socio-economic conditions, scientific and technical potential, innovation activity, export activity and the quality of regional innovation policy. The study shows a significant difference between the regions of the Far North of the Russian Federation in terms of the level of innovative development. In five subjects of the Far North of the Russian Federation, the values of the composite innovation index are higher than the average for the Russian Federation. Different positions occupied by regions are also observed in the rankings for individual sub-indices. The results of such ratings make it possible to assess the comparative advantages and disadvantages of specific regions for further consideration in the program documents on their innovative development.
Far north, subject, innovative development of the region, rating, indicator, subindex
Short address: https://sciup.org/148318361
IDR: 148318361 | UDC: 332.122(98)(045) | DOI: 10.37482/issn2221-2698.2020.41.62
Text of the scientific article Comparative assessment of innovative development of the Far North regions
Today, the economies of many countries and Russia are focused on innovative development, and the issues of assessing the level of innovative development of regions are topical. Assessment of the innovative potential of the region on the basis of constant monitoring of changes in its indicators is a necessary tool for determining the level of development of the innovative component of the regional economy and making various organizational and managerial decisions by local government authorities.
Currently, various methods and models for assessing the level of innovative region development (IRD) are proposed in Russia [1–9]. Despite numerous studies in this area, there is no uniform approach to assessing the innovation index [9, Mityakov S.N., Mityakova O.I., Murashova N.A., p. 97]. One of the tools for managing innovation activity is timely and robust monitoring, which allows to make quick decisions that prevent a failure in the implementation of projects of a full innovation cycle. The IRD indicators are the key performance indicators, recorded in the stra-
tegic regional documents [5, Ilyina I.E., Zharova E.N., Agamirova E.V. Kamenskiy A.S., p. 232]. For example, the Institute of Innovative Economics of the Financial University under the Government of the Russian Federation has developed the Concept for the formation of the IRD index of Russia 1. The index is a comprehensive assessment of the potential of IRD, taking into account the probable success and effectiveness of the implementation of new innovative projects based on a comprehensive analysis of the potential of the region. An important aspect of determining the prevailing conditions, the existing potential and the prospects for innovative development of a particular region is the identification and consolidation of specific socio-economic parameters registered by official statistics and available for use in calculating individual indicators [4, Droshnev V.V., Drosh-neva M.D., p. 75].
According to the authors [1, Barinova V.A., Zemtsov S.P., p. 116], the assessment of the level of innovative development of the region can be carried out only through the assessment of the contribution of the scientific and technological component to the growth of the gross regional product, other assessments suggest only the determination of the region's potential for the creation and implementation of new knowledge and technologies.
According to Lisina A.N. [6, p. 115], the main problem in determining the level of innovation development of a region is the lack of a scientifically grounded, necessary and sufficient number of indicators to assess the effectiveness of regional innovation processes. The analysis of management requirements shows that in order to improve the efficiency of management decisions in the innovation sphere, it is necessary to identify 15–20 indicators, on the basis of which the IRD is calculated. There is also a proprietary methodology for the rapid assessment of IRD based on the Triple Helix model, which makes it possible to perform a comparative econometric assessment of the level of IRD, as well as the contribution of the scientific and educational complex, business and the state to the overall innovative development of an economic entity according to their minimum key statistical indicators in the field of scientific and innovative activities [10, Egorov N.E.; 11, Egorov N., Pospelova T., Yarygina A., Klochkova E.].
Currently, the rating of the IRD is estimated by the Association of Innovative Regions of Russia (AIRR) and the Institute for Statistical Studies and Economics of Knowledge (ISSEK) of the National Research University “Higher School of Economics” (NRU HSE). For example, AIRR, together with the Ministry of Economic Development of the Russian Federation, with the participation of representatives of regional administrations and leading experts of the country, has developed an IRD rating for monitoring and management purposes 2. The rating represents the actual results of the innovative development of all constituent entities of the Russian Federation, with special at- tention paid to the analysis of the positions of the regions-members of the Association, the reasons for their movement in the final rating and its constituent sub-ratings. The rating of innovative regions of Russia in 2018 includes 29 indicators. The developed analytical rating system makes it possible to demonstrate the regional authorities strengths and weaknesses, directions for further development and improvement of innovation systems, as well as the dynamics of changes in all areas reflected by the indicators.
ISSEK of NRU HSE has been regularly issuing a rating of innovative development of the constituent entities of the Russian Federation since 20123. The ratings are based on the original system of quantitative and qualitative indicators of the innovative development of regions, which is based on the results of many years of research by ISSEK of NRU HSE and meets modern statistical standards used both in Russian state statistics and in the practice of leading countries and international organizations (OECD, Eurostat and etc.). It also integrates indicators used in similar developments of the European Commission (Regional Innovation Scoreboard) 4. The developed rating is the result of ranking the subjects in descending order of the values of the Russian Regional Innovation Index (RRII). The ranking examines the key components of the innovative development of regions by 53 indicators grouped into five thematic blocks: socio-economic conditions (A), scientific and technological potential (B), innovation activity (C), export activity (D) and the quality of regional innovation policy (E), each of which has its own sub-rating. The final RRII index is formed as the arithmetic mean of the normalized values of all indicators included in the rating. All regions are divided into four groups based on the lag of the values of the integral indicator of the RRII index from the result of the leading region. It should be noted that in the list of regions, data for the Arkhangelsk and Tyumen regions are given without taking into account information on the autonomous okrugs located on their territories. The main value of this rating is the individual profiles of 85 constituent entities of the Russian Federation, detailing the results for all indicators of innovative development and allowing to identify the features of the innovation system of each region.
For a comparative assessment of the innovative development of the northern countries of the world, the concept of the "Far North" is taken as a basis. The Far North is a part of the Earth's territory located mainly north of the Arctic Circle 5. Despite the fact that the countries of northern Europe occupy 20% of the territory of the entire northern part of the globe, their population is small and accounts for only 4% of all those living in this part of the world. Traditionally, the northern countries of the world include Denmark, Iceland, Norway, Finland, Sweden, Russia (Europe) and the countries of North America — Canada, USA 6.
According to the results of the rating of innovative economies, carried out annually by the Bloomberg Agency, Germany, South Korea, Singapore, Switzerland and Sweden are the five leading countries 7. This rating shows the general ability to develop innovative technologies in each state based on the analysis of dozens of criteria in seven categories: research and development, value-added production, productivity, high technology density, higher education efficiency, research concentration, patent activity. Among the Nordic countries, Sweden, Denmark, Finland and the United States are included in the TOP-10 innovative economies of the world in 2020 (Table 1). Over the past four years, Russia has been consistently occupying 25–27 positions, although in 2016 it was in the 12th place.
Table 1
Ranking of innovative economies of the northern countries
|
Country |
2020 |
2019 |
2018 |
2017 |
2016 |
|
Sweden |
5 |
7 |
2 |
2 |
3 |
|
Finland |
7 |
3 |
7 |
5 |
7 |
|
Denmark |
8 |
11 |
8 |
8 |
9 |
|
USA |
9 |
8 |
11 |
9 |
8 |
|
Norway |
17 |
17 |
15 |
14 |
14 |
|
Canada |
22 |
20 |
22 |
20 |
19 |
|
Iceland |
23 |
23 |
24 |
25 |
28 |
|
Russia |
26 |
27 |
25 |
26 |
12 |
As it is known, the key indicator of the effectiveness of innovative activities of an economic entity is the indicator “The proportion of innovative goods, works, services in the total volume of shipped goods, performed works, services”. The dynamics of changes in this indicator among the northern countries of Europe for 2007–2017 is shown in Fig. 1.
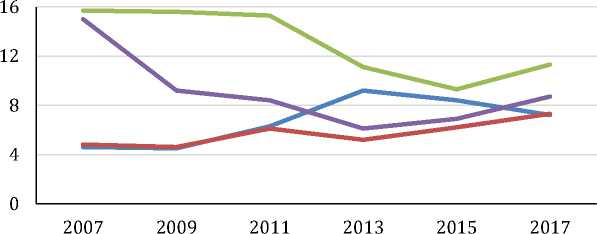
Russia Norway
Finland Sweden
Fig. 1. Dynamics of changes in the indicator “The share of innovative goods, works, services in the total volume of shipped goods, performed works, services” 8.
As can be seen from the presented illustration, according to this indicator, Finland occupies a leading position among the northern countries, although in the period 2011–2015 there is a decline in its level by 39.2%. A similar situation is observed in Sweden, which indicator decreased by 59.3% for 2007–2013. In Norway, over the entire period under consideration, there is a gradual increase in its value by 28.0%. Since 2013, Sweden and Norway have shown equally stable growth rates by 29.9% and 28.8%, respectively.
After achieving a two-time increase in the level of the indicator in 2013 as compared to 2007, Russia has experienced a constant negative development, reaching a value of 7.2% in 2017, which is a decrease of 21.7% compared to 2013. It should be noted that, in accordance with the approved target indicators for the implementation of the Strategy for innovative development of the Russian Federation for the period up to 20209, the value of the indicator “ The share of innovative goods, works, services in the total volume of shipped goods, performed work, services of industrial production organizations ” in 2020 year should increase by 3.5 times compared to 2013, reaching 25%.
Also, one of the main indicators of the development of the country's innovative economy is the indicator “Intensity of costs for technological innovation” ( the share of costs for technological innovation in the total volume of shipped goods, performed work, services ). According to this indicator, Sweden occupies a leading position among the Nordic countries, Russia is in 4th place with a value of 2.44% (Fig. 2), showing confident dynamics towards reaching the target of 2.5% by 2020 according to the target indicators of the Strategy 10.
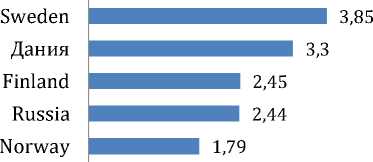
Fig. 2. Intensity of costs for technological innovation, 2017 11.
The concept of the “Far North” in Russia is a group of concepts with a vague spatial localization, depending on the purpose of consideration. For example, in order to regulate benefits and compensations for workers living in areas with a harsh climate, a certain territory of the Far North (and equivalent areas) is allocated. At the same time, in order to regulate the northern delivery,
the territory of the Far North is determined by the “List of regions of the Far North and equivalent areas with limited periods for the delivery of goods (products)” and does not coincide with the above-mentioned territory: there are regions and areas that are included in only one of these lists 12 .
The list of regions of the Far North (RFN) was first defined back in the USSR by Resolutions of the USSR Council of Ministers of 10.11.1967 No. 1029 and of 03.01.1983 No. 12. Subsequently, a new resolution with significant changes was issued by the same body in 1983 13. This legal act appeared because there were too many different laws regulating various spheres of life of people living in the RFN. The resolution was changed again in 2012, when some settlements of the Khanty-Mansi Autonomous Okrug began to belong to the RFN. In general, this normative act is still in force, although amendments are being made there in the form of new settlements, in which there are problems with the provision of products and a transport network. In 2019, the following territories are included in the list of regions of the Far North (Table 2).
Table 2
The list of regions of the Far North 14
|
Oblast |
Krai |
Republic |
Autonomous Okrug |
|
Murmansk |
Krasnoyarsk |
Komi |
Nenets |
|
Arkhangelsk |
Kamchatka |
Sakha (Yakutia) |
Khanty-Mansi |
|
Irkutsk |
Khabarovsk |
Karelia |
Yamal-Nenets |
|
Tyumen |
Tuva |
Chukotka |
|
|
Magadan |
|||
|
Sakhalin |
Thus, at present 17 regions from 4 federal districts belong to the regions of the Far North of the Russian Federation (FNRF): North-West — 5 (Murmansk and Arkhangelsk Oblasts, the Republics of Karelia and Komi, Nenets Autonomous Okrug (NAO)); Uralsky — 3 (Tyumen Oblasts, Khanty-Mansi (KhMAO) and Yamalo-Nenets (YaNAO) Autonomous Okrugs); Siberian — 3 (Krasnoyarsk Krai, Irkutsk Oblast, Republic of Tyva); Far East — 6 (Khabarovsk and Kamchatka Krais, Magadan and Sakhalin Oblasts; Republic of Sakha (Yakutia), Chukotka Autonomous Okrug (ChAO).
Results and Discussion
The rating of innovative development of the regions of the FNRF for 2017 is presented in Table 3.
Table 3
Rating of the FNRF regions by the level of the composite innovation index (CII), 201715
|
Regions |
CII |
Subindices |
||||
|
А |
В |
С |
D |
Е |
||
|
Krasnoyarsk Krai |
12 |
14 |
29 |
28 |
22 |
13 |
|
Khabarovsk Krai |
16 |
6 |
32 |
15 |
43 |
18 |
|
Tyumen Oblast |
25 |
11 |
11 |
21 |
33 |
67 |
|
Irkutsk Oblast |
33 |
24 |
18 |
47 |
27 |
43 |
|
Murmansk Oblast |
36 |
37 |
63 |
38 |
6 |
46 |
|
Khanty-Mansi Autonomous Okrug |
44 |
10 |
54 |
53 |
61 |
44 |
|
Arkhangelsk Oblast |
45 |
29 |
43 |
14 |
46 |
71 |
|
Republic of Sakha (Yakutia) |
55 |
15 |
55 |
55 |
57 |
53 |
|
Komi Republic |
57 |
55 |
14 |
79 |
44 |
56 |
|
Kamchatka Krai |
58 |
28 |
49 |
49 |
62 |
57 |
|
Yamal-Nenets Autonomous Okrug |
59 |
8 |
50 |
52 |
70 |
69 |
|
Republic of Karelia |
60 |
65 |
25 |
59 |
50 |
58 |
|
Sakhalin Oblast |
65 |
44 |
75 |
58 |
36 |
78 |
|
Magadan Oblast |
70 |
47 |
74 |
50 |
75 |
73 |
|
Republic of Tuva |
78 |
52 |
81 |
84 |
84 |
54 |
|
Nenets Autonomous Okrug |
84 |
84 |
84 |
69 |
72 |
84 |
|
Chukotka Autonomous Okrug |
85 |
81 |
85 |
67 |
77 |
85 |
According to the NRU HSE methodology, the regions occupying ranks 12–45 (7 subjects) are in group 2, which is inferior to the leader of the rating – Moscow – in terms of RRII by more than 20%, but no more than 40%. In the third group lagging behind in terms of CII from the first in the rating of the region by more than 40%, but not more than 60%, there were 8 subjects (55–78 ranks). The last group 4 includes two outsider regions out of 85 constituent entities of Russia, in which the values of RRII are lower than in Moscow by more than 60%. Thus, only 5 regions of the FNRF out of 85 constituent entities of the Russian Federation, occupying from 12th to 36th places in the rating, have CII values above its average for the Russian Federation (0.3349) (Fig. 3). These are Krasnoyarsk (0.4424) and Khabarovsk (0.4077) Krais, Tyumen (0.3739), Irkutsk (0.3551) and Murmansk (0.3521) oblasts, which generally occupy relatively high places in the “Social economic conditions ”(see Table 3).
Krasnoyarsk Krai Khabarovsk Krai
Tyumen Oblast
Irkutsk Oblast
Murmansk Oblast
Khanty-Mansi Autonomous Okrug
Arkhangelsk Oblast
Republic of Sakha (Yakutia)
Komi Republic
Kamchatka Krai
Yamal-Nenets Autonomous Okrug
Republic of Karelia Sakhalin Oblast
Magadan Oblast
Republic of Tuva
Nenets Autonomous Okrug
Chukotka Autonomous Okrug
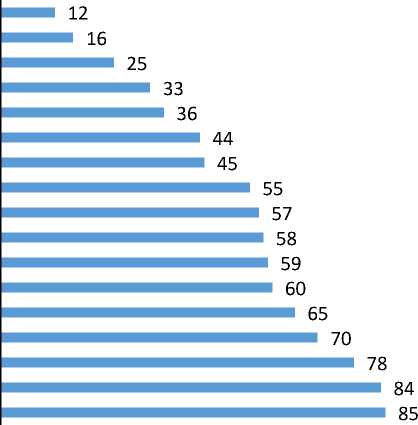
Fig. 3. Raiting of CII of FNRF regions, 2017 16.
The corresponding ranks for 5 sub-indices of thematic blocks analysis shows that positions occupied by the leaders-regions differ. So, according to the sub-index “Socio-economic conditions” there are 6 regions of the FNRF above its average value for the Russian Federation (0.414), which occupy 6-15 places among 85 subjects. It shows the presence of good socio-economic conditions for the development of innovative activities in these subjects. The sub-index includes the main macroeconomic indicators, educational potential of the population and the potential for digitalization of the region. According to this sub-index, the top three regions of the FNRF are headed by the Khabarovsk Krai, the Yamalo-Nenets (Yamalo-Nenets Autonomous Okrug) and the Khanty-Mansi Autonomous Okrug (KhMAO), the Tyumen Oblast, which are in the TOP-10 regions of the Russian Federation in terms of educational potential (Khabarovsk — the 2nd place, KhMAO — the 8th) and the potential for digitalization (YaNAO — the 5th place, KhMAO — the 4th) (Fig. 4).
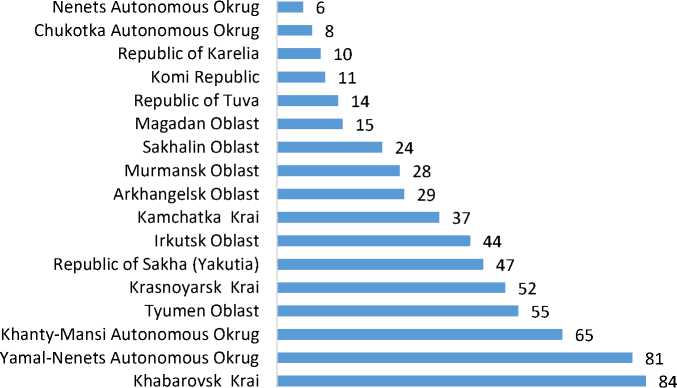
Fig. 4. Rating of FNRF regions according to the sub-index " Socio-economic conditions ".
According to the sub-index "Scientific and technical potential", only 2 regions are above the average for the Russian Federation (0.4305): the Tyumen oblast (0.4888) and the Komi Republic (0.4632), which occupy 11th and 14th places among 85 constituent entities of the Russian Federation (Fig. 5). This fact testifies to the relatively low indicators in the field of personnel training, financing and the effectiveness of research and development in the regions of the FNRF. It should be noted that the Tyumen oblast is in the 4th place among the subjects of the Russian Federation in terms of the volume of funding for science, and the most competitive salary in science is recorded there in terms of the ratio of the average monthly salary of workers engaged in research and development to the average monthly nominal gross salary in the region2.
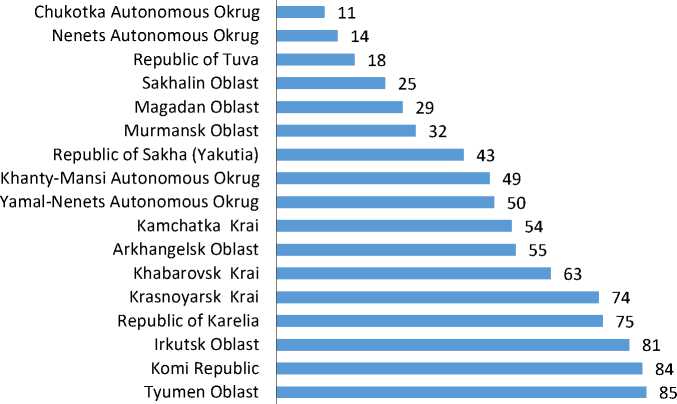
Fig. 5. Rating of FNRF regions according to the sub-index “Scientific and technical potential” .
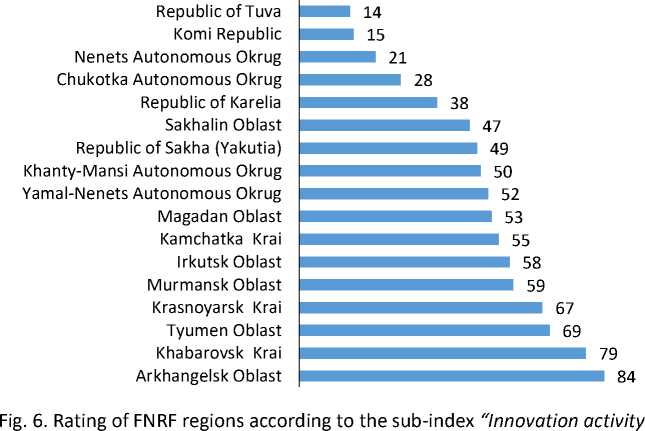
Besides, the regions of the FNRF have low indicators for the sub-index "Innovation activity": only 3 regional leaders are located above the average value of this index in the Russian Federation (0.3096): Arkhangelsk oblast (0.3897), Khabarovsk Krai (0.3853) and Tyumen area (0.3540) (Fig. 6). The leading position of the Arkhangelsk oblast is mainly due to the achievement of high indicators in terms of the effectiveness of innovative activities, and the Khabarovsk Territory — according to the indicator “Costs for technological innovation”.
In the ranking according to the “Export activity” sub-index, the Murmansk Oblast is by far the leader (0.4647), taking the 6th place in the overall rating of the constituent entities of the Russian Federation. The Krasnoyarsk Krai (0.3975), Irkutsk (0.3707), Tyumen (0.3428) and Sakhalin (0.3151) oblasts are also located above the average value of this index in the Russian Federation (0.2935) (Fig. 7). It should be noted that in terms of "Export of goods and services" the Murmansk oblast takes the third position and is included in the TOP-10 successful regions of the first group of regions. The main contribution to its rating success was made by non-resource exports in the field
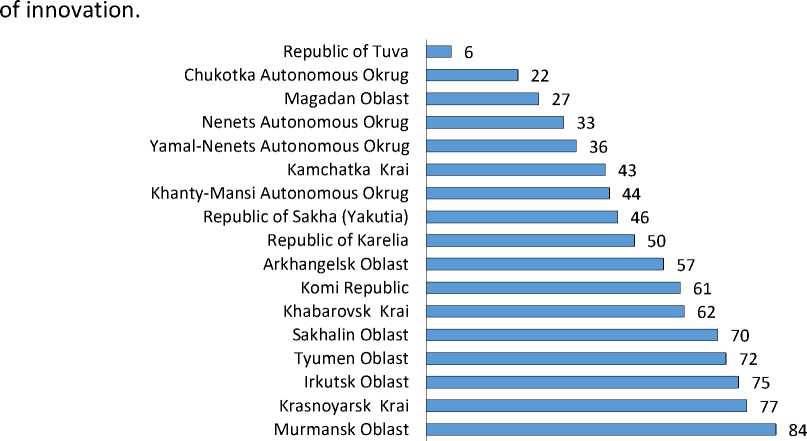
Fig. 7. Rating of FNRF regions according to the sub-index “Export activity” .
The sub-index "Quality of regional innovation policy" comprehensively reflects the positions of the regions in the following parameters: elaboration of legal regulation of innovation activity, the presence of specialized coordinating bodies and development institutions in the field of innovation, the volume of budgetary support for civil science and technological innovation, the involvement of regions in scientific, technical and innovation federal policy. According to this subindex, only Krasnoyarsk (0.49) and Khabarovsk (0.493) krais were included in the list of regions with a value above the average value for the Russian Federation (0.33), which occupy 13 and 18 ranking places, respectively, among 85 constituent entities of the Russian Federation (Fig. 8). Krasnoyarsk Krai is consistently included in the second group of regions for all indicators of the sub-index, and the Khabarovsk Krai — in the first group for the development of regulatory documents in the field of innovation policy and in the second group for its organizational support.
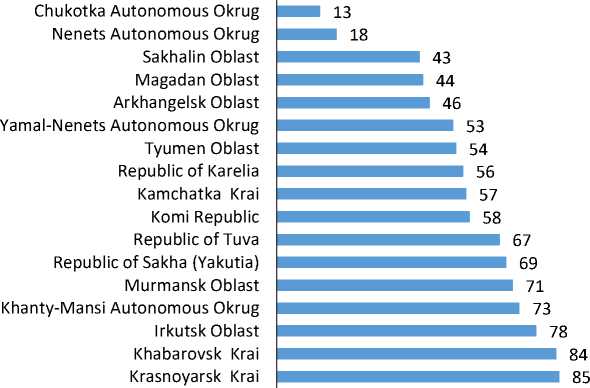
Fig. 8. Rating of FNRF regions according to the sub-index "Quality of regional innovation policy" .
Conclusion
The study showed a significant difference between the regions of the FNRF in terms of the level of innovative development: only 5 regions of the FNRF have the values of the composite innovation index above its average for the Russian Federation. Different positions taken by the regions are also observed in the rankings for individual sub-indices.
In general, conducting such rating assessments of innovative development for each region is very useful and allows assessing the comparative advantages and disadvantages of regions for further consideration in program documents on their innovative development.
Thus, in connection with the existing socio-economic conditions of the regions of the Far North, as well as taking into account the prospects for further development, an increase in the level of innovative development of the region is necessary and possible only when restructuring the entire economic system of these territories on the basis of the widespread introduction of modern innovative technologies (digitalization, augmented reality, Internet and other technologies) in the economic and social sectors
Acknowledgments and funding
The study was carried out within the framework of the state assignment of the Ministry of Education and Science of Russia under the project No. FSRG-2020-0010 “Patterns of spatial organization and spatial development of socio-economic systems of the northern resource-type region”.
References Comparative assessment of innovative development of the Far North regions
- Barinova V.A., Zemtsov S.P. Reytingi innovatsionnogo razvitiya regionov: zachem nuzhna novaya metodika v Rossii? [Rating the Innovative Development of the Russian Regions: Why Does Russia Need a New Method?]. Vestnik Povolzhskogo instituta upravleniya [The Bulletin of the Volga Region Institute of Administration], 2016, no. 6(57), pp. 110–116.
- Belyakova G.Ya., Batukova L.R. Instrumenty otsenki innovatsionnogo razvitiya regiona [Tools for As-sessment of Innovation Development of the Region]. Fundamental'nye issledovaniya [Fundamental research], 2015, no. 2(10), pp. 2190–2193.
- Bortnik I.M., Zinov V.G., Kotsyubinskiy V.A., Sorokina A.V. Indikatory innovatsionnogo razvitiya re-gionov Rossii dlya tseley monitoringa i upravleniya [Indicators of Innovative Development of Russian Regions for the Purposes of Monitoring and Control]. Innovatsii [Innovations], 2013, no. 11, pp. 21–32.
- Droshnev V.V., Droshneva M.D. Sovremennye podkhody k otsenke innovatsionnogo potentsiala re-giona i predpriyatiya [Modern Approaches to Assessing the Innovative Potential of the Region and the Enterprise]. Rossiya: tendentsii i perspektivy razvitiya [Russia: Development Trends and Prospects], 2015, iss. 10, part 1, pp. 75–81.
- Ilyina I.E., Zharova E.N., Agamirova E.V. Kamenskiy A.S. Innovatsionnoe razvitie regionov Rossii [Innova-tive Development of the Regions of Russia]. Regionologiya [Regionology], 2018, vol. 26, no. 2, pp. 230–255. DOI: 10.15507/2413-1407.103.026.201802.230-255
- Lisina A.N. Metodika otsenki urovnya innovatsionnogo razvitiya regiona [Method of Assessment of the Level of Innovation Development of the Region]. Vestnik NGU Seriya: Sotsial'no-ekonomicheskie nauki [Bulletin of NSU. Series: Social and Economic Sciences], 2012, vol. 12, iss. 1, pp. 115–126.
- Makaruk O.E. Kompleksnyy indeks innovatsionnogo razvitiya regionov [The Experience and Problems of Construction Regions' Integrated Index of Innovative Development]. Nauka i innovatsii [Science and Innovation], 2017, no. 1 (167), pp. 38–42.
- Mamaeva Z.M. Otsenka innovatsionnogo razvitiya regionov: ekonometricheskiy podkhod [Evaluation of Innovative Development of the Regions: Econometric Approach]. Vestnik Nizhegorodskogo universi-teta im. N.I. Lobachevskogo [Vestnik of Lobachevsky University of Nizhni Novgorod], 2012, no. 2 (2), pp. 202–208.
- Mityakov S.N., Mityakova O.I., Murashova N.A. Innovatsionnoe razvitie regionov Rossii: metodika reytingovaniya [Innovative Development of the Regions of Russia: Methodology of Rating]. Innovatsii [Innovations], 2017, no. 9, pp. 97–104.
- Egorov N.E. Method of Express Assessment of Innovative Development of Region Based on Triple He-lix Model. AEBMR-Advances in Economics Business and Management Research, 2017, vol. 38, pp. 139–143. DOI: 10.2991/ttiess-17.2017.24
- Egorov N., Pospelova T., Yarygina A., Klochkova E. The Assessment of Innovation Development in the Arctic Regions of Russia Based on the Triple Helix Model. Resources, 2019, no. 8(2), pp. 72. DOI: 10.3390/resources8020072
