Comparative study of certain classifiers for variety classification of certain thin and thick fabric images

Author: Basavaraj S. Anami, Mahantesh C. Elemmi
Journal: International Journal of Image, Graphics and Signal Processing @ijigsp
Article in issue: 1 vol.11, 2019.
Free access
The proposed work gives a comparative study of three different classifiers, namely, decision tree (DT), support vector machine (SVM) and artificial neural network (ANN) for variety classification of certain thin and thick fabric images. The textural features are used in the work. The overall classification rates of 85%, 86% and 94% are obtained for DT, SVM and ANN classifiers respectively. Better results for varieties of thick fabric images are obtained compared to the varieties of thin fabric images. Further, the ANN classifier has given good classification rate than DT and SVM classifiers. But, it is also observed that, DT classifier gives better results in case of varieties of thick fabric images. The work finds applications in apparel industry, cost estimation, setting the washing time, fashion design etc.
Texture features, Fabric images, Feature extraction, Thin fabric, Thick fabric
Short address: https://sciup.org/15016027
IDR: 15016027 | DOI: 10.5815/ijigsp.2019.01.06
Text of the scientific article Comparative study of certain classifiers for variety classification of certain thin and thick fabric images
Published Online January 2019 in MECS
The textile industry plays important role in Indian economy as well as in the international economy and contributes substantially through its export earnings. Nearly, 30% of total Indian export is through textiles. India is the world’s second largest producer of textiles and is next to China. The various forms of textiles are geo-textiles, agro-textiles, medical textiles, green chemistry, etc. India is one of the largest producers of cotton yarn around the globe and also there are good resources of fibers like polyester, silk, jute, denim, wool etc. The different fabric materials have different textures and colors. The type and quality of the fabric material play an important role in apparel industry, fashion designing, etc. Leveraging technology through digital image processing helps in automation of these activities.
The fabric materials can be classified as thin and thick based on their thickness. Thin and thick fabric materials are available from plants, animals, trees, minerals, chemicals etc. Thin and thick fabric images are classified based on the number of warps and wefts per square inch area and is known as thread count. The fabric materials are available with different counts like 30 count, 60 count, 90 count and so on. Increase in the fabric count decreases the thickness of the fabric. We have considered three varieties of thin and thick fabric images. Some images of varieties of thin and thick fabric materials are shown in Fig.1 and Fig.2 respectively.
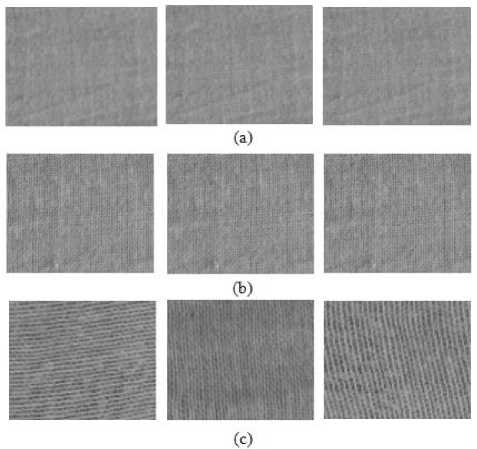
Fig.1. Varieties of thin fabric images, (a) Sample images of Finer thin fabric, (b) Sample images of Medium thin fabric, (c) Sample images of thin fabric.
The work is carried out to classify the fabric images into two types, namely, thin and thick. The thin fabric images are further classified as finer thin, medium thin and thin and the thick fabric images are classified as medium thick, thick and very thick. The texture features are used in the work to classify the given fabric image into appropriate type and variety.
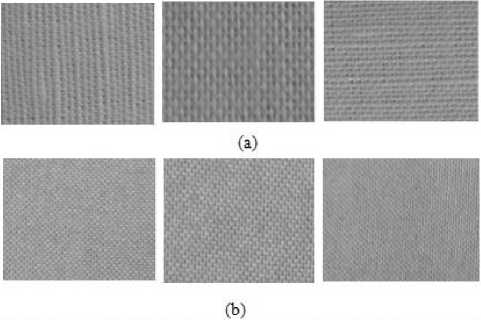
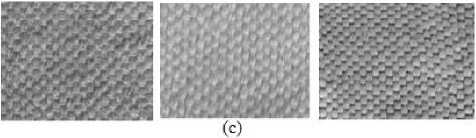
Fig.2. Varieties of thick fabric images, (a) Sample images of medium thick fabric, (b) Sample images of thick fabric, c) Sample images of very thick fabric.
The remaining part of the paper is organized into four sections. Section two contains the literature survey carried out related to the work. Section three contains proposed methodology, texture feature extraction, feature selection, three different approachs to classify the fabric images and results obtained. Section four contains discussion of results obtained using three classifiers. Section five gives the conclusion of the work.
-
II. Related Work
In order to know state-of-the-art research in the area, we have carried out a literature survey and the gist of papers cited during the survey is given as under:
Shinohara and Toshihiro [1] have proposed a method on sstructure analysis of textile fabric that uses automatic extraction of yarn positional information from 3D CT image. A technique is presented to extract the yarn positional information for the structure analysis of a textile fabric from its 3D image non-destructively. The effectiveness of thee proposed method is discussed experimentally by applying to the 3D CT image of a double-layered woven fabric.
Sorensen et al. [2] have presented a paper on texture classification in lung ct using local binary patterns. Local binary patterns (LBP) are used as features in a classification framework for classifying different texture patterns in lung computed tomography. Image intensity is included by means of the joint LBP and intensity histogram,
Basavaraj S. Anami et al. [3] have presented a paper on identification of multiple grain image samples. The work involves a methodology to identify the different grain types from image samples of multiple grains using color and textural features. From images, eighteen colors and twenty-four textural features are extracted. A neural network model is used to identify the bulk food grains.
The work finds application to develop vision based system for grain identification, classification and grading.
Ronghua Ji et al. [4] have presented a paper on classification and identification of foreign fibers in cotton on the basis of a support vector machine. The paper uses the cotton foreign fibers as the research object and acquires the images under simulated actual cotton processing environment. The different classification features are calculated and analyzed. It is observed that, the aspect ratio, roundness and duty cycle are the effective features to classify various foreign fibers.
Guha et al. [5] have presented an approach to measure yarn hairiness by digital image processing. An effort to measure yarn hairiness at high speed, the commercially available yarn hairiness testers resort to indirect techniques is made. Two challenges are considered. The first is development of an algorithm capable of analyzing yarn images taken under varying lighting conditions and varying yarn positions. The second is determination of minimum requirement of the image-capturing instrument.
Wang Xin et al. [6] have presented a paper on fabric texture analysis using computer vision techniques. In this paper, an inexpensive computer vision technique to measure the texture characteristics of woven fabric are proposed. The proposed weave pattern recognition method is validated using computer simulated woven samples and real woven fabric images. From the obtained results, it is shown that, FD FFT parameter is fast and reliable for fabric roughness measurement.
Sun Jingjing et al. [7] presented a paper on fabric wrinkle characterization and classification using modified wavelet coefficients and SVM classifiers”. In the proposed work, a novel method that uses modified wavelet coefficients and optimized SVM classifier classify the wrinkling appearance of fabric is proposed. The effectiveness of this method is tested by selected fabrics that have different fiber contents, weave structures, and laundering cycles. The collected wrinkle parameters provide useful information for textile industries, detergent manufactures etc.
Ren et al. [8] presented a paper on ANN versus SVM that performs better in classification of MCCs in mammogram imaging. In this work, a new method, namely balanced learning with optimized decision making is used to enable effective learning from imbalanced samples. It is found that, even though ANN outperforms SVM, the performance of two classifiers becomes comparable when balanced learning and optimized decision making are used. The work fully validates the effectiveness of proposed method to classify clustered micro calcification successfully.
Zhang et al. [9] have presented a paper on a review of fabric identification based on image analysis technology, which gives a review of the automatic methods used for the identification of woven fabrics. The objective evaluation technology based on image processing and artificial intelligence has the advantages of quick response, digital solution and accuracy, when compared with the manual method based on human eyes and experiences. A brief description of the background of weave pattern recognition and its development based on an overview of many researches done before are given.
Raheja et al. [10] have proposed a method on fabric defect detection based on GLCM and Gabor filter. A new scheme for automated FDDS implementation is presented using GLCM and compared with Gabor filter approach. The generated magnitude responses are compared for defect decision. Both approaches are implemented in same environment. The GLCM approach is found to produce higher defect detection accuracy than Gabor filter approach.
Ngai et al. [11] have proposed a method on ddecision support and intelligent systems in the textile and apparel supply chain. In this article, a comprehensive review of research articles related to the application of decision support and intelligent systems in the textile and apparel supply chains is proposed. The articles are categorized according to their applicability in three basic sectors, namely, textile production, apparel manufacture, and distributionn.
Xianbiao Qi et al. [12] have proposed a work on llocal oorientation adaptive descriptor for texture and material classification. In this paper, a novel local feature, called Local Orientation Adaptive Descriptor (LOAD) is proposed to capture regional texture in an image. The proposed LOAD enjoys the discriminant power to capture the texture information and has strong robustness to illumination variation and image rotation. The result shows that the LOAD is complementary to the learningbased features.
Ilyas et al. [13] presented a paper on content based image retrieval (CBIR) system is based on Frame-let Transform using gray level co-occurrence matrix (GLCM).CBIR technique uses visual contents to search images from large scale image databases. A new method, frame-let transform- Gray level co-occurrence matrix (GLCM) is applied. The obtained results of the methods proposed are compared with conventional methods.
Bhavin V et al. [14] proposed a method on iimproved OCR based automatic vehicle number plate recognition using features trained neural network. In the proposed method, the contour of decisive objects from an image is extracted. Morphological operators are used to empower the method to achieve goal. The proposed method is compared with certain traditional edge detection techniques to ensure its efficiency.
Xiang et al. [15] have presented a paper on visionbased portable yarn density measure method and system for basic single colour woven fabrics. In the proposed work, a vision-based portable yarn density measure system is presented. A discrete Fourier transform is used to compute the density of the woven fabric. The fabric images are collected manually using a smart-phone. The obtained results prove that, the system is robust to meet the fabric requirements in the market.
From the literature survey, it is found that, most of the work is carried out on defect detection, yarn hairiness determination and identification of foreign fibers in fabric materials. The work on application of image analysis technique for textile identification is performed. The features like texture colour and pixel intensities are considered. In fabric materials, identifying the thickness of the image is important for many applications. To mention few, identifying the quality of fabric material, knowing the smoothness and coarseness, online purchase of fabric, cost estimation and the like. Thus, the motivation for the work related to classification of varieties of thin and thick fabric materials.
-
III. Proposed Methodology
The proposed methodology consists of four phases, namely, pre-processing, texture feature extraction, feature selection and classification as shown in Fig.3. Various types of thin and thick fabric images are collected using a digital camera having the resolution of 32 Mega pixels under a constant natural light intensity of 1000 Lux. A constant distance of one foot is maintained while capturing images. Images are collected by visiting garment shops and textile industries. The total number of images of varieties of thin and thick fabric used is given in Table 1.
image
Table 1. Varieties of thin and thick fabric images
|
Fabric type |
Category |
Count |
Total count |
|
Thin |
Finer thin |
80 |
240 |
|
Medium thin |
80 |
||
|
Thin |
80 |
||
|
Thick |
Medium thick |
80 |
240 |
|
Thick |
80 |
||
|
Very thick |
80 |
Pre-processing
Textire
Feature Extraction using GLCM
Feature Selection using FFST
Fig.3. Phases in the proposed methodology
-
A. Pre-processing
The images are scaled to 100×100 from their original size. The contrast stretching is performed to enhance the quality of input image. The fabric image before and after contrast stretching is shown in Fig.4. Yarns are clearly visible after contrast stretching. This gives better feature values in the feature extraction process.
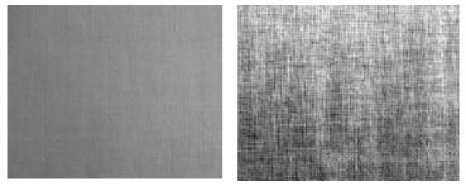
Fig.4. Fabric images before and after contrast stretching
-
B. Texture Feature Extraction
Analysis of fabric image always depends on arrangement, thickness and quality of yarns used in fabric materials. The fineness and coarseness of fabric material depends on thread count. The finer and coarser fabric materials have their own visual characteristic features. The finer fabric has closer finish and the coarser fabric has open finish. The finer fabric has thin yarns and the coarser fabric has thick yarns. The change in thickness of yarns leads to different textural features. Thus textural features are used to identify the type and category of fabric image. The features namely, dissimilarity (F1), entropy (F2), energy (F3), ASM (F4), maximum probability (F5), contrast (F6), correlation (F7) and homogeneity (F8) are extracted. The selected feature values for 10 sample images of thin and thick fabric images are given in Table 2 and Table 3 respectively.
From tables 2 and 3, it is observed that, thin and thick fabric images have different feature values. The dissimilarity, entropy, correlation and ASM values of thin fabric images are larger than thick fabric images. Similarly, the homogeneity and contrast values of thin fabric images are smaller, when compared with thick fabric images. Thus, the unique feature values of thin and thick fabric images will help to classify the type and variety of fabric images.
-
C. Feature Selection
The feature selection is carried out using Forward Feature Selection Technique (FFST). In this technique, we have used hill climbing approach. Initially, a feature (F4) that gives highest classification rate is selected. The selected feature (F4) is paired with the other features to compute the rate.
The feature pair {F4, F6} that gives maximum accuracy is identified. This process of computing classification accuracy is continued till the seven feature vector {F4, F6, F1, F2, F8, F7, F3} is combined with the last left out feature (F5). The classification rates obtained using single and combination of features are given in Table 4.
From Table 4, it is observed that, the feature vector {F1, F2, F4, F6, F7, F8} is found to give better result when compared with the other feature combinations. Also, it is observed that, addition of features F3 and F5 do not increase the classification rate. The classification rate remains constant after the addition of third and fifth features. Hence, the addition of features F3 and F5 is eliminated.
-
D. Classification
Three prediction models namely, decision tree (DT), support vector machine (SVM) and artificial neural network (ANN), are used to predict the type and variety of fabric images. The parameters True Positive (TP), True Negative (TN), False Positive (FP) and False Negative (FN) are used to calculate metrics, namely, precision, recall, F1 Score and accuracy using the equations (1), (2), (3) and (4). [16]
Pr ecision = TP I (TP + FP )
Re call = TP I (TP + FN )
F 1 Score = 2* (Re call * Pr ecision ) I (Re call + Pr ecision )
Accuracy = TP+TN/TP+FP+FN+TN
The metrics values computed to measure the performance. The metrics values of thin and thick fabric images using three classifiers are given in table 5.
-
1) Decision Tree Classifier
Decision tree is a non-parametric supervised learning method used for classification. Initially, a binary split technique is used to classify thin and thick fabric images.
Table 2. Texture feature values of thin fabric images.
|
Sample images |
Dissimilarity |
Entropy |
Correlation |
homogeneity |
ASM |
Contrast |
|
1 |
0.07188 |
0.43304 |
0.00520 |
1.78017 |
0.95080 |
5.80864 |
|
2 |
0.04086 |
0.28903 |
0.00168 |
3.05422 |
0.95901 |
16.3637 |
|
3 |
0.03537 |
0.27384 |
0.00126 |
3.22386 |
0.97472 |
17.9951 |
|
4 |
0.02894 |
0.20263 |
0.00084 |
4.49425 |
0.94272 |
33.2489 |
|
5 |
0.09454 |
0.56035 |
0.00910 |
1.12477 |
0.97309 |
2.46697 |
|
6 |
0.03998 |
0.29054 |
0.00161 |
3.00333 |
0.96213 |
15.6924 |
|
7 |
0.03450 |
0.26471 |
0.00119 |
3.42028 |
0.96425 |
20.6430 |
|
8 |
0.05219 |
0.37851 |
0.00274 |
2.11488 |
0.97496 |
7.90887 |
|
9 |
0.02772 |
0.18246 |
0.00081 |
6.38423 |
0.86289 |
75.3679 |
|
10 |
0.02514 |
0.16441 |
0.00066 |
7.07746 |
0.85386 |
90.3595 |
Table 3. Texture feature values of thick fabric images
|
Sample images |
Dissimilarity |
Entropy |
Correlation |
homogeneity |
ASM |
Contrast |
|
1 |
0.03620 |
0.14963 |
0.00131 |
6.29914 |
0.62120 |
64.70717 |
|
2 |
0.02677 |
0.17282 |
0.00072 |
5.70998 |
0.90096 |
56.84055 |
|
3 |
0.01852 |
0.1118 |
0.00034 |
8.58606 |
0.87619 |
118.8312 |
|
4 |
0.02477 |
0.13045 |
0.00061 |
7.22836 |
0.81031 |
84.45922 |
|
5 |
0.02092 |
0.12445 |
0.00043 |
7.67510 |
0.87479 |
95.75112 |
|
6 |
0.02330 |
0.13482 |
0.00054 |
7.37373 |
0.85112 |
91.96378 |
|
7 |
0.02495 |
0.1926 |
0.00062 |
4.88618 |
0.95420 |
40.52001 |
|
8 |
0.03343 |
0.23824 |
0.00112 |
3.74027 |
0.95878 |
23.67209 |
|
9 |
0.02799 |
0.15892 |
0.00078 |
5.94238 |
0.88010 |
58.67018 |
|
10 |
0.02580 |
0.16041 |
0.00067 |
6.63012 |
0.86406 |
80.16879 |
Table 4. Classification rate with combination of features.
|
Features |
Decision tree |
SVM |
Neural network |
|
F4 |
60.39 |
62.35 |
66.23 |
|
F4+ F6 |
68.23 |
70.5 |
70.19 |
|
F4+ F6+F1 |
72.35 |
72.35 |
74.31 |
|
F4+ F6+F1+F2 |
81.23 |
84.23 |
88.15 |
|
F4+ F6+F1+F2+F8 |
84.31 |
82.35 |
88.39 |
|
F4+ F6+F1+F2+F8+F7 |
84.31 |
86.27 |
94.60 |
|
F4+ F6+F1+F2+F8+F7+F3 |
83.6 |
86.27 |
94.60 |
|
F4+F6+F1+F2+F8+F7+F3+F5 |
83.6 |
85.6 |
94.60 |
Table 5. Precision, Recall, F1 Score and Accuracy values of thin and thick fabric images.
|
Classifier |
Precision |
Recall |
F1 Score |
Accuracy |
||||
|
Thin |
Thick |
Thin |
Thick |
Thin |
Thick |
Thin |
Thick |
|
|
DT |
0.85 |
0.90 |
0.80 |
0.85 |
O.80 |
0.85 |
0.80 |
0.90 |
|
SVM |
0.85 |
0.95 |
0.85 |
0.90 |
0.85 |
0.92 |
0.85 |
0.95 |
|
ANN |
0.90 |
0.96 |
0.94 |
0.96 |
0.90 |
1.00 |
0.94 |
1.00 |
Binary split divides the feature values into two subsets. For example, consider the feature values F i of dissimilarity in both thin and thick fabric images. Most of the feature values of thin fabric images are larger than that of thick fabric images. Similarly, other feature values are different in both thin and thick fabric images. The optimal values of all the features are stored and are used in partitioning. In the second level of classification, a multi-way split is used, that divides the feature values into three partitions. The decision tree with optimal feature values F i is shown in the Fig.5.
Where, i=1….N and N=Number of features.
Decision tree classifier works, based on the probability of occurrence of feature values. Mathematically, it is represented with the help of equation (5). [17]
H = - £ P ( x )log P ( x )
Entropy at given node t can be given with the equation (6). [17]
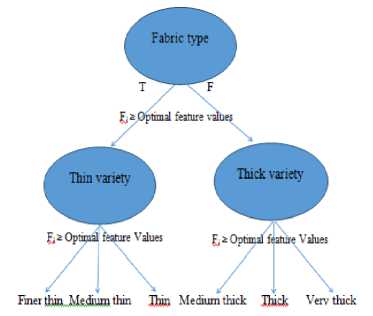
Fig.5. Decision tree based on optimal feature values F i
Entropy ( t ) =- £ P ( j / t) - log 2 P ( j / t) (6)
j
Classification error at node t is calculated using the equation (7). [17]
Error(t ) = 1 - max P(i / 1 ) (7)
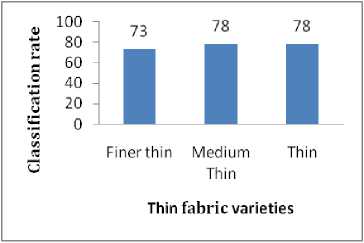
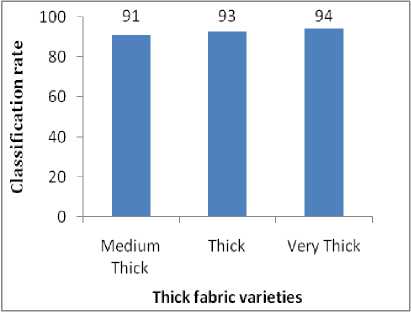
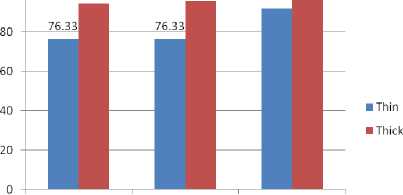
Experiments are conducted using DT classifier and the results are given in this section. A plot of classification rates for thin and thick fabric images is shown in Fig.5. The classification rates of thin and thick fabric images are found to be 76.33% and 94.33% respectively. A plot of classification rates for different varieties of thin and thick fabric images is given in Fig.7 (a) and (b) respectively.
The overall classification rate is found to be 77% and 96%.
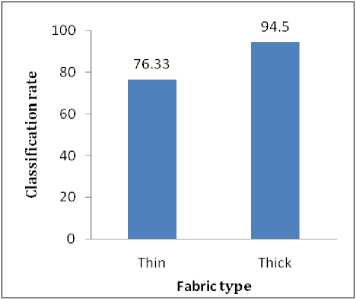
Fig.6. Classification rates of thin and thick fabric images.
(a)
(b)
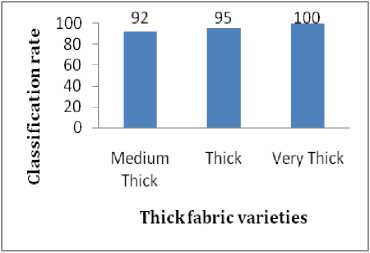
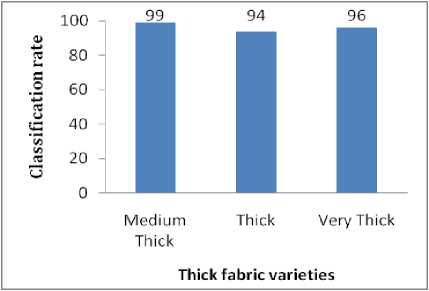
Fig.7. Classification rates (a) Varieties of thin fabric images, (b) Varieties of thick fabric images.
-
2) Support vector machine
We have used support vector machine to separate the feature values of two classes. Given training data (x i , y i ) for i = 1 . . . N, with x i ∈ R d and y i ∈ {-1, 1}, the classifier f(x) that classifies input pattern into suitable class is given by equation (8). [18]
f ( X i ) =
Г> 0 Z =+ 1 ] l< 0 y. =- 1
In general, a SVM classifier can be represented with equation (9). [15]
Л - ( X ) = W T P ( X ) + b
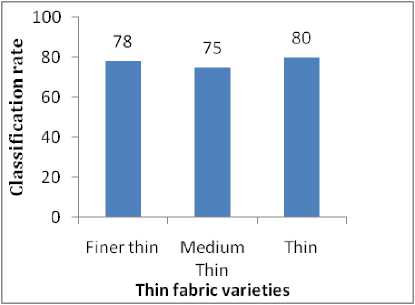
Experiments are conducted using SVM classifier. The classification rates of thin and thick fabric images using SVM classifier are shown in Fig.8. The classification rates of 76.33% and 95.66% are obtained for thin and thick fabric images. The overall classification rates for varieties of thin and thick fabric images are shown in Fig.9 (a) and (b).
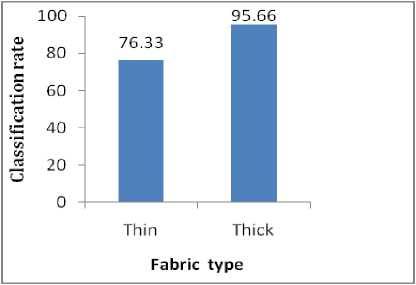
Fig.8. Classification rates of thin and thick fabric images.
(a)
(b)
Fig.9. Classification rates (a) Varieties of thin fabric images, (b) Varieties of thick fabric images.
-
3) ANN based classifier
We have conducted the experiments using ANN classifier with back propagation learning algorithm. Feature vector Xi contains six parameters which are given as input to the ANN. It is applied in two levels. Initially, ANN classifies fabric images into two types as thin and thick. In the next level, thin and thick fabric images are classified into their respective varieties producing three outputs as shown in Fig.1. Three hidden layers containing ten nodes in each layer are used to predict two output targets.The output of a neuron z is determined using equation (10). [8]
z = g(W T X - b ) = g [ f wX i - b |
U1 ) (10)
Using ANN classifier, the classification rates of 92% and 96% are obtained as shown in Fig.10. The overall classification rates for varieties are found to be 88.66% and 96.33% and are shown in Fig.11 (a) and (b).
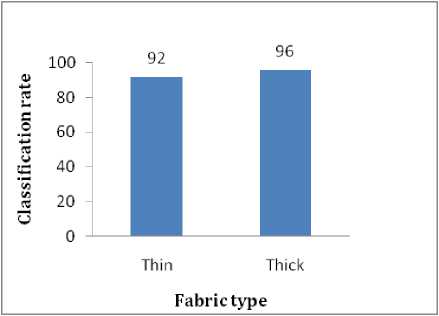
Fig.10. Classification rates of thin and thick fabric images.
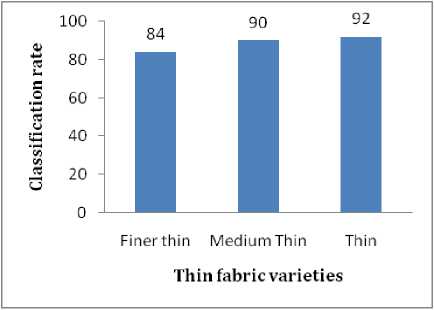
(a)
-
IV. Discussion
The classification rates of thin and thick fabric images using different classifiers are shown in Fig.12. Also, the classification rates of varieties of thin and thick fabric images are shown in Fig.13.
100 - 94.5 95.66 g2 96
DT SVM ANN
Using different classifiers
Fig.12. Classification rates of thin and thick fabric images
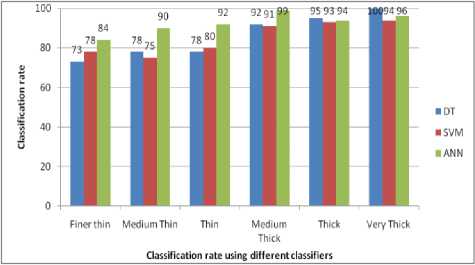
Fig.13.Classification rates of varieties of thin and thick fabric images
It is observed that, the classification rate increases with the increase in the thickness of fabric material. Because, the clarity in the visual appearance increases with increase in thickness of fabric which in turn lead to better textural features. The classification rate of thin fabric images is lesser than thick fabric images in all the prediction models. Decision tree classifier is found to give very good result for thick fabric varieties when compared with results obtained with SVM classifier. Further, it is found that, the ANN prediction model gives better accuracy than DT and SVM prediction models.
(b)
Fig.11. Classification rates (a) Varieties of thin fabric images (b) Varieties of thick fabric images
V. Conclusion
The paper gives comparison of three classifiers in classifying thin and thick fabric images. The ANN classifier gives better results in comparison to other classifiers and the classification rates for thin and thick fabric images are found to be 92% and 96% respectively. The classification rates for varieties of thin and thick fabric images are 89% and 95.7% respectively. It is also observed that, DT classifier is a better classifier in case of thick fabric images. Further, the work finds applications in online purchase of fabric, cost estimation, setting the washing time, temperature setting in ironing box and the like.
References Comparative study of certain classifiers for variety classification of certain thin and thick fabric images
- Shinohara, Toshihiro. "Structure analysis of textile fabric based on automatic extraction of yarn positional information from three-dimensional CT image." In SICE Annual Conference, 2008, pp. 1961-1966. IEEE, 2008.
- Sørensen, Lauge, Saher B. Shaker, and Marleen De Bruijne. "Texture classification in lung CT using local binary patterns." In International Conference on Medical Image Computing and Computer-Assisted Intervention, pp. 934-941. Springer, Berlin, Heidelberg, 2008.
- Anami, Basavaraj S., Dayanand G. Savakar, and Vijay S. Biradar. "Identification of multiple grain image samples from tray." International journal of food science & technology 44, no. 12 (2009): 2452-2458.
- Ji, Ronghua, Daoliang Li, Lairong Chen, and Wenzhu Yang. "Classification and identification of foreign fibers in cotton on the basis of a support vector machine." Mathematical and Computer Modelling 51, no. 11-12 (2010): 1433-1437.
- Guha, Anirban, C. Amarnath, S. Pateria, and R. Mittal. "Measurement of yarn hairiness by digital image processing." The journal of the Textile Institute 101, no. 3 (2010): 214-222.
- Wang, Xin, Nicolas D. Georganas, and Emil M. Petriu. "Fabric texture analysis using computer vision techniques." IEEE transactions on instrumentation and measurement 60, no. 1 (2011): 44-56.
- Sun, Jingjing, Ming Yao, Bugao Xu, and Patricia Bel. "Fabric wrinkle characterization and classification using modified wavelet coefficients and support-vector-machine classifiers." Textile Research Journal 81, no. 9 (2011): 902-913.
- Ren, Jinchang. "ANN vs. SVM: Which one performs better in classification of MCCs in mammogram imaging." Knowledge-Based Systems 26 (2012): 144-153.
- Zhang, Jie, Binjie Xin, and Xiangji Wu. "A review of fabric identification based on image analysis technology." Textiles and Light Industrial Science and Technology (2013).
- Raheja, Jagdish Lal, Sunil Kumar, and Ankit Chaudhary. "Fabric defect detection based on GLCM and Gabor filter: A comparison." Optik-International Journal for Light and Electron Optics 124, no. 23 (2013): 6469-6474.
- Ngai, E. W. T., S. Peng, Paul Alexander, and Karen KL Moon. "Decision support and intelligent systems in the textile and apparel supply chain: An academic review of research articles." Expert Systems with Applications 41, no. 1 (2014): 81-91.
- Qi, Xianbiao, Guoying Zhao, Linlin Shen, Qingquan Li, and Matti Pietikäinen. "LOAD: Local orientation adaptive descriptor for texture and material classification." Neurocomputing 184 (2016): 28-35.
- Ilyas, RN Muhammad, and S. PANNIRSELVAM. "An enhanced technique for texture based image retrieval using framelet transform with GLCM." International journal of Computer Science and Mobile Computing 6, no. 1 (2017): 150-157.
- Kakani, Bhavin V., Divyang Gandhi, and Sagar Jani. "Improved OCR based automatic vehicle number plate recognition using features trained neural network." In 2017 8th International Conference on Computing, Communication and Networking Technologies (ICCCNT), pp. 1-6. IEEE, 2017.
- Xiang, Zhong, Jianfeng Zhang, and Xudong Hu. "Vision-based portable yarn density measure method and system for basic single color woven fabrics." The Journal of The Textile Institute(2018): 1-11.
- blog.exsilio.com/.../accuracy-precision-recall-f1-score-interpretation-of-performance.
- www.cs.kent.edu/~jin/DM07/ClassificationDecisionTree.ppt
- www.robots.ox.ac.uk/~az/lectures/ml/lect2.
