Comparative Study of Different Denoising Filters for Speckle Noise Reduction in Ultrasonic B-Mode Images

Author: Amira A. Mahmoud, S. EL Rabaie, T. E. Taha, O. Zahran, F. E. Abd El-Samie, W. Al-Nauimy
Journal: International Journal of Image, Graphics and Signal Processing(IJIGSP) @ijigsp
Article in issue: 2 vol.5, 2013.
Free access
Image denoising involves processing of the image data to produce a visually high quality image. The denoising algorithms may be classified into two categories, spatial filtering algorithms and transform domain based algorithms. In this paper a comparative study of different denoising filters for speckle noise reduction in ultrasonic b-mode images based on calculating the Peak Signal to Noise Ratio (PSNR) value as a metric is presented. The quantitative results of comparison are tabulated by calculating the PSNR of the output image.
Image enhancement, Ultrasonic scan, Speckle noise, Denoising filters
Short address: https://sciup.org/15012551
IDR: 15012551
Text of the scientific article Comparative Study of Different Denoising Filters for Speckle Noise Reduction in Ultrasonic B-Mode Images
Ultrasound imaging, as a tool for medical diagnosis, is widely used in clinical practice, and in some situation sit has become a standard procedure. Although diagnostic ultrasound is considered a harmless technique and permits real-time and noninvasive anatomical scanning, B-mode images are pervaded by the speckle artifact, which results from destructive interference effects between returning echoes. This artifact introduces fine-false structures whose apparent resolution is beyond the capabilities of the imaging system, reducing image contrast and masking the real boundaries of the tissue under investigation. Its occurrence may substantially compromise the diagnostic effectiveness, introducing a great level of subjectivity in the interpretation of the images. Speckle can be defined as a destructive interference artifact and its severity depends on the relative phase between two overlapping returning echoes. Like other imaging techniques that make use of coherent sources, such as laser or radar, images from ultrasound acoustical waves are prone to speckle corruption that should be removed without affecting the important details in the image [13].
Speckle differs from other types of noise in the sense that it is a deterministic artifact, meaning that two signals or images, acquired under exactly the same circumstances, will experience exactly the same speckle corruption pattern but if some or all of the circumstances differ, the speckle corruption pattern will be different. Speckle texture is usually retained in the high-intensity region [3, 4]. Many algorithms have been developed aiming at speckle reduction in ultrasound data. Although they differ in the way the problem is tackled, they can be divided in two major groups: multiimage and single-image algorithms.
In the first group, the multi-image techniques, typically acquires a set of images from the same region, decorrelating the measurements by changing certain characteristics at each acquisition. For the achievement of high levels of speckle reduction, it is necessary to scan the same region from different angles or positions, which presents practical limitations and may introduce movement artifacts (lack of image alignment). Besides that, the need of multiple acquisitions will reduce the frame rate. Some modern ultrasound scanners do spatial compounding by sweeping the scanned area, and the transducer is kept in the same place. The number of compounded images is typically not very high (from 3 to 9) but, as the final image presents a persistence effect, the operator has to be aware of it when moving the transducer or scanning moving organs, like the heart [1].
The other major group of speckle reduction algorithms, a single image is used in the whole processing, and the output is achieved by processing the backscattered radio-frequency (RF B-mode images). Single image denoising algorithms can be performed either in the transform domain or the spatial domain. Transform domain approaches, transform image from the spatial domain into different domain (Frequency domain, Wavelet domain), and suppress noise into the transform domain. Spatial domain approaches, suppress noise directly in the spatial domain, linear filtering and nonlinear filtering. Each technique has its advantages and disadvantages. In this paper, single image denoising algorithms are discussed. The paper is organized as follows, Section 2, includes classification of ultrasonic images denoising algorithms. Section 3, gives the experimental results, Section 4, shows conclusions followed by the more relevant references.
-
II. CLASSIFICATION OF DENOISING ALGORITHMS
There are two basic approaches to image denoising, spatial filtering methods and transform domain filtering methods as shown below.
-
A. Spatial Filtering
A traditional way to remove noise from image data is to employ spatial filters. Spatial filters can be further classified into linear and non-linear filters.
-
a) Linear Filters
-
1) Gaussian filter
Gaussian filter is a filter whose impulse response is a Gaussian function. Gaussian filters are designed to give no overshoot to a step function input while minimizing the rise and fall time. This behavior is closely connected to the fact that the Gaussian filter has the minimum possible group delay. Mathematically, a Gaussian filter modifies the input image by convolution with a Gaussian function. The Gaussian smoothing operator is a 2-D convolution operator that is used to `blur' images and remove detail and noise. In this sense it is similar to the mean filter, but it uses a different kernel that represents the shape of a Gaussian ('bell-shaped') hump [5].
-
2) Gabor filter
In the spatial domain, a 2D Gabor filter is a Gaussian kernel function modulated by sinusoidal plane waves. The Gabor filters are self-similar; all filters can be generated from one mother wavelet by dilation and rotation:
f x2+y2y'2)
g ( x , y , X , 9 , y , o , у ) = exp l—
V 2^ У x exp i 2n—+^ я
In this equation, λ represents the wavelength of the sinusoidal factor, θ represents the orientation of the normal to the parallel stripes of a Gabor function, ψ is the phase offset, σ is the variance of the Gaussian envelope and γ is the spatial aspect ratio, and specifies the ellipticity of the support of the Gabor function [6- 8].
-
b) Nonlinear Filters
-
1) Median filter
The median filter is a nonlinear digital filtering technique, often used to remove noise. Such noise reduction is a typical pre-processing step to improve the results of later processing (for example, edge detection on an image). Median filtering is very widely used in digital image processing because, under certain conditions, it preserves edges while removing noise. The median of the pixel values in the window is computed, and the center pixel of the window is replaced with the computed median. Median filtering is done by, first sorting all the pixel values from the surrounding neighborhood into numerical order and then replacing the pixel being considered with the middle pixel value [9, 10].
-
2) Homomorphic Filter
Homomorphic filtering involves a nonlinear mapping to a different domain in which linear filter techniques are applied, followed by mapping back to the original domain. It simultaneously normalizes the brightness across an image and increases contrast. Here homomorphic filtering is used to remove multiplicative noise. Homomorphic filter despeckling methods take the advantage of logarithmic transformation, which converts multiplicative noise to additive noise. High boost butter worth filter is used here to reject the resulting additive noise [11-13].
-
3) Speckle Reducing Anisotropic Diffusion (SRAD)
In the case of diffusion filtering the direction and strength of the diffusion are controlled by an edge detection function. It removes speckles and at the same time enhances the edges. It removes speckles by modifying the image via solving a Partial Differential Equation. SRAD is proposed for speckled images without logarithmic compression. Just as lee and frost filters utilize the coefficient of variation in adaptive filtering, SRAD exploits the instantaneous coefficient of variation, which serves as edge detector in speckled images. The function exhibits high values at edges and produces low values in homogeneous regions. Thus it ensures the mean preserving behavior in the homogeneous regions and edge preserving and edge enhancing at the edges [12, 14].
-
B. Transform Domain ( Wavelet Domain)
-
a) Discrete Wavelet Transform
Wavelets are mathematical functions that cut up data into different frequency components, and then study each component with a resolution matched to its scale. They have advantages over traditional Fourier methods in analyzing physical situations where the signal contains discontinuities and sharp spikes.
The idea of the Discrete Wavelet Transform (DWT) is to represent an image as a series of approximations (low pass version) and details (high pass version) at different resolutions. The image is low pass filtered to give an approximation image and high pass filtered to give detail images, which represent the information lost when going from a higher resolution to a lower resolution. Then the wavelet representation is the set of detail coefficients at all resolutions and approximation coefficients at the lowest resolution. Filtering operations in the wavelet domain can be subdivided into linear and nonlinear methods [15- 19].
b) Linear Filtering
-
III. EXPERIMENTAL RESULTS
-
1) Wiener Filter
Wiener filters are a class of optimum linear filters which involve linear estimation of a desired image data sequence from another related sequence. The wiener filtering method requires the information about the spectra of the noise and the original image and it works well only if the underlying signal is smooth. Wiener method implements spatial smoothing and its model complexity control correspond to choosing the window size [5- 8]. Wiener filtering is performed on the wavelet coefficients. In this model it is assumed that the wavelet coefficients are conditionally independent Gaussian random variables. The noise is also modeled as stationary independent zero-mean Gaussian variable [20- 22].
-
c) Nonlinear Filtering
-
1) Log Gabor Filter
Images are better coded by filters that have Gaussian transfer functions when viewed on the logarithmic frequency scale. Gabor functions have Gaussian transfer functions when viewed on the linear frequency scale. On the linear frequency scale the Log-Gabor function has a transfer function of the form [23- 25]:
Computer simulations were carried out using MATLAB (R2007b). The quality of the reconstructed image is specified in terms of the Peak Signal-to-Noise Ratio (PSNR) [26].
PSNR = logw
MSE
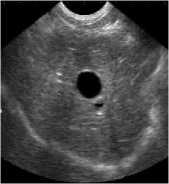
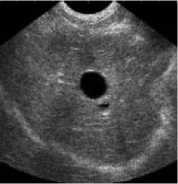
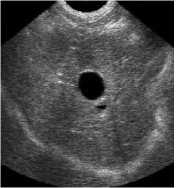
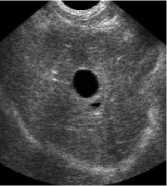
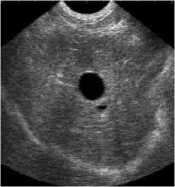
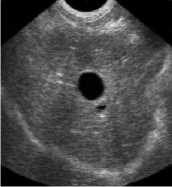
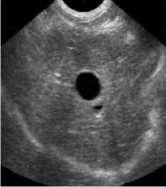
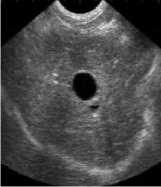
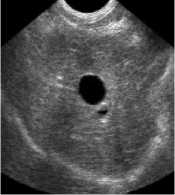
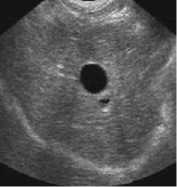
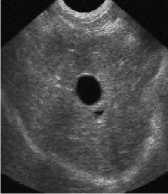
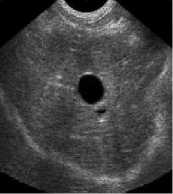
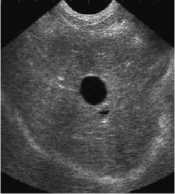
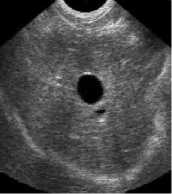
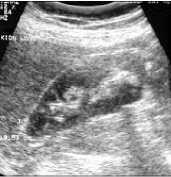
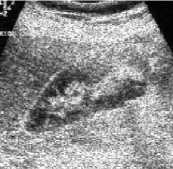
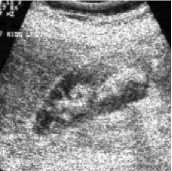
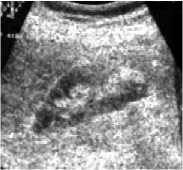
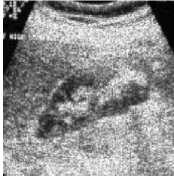
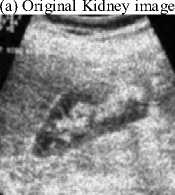
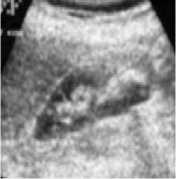
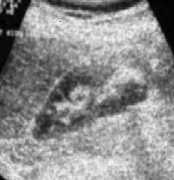
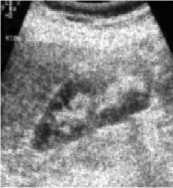
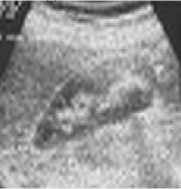
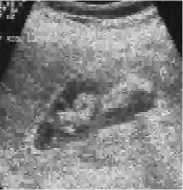
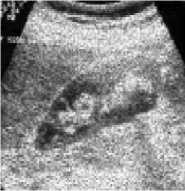
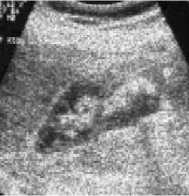
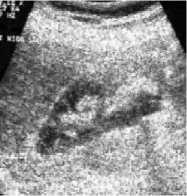
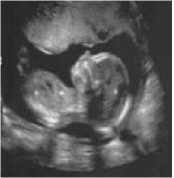
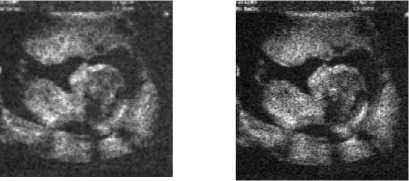
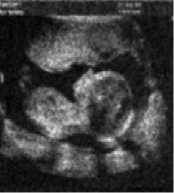
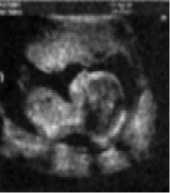
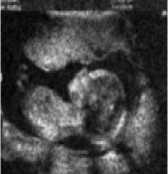
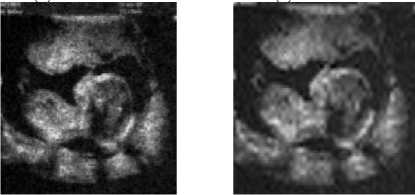
Experimental results are conducted on three ultrasonic B-mode images (Liver, Kidney and Fetus). Figure (1-a) show the original ultrasonic Liver image. Speckle noise with 0.1 variance was added to the image as shown in figure (1-b). The filters performance is shown in figures from (1-c) to (1-n). Figures (2) and (3) show the ultrasonic Kidney and Fetus images. Speckle noise was added to the images with different variances (0.01, 0.05, 0.1 and 0.2) PSNR output values and CPU time for the ultrasonic Liver image are shown in table (1). Table (2) and (3), shows the numerical results of applying the previous mentioned filtering methods to the ultrasonic Kidney and Fetus images.
Results show that the SRAD give the best PSNR value but on the other hand, the CPU time is very high. The Log Gabor filter gives near similar results in less time.
G (to) = e
( - log( to / to o ) 2 /2log( k / to o )2
where ωo is the filter centre frequency.
a) Original Liver image
(b) Noisy Liver image
c) Gaussian filter
d) Median filter
(f) Lee filter
Frost filter
h) Kuan filter
(i) Homo. filter
e) Gabor filter
(j) Visushrink
(k) Sureshrink
(l) Wiener filter
(m) Log Gabor
(n) SRAD
Figure 1. (a) Ultrasonic liver image, (b) noisy image with 0.1 speckle variance, (c) Gaussian filter, (d) Median filter (e) Gabor filter, (f) Lee filter, (g) Frost filter, (h) Kuan filter, (i) Homomorphic filter, (j) Visushrink, (k) Sureshrink, (l) Wiener filter, (m) Log Gabor filter, (n) SRAD filter.
d) Median filter
e) Gabor filter
(b) Noisy Kidney image
c) Gaussian filter
(i) Homo. filter
(j) Visushrink
(f) Lee filter
(k) Sureshrink
(j) Frost filter
(l) Wiener filter
(h) Kuan filter
(m) Log Gabor
(n) SRAD
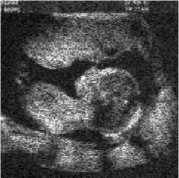
(b) Noisy Fetus image
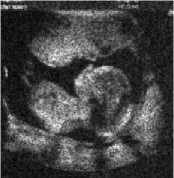
Figure 2. (a) Ultrasonic kidney image, (b) noisy image with 0.1 speckle variance, (c) Gaussian filter, (d) Median filter (e) Gabor filter, (f) Lee filter, (g) Frost filter, (h) Kuan filter, (i) Homomorphic filter, (j) Visushrink, (k) Sureshrink, (l) Wiener filter, (m) Log Gabor filter, (n) SRAD filter.
(a) Original Fetus image
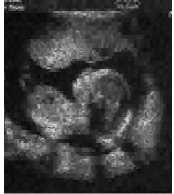
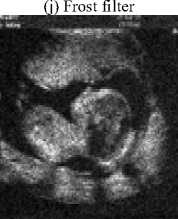
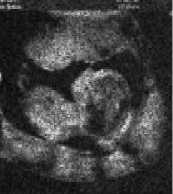
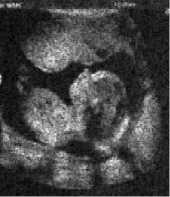
Frost filter
(c) Gaussian filter
(d) Median filter (e) Gabor filter
(i) Homo. Filter (j) Visushrink
(f) Lee filter
(k) Sureshrink
(l) Wiener filter
h) Kuan filter
(m) Log Gabor
(n) SRAD
Figure 3. (a) Ultrasonic Fetus image, (b) noisy image with 0.1 speckle variance, (c) Gaussian filter, (d) Median filter (e) Gabor filter, (f) Lee filter, (g) Frost filter, (h) Kuan filter, (i) Homomorphic filter, (j) Visushrink, (k) Sureshrink, (l) Wiener filter, (m) Log Gabor filter, (n) SRAD filter.
Table 1 Comparison between filters performance for the ultrasonic Liver image
|
The first image (Liver) |
|||||
|
Filters |
Speckle noise variances |
CPU (sec) |
|||
|
0.01 |
0.05 |
0.1 |
0.2 |
||
|
Gaussian |
32.02 |
26.81 |
23.97 |
21.05 |
0.21 |
|
Median |
29.84 |
26.90 |
24.38 |
22.40 |
0.29 |
|
Gabor |
32.08 |
26.06 |
23.33 |
20.69 |
2.45 |
|
Lee |
32.30 |
28.33 |
26.94 |
24.99 |
0.29 |
|
Frost |
27.94 |
27.52 |
26.98 |
25.63 |
54.53 |
|
Kaun |
29.27 |
28.37 |
26.94 |
24.92 |
46.23 |
|
Homomorphic |
29.65 |
27.24 |
26.05 |
24.19 |
1.62 |
|
Visushrink |
29.77 |
28.03 |
26.84 |
25.65 |
1.12 |
|
Sureshrink |
30.08 |
27.30 |
25.60 |
23.21 |
0.75 |
|
Wiener |
30.44 |
27.42 |
25.05 |
22.25 |
1.01 |
|
Log Gabor |
32.07 |
27.77 |
25.31 |
22.84 |
1.39 |
|
SRAD |
32.30 |
28.35 |
24.44 |
20.19 |
86.64 |
Table 2 Comparison between filters performance for the ultrasonic Kidney image
|
The second image (Kidney) |
|||||
|
Filters |
Speckle noise variances |
CPU (sec) |
|||
|
0.01 |
0.05 |
0.1 |
0.2 |
||
|
Gaussian |
27.32 |
21.67 |
17.44 |
16.27 |
0.17 |
|
Median |
23.74 |
21.11 |
19.31 |
17.12 |
0.10 |
|
Gabor |
25.87 |
20.67 |
18.28 |
15.88 |
1.18 |
|
Lee |
23.53 |
22.11 |
20.78 |
18.93 |
0.32 |
|
Frost |
21.62 |
21.10 |
20.31 |
19.00 |
13.40 |
|
Kaun |
22.85 |
21.50 |
20.39 |
18.58 |
8.45 |
|
Homomorphic |
23.57 |
22.14 |
20.64 |
17.85 |
1.37 |
|
Visushrink |
22.97 |
21.66 |
20.05 |
19.01 |
0.85 |
|
Sureshrink |
23.70 |
21.98 |
20.69 |
18.51 |
0.26 |
|
Wiener |
24.01 |
20.87 |
19.11 |
17.10 |
0.12 |
|
Log Gabor |
26.33 |
21.96 |
19.80 |
17.81 |
1.79 |
|
SRAD |
26.33 |
22.81 |
19.46 |
15.83 |
15.70 |
Table 3 Comparison between filters performance for the ultrasonic Fetus image
|
The third image (Fetus) |
|||||
|
Filters |
Speckle noise variances |
CPU (sec) |
|||
|
0.01 |
0.05 |
0.1 |
0.2 |
||
|
Gaussian |
30.37 |
24.76 |
21.95 |
19.24 |
0. 40 |
|
Median |
29.14 |
24.96 |
22.36 |
20.12 |
0.26 |
|
Gabor |
30.30 |
24.27 |
21.69 |
19.16 |
1.56 |
|
Lee |
29.60 |
26.98 |
25.33 |
23.05 |
0.12 |
|
Frost |
26.59 |
25.61 |
24.56 |
23.03 |
9.89 |
|
Kaun |
22.92 |
22.22 |
21.57 |
20.33 |
7.90 |
|
Homomorphic |
26.98 |
22.97 |
19.71 |
17.73 |
0.17 |
|
Visushrink |
30.49 |
27.20 |
25.39 |
23.28 |
0.20 |
|
Sureshrink |
29.83 |
26.08 |
23.62 |
21.89 |
0.75 |
|
Wiener |
30.43 |
25.30 |
22.75 |
20.34 |
0.17 |
|
Log Gabor |
31.30 |
26.01 |
23.38 |
21.25 |
1.56 |
|
SRAD |
32.71 |
26.68 |
22.62 |
18.78 |
15.40 |
Images in figures (1), (2) and (3) and numerical results in tables (1), (2) and (3) show that the Gaussian filter smoothes image and blur edges and Performs poorly with non-Gaussian noise. The median filter performs poorly with speckle noise and is best suited to the impulsive noise. The Gabor filter cannot reduce speckle noise especially at high noise intensities. Lee and Kuan filters perform nearly the same but Kuan filter spends much more time. Frost filter also has a high CPU time and heavily smoothed images. Visushrink smoothes images but sureshrink does not. SRAD filter gives the best image quality results but on the other hand it has much more CPU time and lower PSNR values especially at high speckle noise intensities. The Log Gabor filter gives good images quality, PSNR values and CPU time.
-
IV. CONCLUSIONS
This paper presented a comparative study for speckle reducing filters. Performance of all filters is tested with both synthesized and ultrasound image of liver and Brain. Speckle Reducing Anisotropic Diffusion filter (SRAD) is better than several commonly used filters including Gaussian, Gabor, Lee, Frost, Kuan, Wiener, Median, Visushrink, Sureshrink and also the Homomorphic filter, but on the other hand, the CPU for the SRAD is very high compared to the other filters. The Log Gabor filter gives similar performance of SRAD in less CPU time.
References Comparative Study of Different Denoising Filters for Speckle Noise Reduction in Ultrasonic B-Mode Images
- R. G. Dantas and E.T. Costa, ''Ultrasound speckle reduction using modified gabor filters'', IEEE Trans., Ultrason., Ferroelectr., Freq. Control, vol 54, pp. 530 – 538, 2007.
- O. V. Michailovich and A. Tannenbaum, ''Despeckling of medical ultrasound images'', IEEE Trans. Ultrason., Ferroelectr., Freq. Control, vol 53(1), pp. 64-78, 2006.
- J. R. Sanchez and M. L. Oelze, ''An ultrasonic imaging speckle suppression and contrast enhancement technique by means of frequency compounding and coded excitation'', IEEE Trans. Ultrason. Ferroelectr., Freq. Control, vol. 56, no. 7, 2009.
- Y. Yue, M. M. Croitoru, A. Bidani, J. B. Zwischenberger, and J.W. Clark, ''Nonlinear multiscale wavelet diffusion for speckle suppression and edge enhancement in ultrasound images'', IEEE Trans. Med. Imag., 25(3):297– 311, Mar. 2006.
- Dave Hale, "Recursive gaussian filters", CWP-546, 2006.
- L. Chen, G. Lu and D. Zhang, ''Effects of different gabor filter parameters on image retrieval by texture'', In Proc. of IEEE 10th International Conference on Multi-Media Modelling (MMM2004), pp. 273-278, Brisbane, Australia, Jan. 2004.
- V. Shiv Naga Prasad and Justin Domke, ''Gabor filter visualization'', Technical Report, University of Maryland, 2005.
- J. Cook, V. Chandran and S. Sridharan, ''Multiscale representation for 3-d face recognition'', IEEE Trans. on Information Forensics and Security, 2007.
- S. Perreault, P. Hébert, ''Median filtering in constant time'', IEEE Trans. on Image Processing 16(9): 2389-2394, 2007.
- Y. Mi, X. Li and G. F. Margrave, ''Application of median filtering in Kirchhoff migration of noisy data'', CREWES Research Report, 49, 11, 1999.
- S.Solbo and T. Eltoft, "Homomorphic wavelet based statistical despeckling of SAR images," IEEE Trans. Geosc. Remote Sensing, vol. 42, no. 4, pp. 711–721, 2004.
- R.Vanithamani and G.Umamaheswari, ''Performance Analysis of Filters for Speckle Reduction in Medical Ultrasound Images'', International Journal of Computer Applications 12(6):23–27, December 2010.
- R Sivakumar and D Nedumaran ''Comparative study of Speckle Noise Reduction of Ultrasound B-scan Images in Matrix Laboratory Environment'', International Journal of Computer Applications 10(9):46–50, November 2010.
- Y. Yongjian and S. T. Acton, "Speckle reducing anisotropic diffusion," IEEE Trans. Image Processing, vol. 11, no. 11, pp.1260–1270, Nov. 2002.
- Y. Y. Tang, "Wavelet analysis and its applications", Second International Conference, Springer-Verlag, (U.K.), 2001.
- L. Kaur, S. Gupta, and R. C. Chauhan, ''Image denoising using wavelet thresholding'', Third Conference on Computer Vision, Graphics and Image Processing, India Dec 16-18, 2002.
- A. Bultheel, ''Wavelets with applications in signal and image processing'', Sept., 22, 2003.
- S. Kother Mohideen, S. Arumuga Perumal and M. Mohamed Sathik, ''Image denoising using discrete wavelet transform'', International Journal of Computer Science and Network Security, vol. 8, no. 1, Jan., 2008.
- S. V. Vaseghi, ''Advanced digital signal processing and noise reduction'', 2000 John Wiley & Sons Ltd.
- N. Jacob and A. Martin. "Image denoising in the wavelet domain using wiener filtering", Unpublished course project, University of Wisconsin, Madison, Wisconsin, USA, 2004.
- V. Strela, "Denoising via block wiener filtering in wavelet domain", 3rd European Congress of Mathematics, Barcelona, Birkhäuser Verlag, July 2000.
- H. Choi and R. G. Baraniuk, "Analysis of wavelet domain wiener filters", IEEE Int. Symp. Time-Frequency and Time-Scale Analysis, (Pittsburgh), Oct. 1998.
- R. Zewail, A. Seil, N. Hamdy and M. Saeb,'' Iris identification based on log-gabor filtering'', Proceedings of the IEEE Midwest Symposium on Circuits, Systems & Computers, vol. 1, pp 333- 336, Dec. 2003.
- A. Karargyris, S. Antani and G. Thoma, ''Segmenting anatomy in chest x-rays for tuberculosis screening'', Engineering in Medicine and Biology Society, EMBC, Annual International Conference of the IEEE: 7779-82, Aug. 2011.
- P. Kovesi, "Phase preserving denoising of images", Proc. DICTA 99 (Perth, Australia), pp. 212- 217, 1999.
- Q .Huynh-Thu, M. Ghanbari ,''Scope of validity of PSNR in image/video quality assessment'', Electronics Letters, vol. 44,No.13,pp.800–801, 2008.
