Comparative study on the prediction of symptomatic and climatic based malaria parasite counts using machine learning models
Автор: Opeyemi A. Abisoye, Rasheed G. Jimoh
Журнал: International Journal of Modern Education and Computer Science @ijmecs
Статья в выпуске: 4 vol.10, 2018 года.
Бесплатный доступ
Dynamics of Malaria parasite diagnosis is complex and been widely studied. Research is on-going on the effects of climatic variations on symptomatic malaria infection. Malaria diagnosis can be asymptomatically or symptomatically low, mild and high. An analytical program is needed to detect individual malaria parasite counts from complex network of several infection counts. This study adopted the experimental malaria parasite counts collected from selected hospitals in Minna Metropolis, Niger State, Nigeria and Climatic data collected at the time the experiment was conducted from NECOP, Bosso, FUT Minna, Niger State, Nigeria. One thousand and two hundred (1,200) experimental data were collected and two classifiers Support Vector Machine (SVM), Artificial Neural Network (ANN) do the prediction. Experimental results indicated that SVM produced Accuracy 85.60%, Sensitivity 84.06%, Specificity 86.49%, False Positive Rate(FPr) 0.1351% and False Negative Rate(FNr) 0.1594% than Neural Network model of Accuracy 48.33%, Sensitivity 60.61%, Specificity 45.48%, low False Positive Rate (FPr) 0.5442% and False Negative Rate(FNr) 0.3939% as depicted in their respective confusion matrix.
Malaria, Prediction, Artificial Neural Network (ANN), Support Vector Machine (SVM), Symptomatic, Climatic
Короткий адрес: https://sciup.org/15016751
IDR: 15016751 | DOI: 10.5815/ijmecs.2018.04.03
Текст научной статьи Comparative study on the prediction of symptomatic and climatic based malaria parasite counts using machine learning models
Published Online April 2018 in MECS DOI: 10.5815/ijmecs.2018.04.03
Malaria is caused by a parasite known as Plasmodium spp being transmitted by an Anopheles mosquito [1]. The parasites invade the blood and causes adverse effect on the blood cells. Within 48 to 72 hours the parasites multiply inside the red blood cells and break open, infecting more red blood cells. The first symptoms usually occur between 10-14 days to 4 weeks after infection [2]. Malaria parasites can also be transmitted from a mother to her unborn baby (congenitally), by blood transfusions and by sharing needles used to inject drugs [3]. Malaria infection has a vast outbreak especially in tropical regions: an upsurge in the rate of avoidable deaths as well as an exponential increase in the population [4]. In some part of the world, malaria parasites have developed resistance to insecticides and antibiotics [5].
Likewise, malaria researchers are pursuing a vaccine and methods that would curb the disease for good [6].
Diagnosing asymptomatic malaria transmission is not straightforward due to the obvious lack of clinical manifestations and often sub-patient levels of parasites are undetectable by microscopy [7]. Prediction of the symptomatic nature of malaria parasite counts combined with effects of climatic conditions is also needed to enhance the diagnosis. The presence of both symptomatic and asymptomatic diagnostic measure is very vital in detecting the transmission dynamics of malaria infection. To avoid the occurrence of new malaria outbreaks in both endemic and non-endemic areas, an improve methods are needed to decrease the parasite sources of infection by active prediction and treatment of symptomatic and asymptomatic parasite carriers.
There is a huge amount of data which is hard to understand and to interpret by humans difficulty arises; a typical example is malarial incidences [8]. So the need for a machine learning method arises. Such a machine processes the data and automatically finds structures in the data, i.e. learns. The knowledge about the extracted structure can be used to solve the problem at hand. Problems being solved by machine learning methods range from classifying observations, predicting values, structuring data (e.g. clustering), compressing data, visualizing data, filtering data, selecting relevant components from data, extracting dependencies between data components, modeling the data generating systems, constructing noise models for the observed data, integrating data from different sensors, using classification and drawing inferences[9]. Thus, machine learning focuses on prediction based on known properties learned from the trained data sets [10].
-
II. Related Works
The prediction approaches ranges from statistical modeling, mathematical modeling and machine learning methods [11]. Mathematical, statistical and computational engineering models are playing a most vital role in predictions and for helping make decisions.
Recently, machine learning (ML) is used in medical science to check health condition [12-14] and diagnose several diseases such as cancer [15-16].
In pharmacology ML find the right formula and reliable drugs to incapacitate a disease virus [17, 18]. ML is also used to choose the effective therapeutic treatment [19]. Also ML can also be used in agriculture to increase agricultural production as with predicting pest plants [20]. In the business world ML is used to predict the stock market and stock price index movement [21].
Malaria prediction is now being conducted in many countries and typically uses data on environmental risk factors, such as climatic conditions, to forecast malaria incidence for a specific geographic area over a certain period of time [22].
An Automatic Diagnosis of Malaria Parasites using Neural Network and Support Vector machine was proposed in 2015. Since mistakes are inevitable in manual counting diagnosis and time consuming we need to develop an image processing algorithm to automate diagnosis of malaria on thin blood smears. Morphological and novel threshold selection technique can be used to identify the parasites on microscopic slides. Behavioural image features such as colour, texture and the geometry of the cells and parasite was generated. Image processing was used to identify malaria parasite with the use of Phase of Image, Mean of Greenplane, Skewness, Kurtosis, standard deviations and energy. ANN classifier gives an accuracy of 80% for affected and 77% for not affected and SVM gives an accuracy of 90% for affected and 100% for not affected. But the researchers were unaware that the performance of a classifier depends on the domain under discussion. The research focuses on asymptomatic image processing. It does not give considerations to effects of symptomatic and climatic conditions [23].
An Automatic Detection of malaria parasites for estimating parasitemia was proposed in 2015. The motivation of the research was that most of the conventional microscopy used in diagnosis of diseases is occasionally proving in efficient and results are difficult to reproduce. Three (3) classifiers SVM, Naïve Bayes and Neural network classifier and two feature extraction techniques Discrete Wavelength Transform (DWT) and
Gray-Level Co-Occurrence Matrix (GLCM) were used. The system obtained 100% accuracy of disease detection with the use of SVM classifier and 92.85% accuracy with Naïve Bayes. An accuracy of 92% and 85.41% were obtained when DWT and GLCM Feature Extraction method were used respectively with Neural Network. The methods made use of the morphological, colour and texture features of Plasmodium parasites and erythrocytes not given considerations to symptomatic nature and climatic effects [24].
Malaria Outbreak Prediction Model Using Machine Learning was proposed in 2015. Early prediction of a Malaria outbreak is the key for control of malaria morbidity. This will help various health organizations to better target medical resources to areas of greatest need. Two popular data mining classification algorithms Support Vector Machine (SVM) and Artificial Neural Network (ANN) are used for Malaria Prediction. Parameters used are average monthly rainfall, temperature, humidity, total number of positive cases, total number of Plasmodium Falciparum cases and outbreak occur in binary values Yes or No. The SVM model can predict the outbreak 15 -20 days in advance. The accuracy of the prediction needs to be improved on by using more training data Also, in the model the individual positive cases needed to be considered not total number of positive cases as one of the training and testing features [25].
Applying different predicting methods to the same data, exploring the predictive ability of environmental and non-environmental variables, including transmission reducing interventions and using common forecast accuracy measures will allow malaria researchers to compare and improve models and methods, which should improve the quality of malaria prediction [26].
-
III. Materials And Methods
A total of one thousand and two (1,200), sampled hospitals patients laboratory experimental data were collected together with their symptomatic characteristics. Also climatic data of the respective sample data timing from NECOP weather station, FUT Minna were also collected. These all served as input variable to the network. The data was pre-processed with wrapper method and several normalization method of min-max, standardization, divide by maximum were tested. But divide by maximum gave the optimum result for the preprocessing.
-
A. Methodology
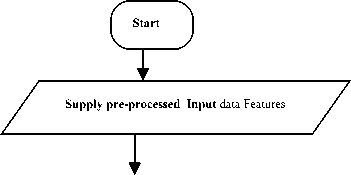
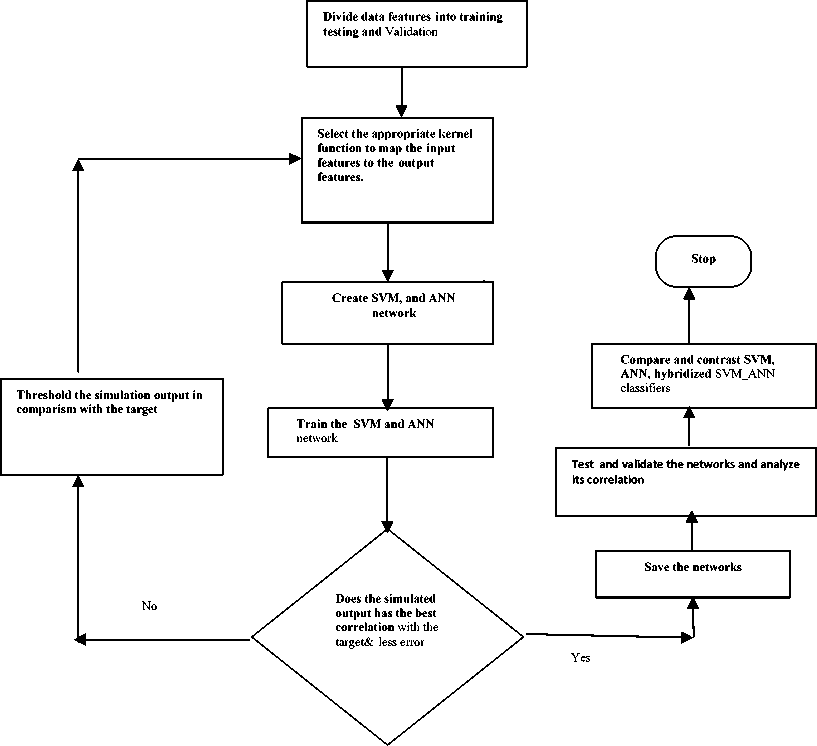
The objective of this paper is to analyse and compare the performance of the two classifiers Support Vector Machine and Artificial Neural Network. The Performance of the classifiers are evaluated with accuracy, sensitivity, specificity, false postive rate(FPr ) and false negative rate(FNr). Here is the proposed general methodology as depicted in the framework in Figure 1. The framework consists of these eight(8) phases: (i) Preprocessed the data features (ii)Perform hold out cross validation by dividing the data features into training, testing and validation (iii)Create the SVM and ANN classifiers network (iv) train SVM, ANN classifiers network (v)save the best classifiers network (vi)Test and validate the networks with testing and validation features (vii) Compare the results of the SVM and ANN classifiers network (iix.) Get the best classifier


Fig.1. Framework of the Comparison of SVM and ANN classifiers for Malaria Parasite Counts Prediction
-
B. Features Preprocessing
In this research features with missing data are assigned zero. A typical example is the rainfall data features. In order to standardize the range of independent variables or data features, feature scaling in equation (1) and unitary method in equation (2) were used and the binary encoding threat classes are represented in Table 1.
-
a. Feature Scaling
x x'= i xx i (1)
-
b. Unitary Method/Divide by maximum
It involves dividing the column or curve by the dataset maximum value.
x x' = xmax (2)
where x is an original value, and x ' x ' is the normalized value.
Table 1. Multiclass Encoding Threat Severity
|
Malaria parasite |
Malaria parasite |
Output for |
|
Count Multiclass |
Count Binary- |
Qualitative |
|
Output(class) |
class Output |
Computation (OPT1) |
|
Insignificant (0) { } |
Insignificant (0) { } |
0 |
|
Significant(1) + |
Significant(1 and above ) ≥ + |
1 |
Highly 2
Significant(2)++
Machine (SVM), and Artificial Neural Network(ANN) classifiers were used to classify the malaria parasite counts. SVM is a binary classifier while ANN is multiclass classifier. Since malaria parasites counts exist in multiclass nature we introduce one-against-all algorithm to SVM to serve as Multiclass classifier. Pureline, Logsig and Tansig activation functions were employed with ANN to map the input signals from input nodes to the hidden layer and produce output at the output layer of the network. Also, linear, radial basis and polynomial kernel function were employed to transfer input features to the network and get appropriate results.
IV. Experimental Results
C. Features Description
Table 2 represents the feature description of the model. The model used the wrapper method of filtering to select appropriate features. Thus this research features is thus restricted to five(5) predominant malarial symptoms Headache (H d ), Fever (F v ), Dizziness (D z ), Body Pain (B p ) ,Vomiting (V m ) and two (3) significant climatic factors that contributes to having malaria; Temperature (Temp), Relative humidity (Rh) and Rainfall (Rf).
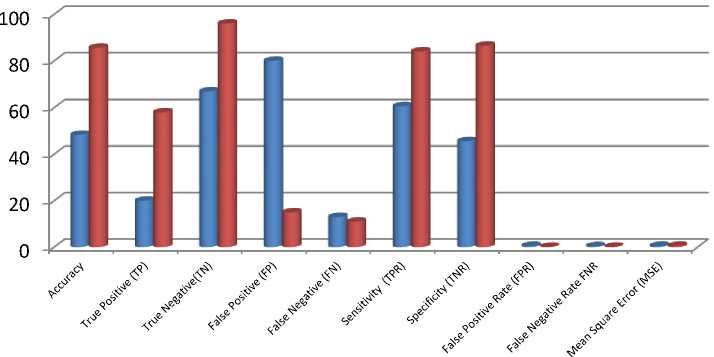
The performance of the models were analysed using the performance metrics of accuracy, sensitivity, specificity, false positives and false negatives in equations (3-6). The result is depicted in Table 3 and Figure 2 showing Artificial Neural Network_Class 0 (ANN_0) with feed forward and back-propagation algorithm produced optimal 48.33% accuracy, 60.61% Sensitivity and 45.58% Specificity, FPR 0.5442% and FNR 0.3939% . Also Support Vector Machine Class_2 (SVM_2) generates optimal 85.60 % accuracy, 84.06% Sensitivity and 86.49% Specificity, FPR 0.1351%, FNR 0.15945%.).
Accuracy =
Correct Classif ed Patterns Total Patterns
Table 2. Features Description
Input Variable
Description(Malaria Demographic)
|
Age |
Adult (1) Children(2) |
|
Gender |
Male(1) Female(2) |
|
Headache(H d ) |
+ve(1) -ve(0) |
|
Fever(F v ) |
+ve(1) -ve(0) |
|
Dizziness(D z ) |
+ve(1) -ve(0) |
|
Body Pain(B p ) |
+ve(1) -ve(0) |
|
Vomitting(V m ) |
+ve(1) -ve(0) |
|
Temperature(T emp ) |
{0≤ T emp ≤ 32.83} |
|
Relative Humidity(R h ) |
{0≤ R h ≤ 83.74} |
|
Rainfall(R f ) |
{0≤ R f ≤ 0.034} |
T P+T N
TP+TN+FP+FN
* 100
Sensitivity(Recall) =
True Positives * 100 _ TP *
True Positives+False Negative TP+FN
Specificity =
True Negatives inn
------------------------* 100 =
True Negatives+False Positives
TN
-----* 100
TN+FP
False Positive Rate(FPR): = = 1-Specificity
FP
-^—1 100
TN+FP
D. Feature Classification Techniques
Table 1 represents the multiclass encoding threat classification of malaria parasite counts. Support Vector
False Negative Rate(FNR): = ™ * 100
TP+FN
= 1- Sensitivity
Table 3. ANN and SVM Classifier Performance
|
я 8 g о |
< |
> t: 5 о 5 ад я ^1 со <^ |
V ад ад 2 |
о ад Р ад 5 е |
2 н 2 |
о р^ |
ад 4) z | S' |
со О |
£ р< |
ад 4) Рн £ р< |
^й |
о Р- |
ад 4) Z |
||
|
ое |
о |
6 |
о |
о |
ое |
о |
о |
О |
m |
о |
|||||
|
s' > со |
о |
ое |
р |
о |
о |
о |
$ |
о |

■ ANN_0
■ SVM_2
Fig.2. ANN_0 and SVM_2 Malaria Model Classifier Performance
Confusion Matrix
|
20 11.11% |
13 7.22% |
60.61% 39.39% |
|
80 |
67 |
45.58% |
|
44.44% |
37.22% |
54.42% |
|
20.0% |
16.23% |
48.33% |
|
80.0% |
83.75% |
51.67% |
1 0
Target Class
Fig.3. ANN_0 Results
From Confusion Matrix in Fig.3 ANN_0 Result twenty (20) cases of Class_0 infected are correctly classified as positive. This corresponds to 11.11% of all one hundred and eighty (180) malaria cases. Similarly, sixty seven (67) cases of Class_1 and Class_2 non infected are correctly classified as negative. This corresponds to 37.22% of all malaria cases. Also, thirteen (13) cases of Class_1 and Class_2non infected cases which correspond to 7.22% are incorrectly classified as negative. Similarly, eighty (80) cases of
Class_0 infected cases are incorrectly classified as positive. This corresponds to 44.44% of all malaria cases.
Out of thirty three (33) infected cases, twenty (20) were correctly classified. This corresponds to 60.61% correctly classified while thirteen (13) cases which correspond to 39.39% were wrongly classified. Similarly, out of one hundred and forty seven (147) non infected cases only sixty seven(67) cases which corresponds to 45.58% were correctly classified as noninfected cases while eighty (80) which corresponds to 54.42% were incorrectly classified.
Confusion Matrix
|
58 (32.22% ) |
11 (6.11%) |
84.06% 15.94% |
|
15 (8.33%) |
96 (53.33%) |
86.49% 13.51% |
|
79.45% 20.55% |
89.72% 10.28 % |
85.60% 14.40% |
1 0
Target Class
Fig.4. SVM_2 (rbf)
From Confusion Matrix in Fig.4 SVM_2 Result fifty eight (58) cases of Class_2 infected are correctly classified as positive. This corresponds to 32.22% of all one hundred and eighty (180) malaria cases. Similarly, ninety six (96) cases of Class_0 and Class_1 non infected are correctly classified as negative. This corresponds to 53.33% of all malaria cases. Also, eleven (11) cases of Class_0 and Class_1 non infected cases which correspond to 6.11% are incorrectly classified as negative. Similarly, fifteen (15) cases of Class_2 infected cases are incorrectly classified as positive. This corresponds to 8.33% of all malaria cases.
Out of sixty nine (69) infected cases, fifty eight (58) were correctly classified. This corresponds to 84.06% correctly classified while eleven (11) cases which correspond to 15.94% were wrongly classified. Similarly, out of one hundred and eleven(111) non infected cases only ninety six(96) cases which corresponds to 86.49% were correctly classified as noninfected cases while fifteen(15) which corresponds to 86.49% were incorrectly classified.
-
V. Comparative Analysis
From Table 4, the performance of the two classifiers ANN and SVM, the following comparative differences were made:
Table 4. Performance of ANN and SVM
Methodology
Strength
Weaknesses
|
SVM |
v |
Handles Bivariate prediction, pattern |
V |
Handles only binary prediction, pattern |
|
recognition, feature selection and |
recognition, classification, and |
|||
|
classification |
regression analysis |
|||
|
V |
Handles small and large dataset well |
V |
It needs a ‘ good ’ kernel function. |
|
|
V |
Uses predefined activation function |
V |
Choosing appropriately hyper |
|
|
V |
Solves the problems of over-fitting by |
parameters that will allow for sufficient |
||
|
optimizing the model parameters to feature |
generalization performance |
|||
|
selection |
|
ANN |
V V |
It does create network to have hidden neurons Handle Multivariate prediction, pattern recognition, classification, regression analysis. |
V V |
No general framework to design most suited network for particular problems Threshold frequency, number of hidden layers and hidden neurons are searched in the network by trial and error |
|
V |
Uses predefined activation function |
V |
Greater computational burden because |
|
|
V |
Requiring less formal statistical training |
large parameters are needed to fit a |
||
|
V |
good network structure |
|||
|
V |
Prone to local minima |
|||
|
V |
Over fitting often occurs because of |
|||
|
large data to fix. |
-
VI. Conclusion
In this paper, the prediction of symptomatic and climatic based malaria infection was conducted with Artificial neural Network (ANN) and Support Vector Machine (SVM). The performance evaluation of the developed ANN and SVM Malaria model was evaluated based on the threshold metrics; accuracy, sensitivity, specificity, false positive and false negative metrics sighted in Section 3. The models were comparatively evaluated as shown in Table 3 and Figure 3. ANN performance was relatively low with 48.33% irrespective of applications of different activation functions of purelin, logsig and tansig. Linear, radial basis function and polynomial kernel functions were also employed in Support Vector Machine (SVM). But performance of SVM with radial Basis function produced good results of 85.60%. Therefore, Support vector machine can be employed by medical practitioners to predict the level of severity of an infected patient. Further research can focus on improving the performance of the model possibly with hybridized models.
Список литературы Comparative study on the prediction of symptomatic and climatic based malaria parasite counts using machine learning models
- Mueller, I., Galinski, M. R., Baird, J.K., Carlton, J. M., Kochar, D. K., Alonso, P. L., & del Portillo, H. A. (2009). Key gaps in the knowledge of Plasmodium vivax, a neglected human malaria parasite. The Lancet infectious diseases, 9(9), 555-566.
- Bannister, L., & Mitchell, G. (2003). The ins, outs and roundabouts of malaria. Trends in parasitology, 19(5), 209-213.
- Singh, S. (2006). New developments in diagnosis of leishmaniasis. Indian Journal of Medical Research, 123(3), 311.
- Olaronke, I., & Oluwaseun, O. (2016). An Ontology Based Remote Patient Monitoring Framework for Nigerian Healthcare System. International Journal of Modern Education and Computer Science, (IJMECS), 8(10), 17.
- White, N. J. (2004). Antimalarial drug resistance. Journal of clinical investigation, 113(8), 1084.
- Cherif, A. H., Movahedzadeh, F., Michel, L., Hill, A., & Jedlicka, D. M.(2011) Environmental Release of Genetically Engineered Mosquitoes
- Bottius, E., Guanzirolli, A., Trape, J. F., Rogier, C., Konate, L., & Druilhe, P. (1996). Malaria: even more chronic in nature than previously thought; evidence for subpatent parasitaemia detectable by the polymerase chain reaction. Transactions of the Royal Society of Tropical Medicine and Hygiene, 90(1), 15-19.
- Keeling, M. J., & Rohani, P. (2008). Modeling infectious diseases in humans and animals. Princeton University Press
- Ahmad, Munir, and Shabib Aftab. "International Journal of Modern Education and Computer Science (IJMECS)." (2017).
- Nilsson, N. J. (1998). Artificial intelligence: a new synthesis. Morgan Kaufmann.
- K., Kigozi, R., Charland, K., Dorsey, G., Kamya, M., & Buckeridge, D. (2013). Predicting Malaria in a Highly Endemic Country using Environmental and Clinical Data Sources. Online journal of public health informatics, 6(1).
- Paokanta, P., Ceccarelli, M., & Srichairatanakoo, S. (2010, November). The efficiency of data types for classification performance of Machine Learning Techniques for screening β-Thalassemia. In Applied Sciences in Biomedical and Communication Technologies (ISABEL), 2010 3rd International Symposium of Applied Sciences in Biomedical and Communication Techn. (pp. 1-4)
- Martínez-Martínez, J. M., Escandell-Montero, P., Barbieri, C., Soria-Olivas, E., Mari, F., Martínez-Sober, M., ...& Gatti, E. (2014). Prediction of the hemoglobin level in hemodialysis patients using machine learning techniques.Computer methods and programs in biomedicine, 117(2), 208-217.
- GÜL, S., UÇAR, M. K., ÇETİNEL, G., BERGİL, E., & BOZKURT, M. R. (2017). Automated Pre-Seizure Detection for Epileptic Patients Using Machine Learning Methods. International Journal of Image, Graphics & Signal Processing, 9(7).
- Kourou, K., Exarchos, T. P., Exarchos, K. P., Karamouzis, M. V., & Fotiadis, D. I. (2015).Machine learning applications in cancer prognosis and prediction. Computational and structural biotechnology journal, 13, 8-17.
- Asadi, H., Dowling, R., Yan, B., & Mitchell, P. (2014).Machine learning for outcome prediction of acute ischemic stroke post intra-arterial therapy. PloS one, 9(2), e88225.
- Danger, R., Segura-Bedmar, I., Martínez, P., & Rosso, P. (2010).A comparison of machine learning techniques for detection of drug target articles. Journal of biomedical informatics, 43(6), 902-913.
- Urquiza, J. M., Rojas, I., Pomares, H., Herrera, J., Florido, J. P., Valenzuela, O., & Cepero, M. (2012).Using machine learning techniques and genomic/proteomic information from known databases for defining relevant features for PPI classification. Computers in biology and medicine, 42(6), 639-650.
- Caravaca Moreno, J., Soria Olivas, E., Bataller Mompeán, M., Serrano López, A. J., Such Miquel, L., Vila Francés, J., & Guerrero Martínez, J. F. (2014). Application of machine learning techniques to analyse the effects of physical exercise in ventricular fibrillation. Computers in Biology and Medicine, 2014, vol. 45, num. 1, p. 1-7.
- Worner, S. P., & Gevrey, M. (2006). Modeling global insect pest species assemblages to determine risk of invasion. Journal of Applied Ecology, 43(5), 858-867.
- Patel, J., Shah, S., Thakkar, P., & Kotecha, K. (2015). Predicting stock and stock price index movement using trend deterministic data preparation and machine learning techniques. Expert Systems with Applications, 42(1), 259-268.
- Zinszer, K., Kigozi, R., Charland, K., Dorsey, G., Kamya, M., & Buckeridge, D. (2013). Predicting Malaria in a Highly Endemic Country using Environmental and Clinical Data Sources. Online journal of public health informatics, 6(1).
- Shruti A. & Shirgan S.S (2015). Automatic Diagnosis of Malaria Parasites Using Neural Network and Support Vector Machine., International Journal of Advanced Foundation in Computer(IJAFRC), 2, 62 -65.
- Chaudhari, t., & Agrawal, (2015). The Automatic Detection of Malaria Parasites for Estimating Parasitemia.
- Sharma, V., Kumar, A., Lakshmi Panat, D., & Karajkhede, G. (2015). Malaria Outbreak Prediction Model Using Machine Learning. International Journal of Advanced Research in Computer Engineering & Technology (IJARCET) 4(12),
- Abisoye, Opeyemi A & Jimoh Gbenga R.(2017). Symptomatic and Climatic Based Malaria Threat Detection Using Multilevel Thresholding FeedForward Neural Network. I.J. Information Technology and Computer Science, 8, 40-46


