Comparing Nonsubsampled Wavelet, Contourlet and Shearlet Transforms for Ultrasound Image Despeckling

Author: Sedigheh Ghofrani
Journal: International Journal of Image, Graphics and Signal Processing(IJIGSP) @ijigsp
Article in issue: 2 vol.7, 2015.
Free access
Ultrasound images suffer of multiplicative noise named speckle. Bayesian shrinkage in transform domain is a well-known method based on finding threshold value to suppress the speckle noise. The main problem of applying Bayesian shrinkage is finding the optimum threshold value in appropriate transform domain. In this paper, we compare the performance of adaptive Bayesian thresholding when nonsubsampled Wavelet, Contourlet and Shearlet transforms are used. We processed two synthetic test images and three original ultrasound images as well to demonstrate the efficiency of the designed filters. In order to compare the performance of Bayesian shrinkage when employing the three mentioned transform domain, we used peak signal to noise ratio (PSNR), mean square error (MSE), and structural similarity (SSIM) as the full-reference (FR) objective criteria parameters and noise variance (NV), mean square difference (MSD), and equivalent number of looks (ENL) as the no-reference (NR) objective criteria parameters.
Nonsubsampled Wavelet, nonsubsampled Contourlet, nonsubsampled Shearlet, ultrasound image despeckling, Bayesian thresholding
Short address: https://sciup.org/15013524
IDR: 15013524
Text of the scientific article Comparing Nonsubsampled Wavelet, Contourlet and Shearlet Transforms for Ultrasound Image Despeckling
Published Online January 2015 in MECS
For any coherent imaging like ultrasound, suppressing the multiplicative speckle noise is necessary before processing like image segmentation, edge detection, and in general any medical diagnosis. The goal of image denoising is to remove noise while retaining the important signal features. There are two basic approaches for image denoising; spatial domain methods and transform domain methods [1]. Although the spatial domain methods need less computation cost, the transform domain methods have less blurring effect.
Wavelet transform (WT) is the most well-known two dimensions and multi-resolution transform that decompose an image in horizontal, vertical and diagonal directions. Researchers attempt to find new two dimensions and multi-resolution transforms as the traditional WT with more directionality in contrast with WT. Due to, Contourlet transform (CT) [2] -[3] and
Shearlet transform (ST) [4]-[5] were proposed. Although CT was originally introduced in discrete domain, ST similar to continues WT represents an affine system obtained by scaling and translation and in addition unlike WT it has an extra parameter called shear. The original WT, CT, and ST because of using up- and downsampling are shift variant. That means, the coefficients are changing whenever the original signal is translating. The pseudo-Gibbs phenomena are seen around singularities for any shift variant transform [6]. So, nonsubsampled Wavelet (NSWT) [7], nonsubsampled Contourlet (NSCT) [8], and nonsubsampled Shearlet (NSST) [9] by omitting the up- and down-sampling blocks were introduced. As the coefficients do not decimate between the decomposition levels, all subbands sizes are the same as the original input image. However, in some papers, the original shift variant transforms were used [10]-[12] and in some papers, the nonsubsampled shift invariant transforms were used [9], [13].
The most well-known method in transform domain for speckle denoising is thresholding which is based on the idea that the energy of the signal concentrates on some of the transformed coefficients, while the energy of noise spreads throughout all transformed coefficients. So as much as being the transformed coefficients spares, the thresholding image denoising works appropriately. Anyway, the main problem in thresholding method is finding the optimum threshold value [14]. This threshold can be adaptive or non-adaptive per sub-band. Bayesian shrinkage [15] is the adaptive threshold method.
In this paper, we used Bayesian shrinkage in order to find the optimum threshold value for each decomposition level and each sub-band under employing three nonsubsampled transforms named NSWT, NSCT, and NSST. According to our results, for test images, the NSST domain outperforms both NSCT and NSWT whereas for true ultrasound images, the best performance is not always achieved by NSST.
The outline of this paper follows. In Section 2, the speckle noise model and image assessment parameters are explained. In Section 3, denoising in transform domain by thresholding is explained and in addition we have a short review on Bayesian shrinkage. Our experimental results for Bayesian shrinkage based on three mentioned transforms are given in Section 4.
Finally, we have conclusion in Section 5.
1 + N s
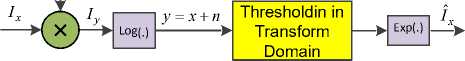
Fig. 1. The block diagram of speckle denoising method that works in transform domain.
(b)
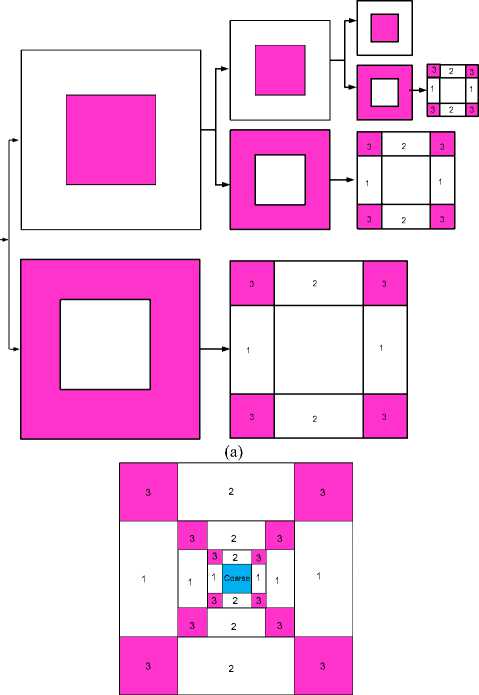
Fig. 2. Shown the NSWT of three levels decompositions (a) and the tilling frequency (b).
-
II. Speckle Noise Model And Image Assessment Parameters
In general, there are two different noise models, additive and multiplicative, such as Gaussian noise and speckle noise. The speckle noise is modeled as,
I y = I x + I x N , (1)
(a)
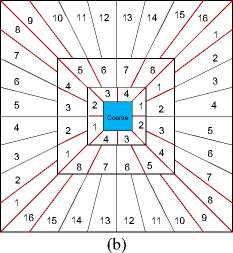
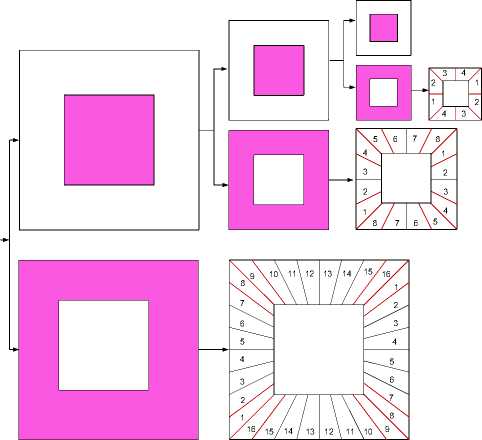
Fig. 3. Shown the NSCT and NSST of three levels decompositions (a) and the tilling frequency (b).
where I and Iy denotes the noise free signal and the observed signal, and N is the speckle noise in spatial domain. Equation (1) can be rewritten as, Iy = Ix (1 + Ns). The multiplicative noise is converted to additive noise by using the logarithm transform, y = Log(Iy ) = x + n , (2)
where x = Log( I ) and n = Log(1 + N ) . So, additive noise reduction methods are applied to remove n component. The block diagram of suppression the speckle noise in transform domain using homomorphic frame work is shown in Fig. 1.
The performance evaluation of filters is a basic issue. In this work, we used peak signal to noise ratio (PSNR), mean square error (MSE), and structural similarity (SSIM) as the full-reference (FR) objective criteria parameters and noise variance (NV), mean square difference (MSD), and equivalent number of looks (ENL) as the no-reference (NR) objective criteria parameters. For any despeckled image, I ˆ x , as shown in Fig. 1, in spatial domain, the NV is
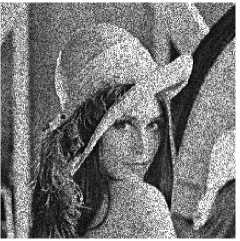
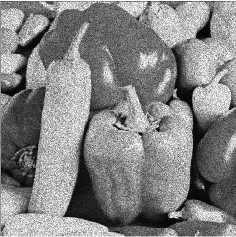
Fig. 4. Shown the speckled noisy images of Lena and Pepper where the noise power is 0.1.

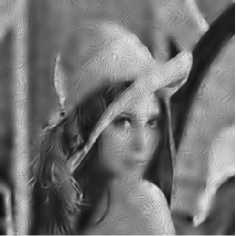
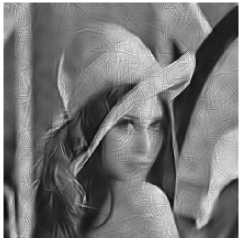
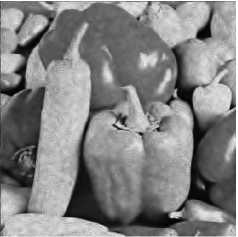


Fig. 5. Bayesian shrinkage based on using the NSWT (the left column), NSCT (the middle column), and NSST (the right column).
MN
££ [ I x (i, j ) - 1 x ] 2
NV =
i =1
j =1
MN
ENL = -x-NV
where Ix is the average intensity value of despeckled
MN image and obtained as I = 1 V1 V1 I (i j) , and MN x MN x , i=1 j=1
refers to the image size. In general NV determines the contents of speckle in an image. It means, a lower variance gives a “smoother and cleaner” image as more speckle is removed though it does not necessarily depend on the intensity. Another NR objective parameter, MSD, is
MN
ZZ [ I x ( i , j ) - l y ( i , j )]2
MSD = d=l j =1------------------ (4)
MN where Iy as shown in Fig. 1 is the original noisy image. Although, high MSD shows the significant filter performance, we should be careful about blurring edges. The last used NR objective assessment parameter is ENL,
ENL is known as the best NR objective assessment parameter that estimates the speckle noise level in an image over uniform regions. On the other words, getting great ENL value shows appropriate performance of an algorithm. As ENL value depends on the tested region size, in Section 4 for experimental results, we split an image into blocks with 25×25 pixels and obtain ENL for each block separately, then we compute the average ENL and write the results in Tables.
-
III. Denoising In Transform Domain
As mentioned before, thresholding is basically an approach for despeckling in transform domain. The main problem in thresholding method is finding the optimum threshold value [14]. This threshold can be adaptive or non-adaptive per sub-band. In transform domain, we represent Yi , Xi and Ni as noisy signal coefficient, noise free signal coefficient and noise component coefficient for any coefficient indexed by i . Then, for any linear transform, we have
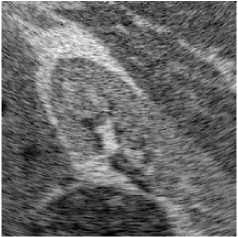

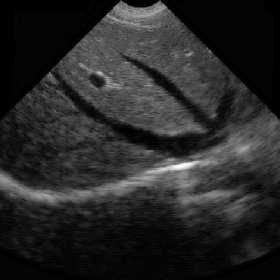
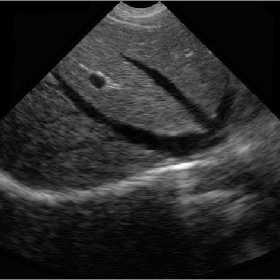
Fig. 6. Shown the original ultrasound images which in heritage including the speckle noise.
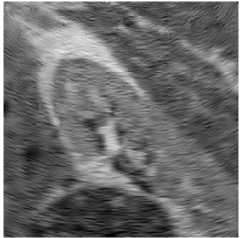
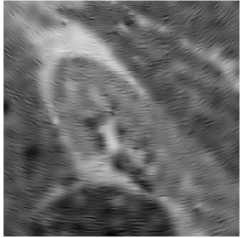
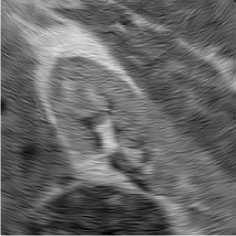


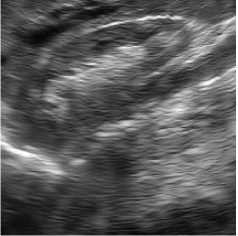
Fig. 7. Bayesian shrinkage based on using the NSWT (the left column), NSCT (the middle column), and NSST (the right column) for true ultrasound images.
Y = Xi + N i (6)
For soft thresholding we have
and the manipulated or estimated coefficient Y ˆ i based on the observed coefficients Yi and the weighting factor Ri is obtained as
f 0
R =
X
| Y |
I Y I < X
I Y I > x
A
Y = RY i ii
In general, there are three ways to implement the threshold on transformed domain coefficients named hard, soft and semi-soft thresholding [16].
For hard thresholding we have
0 I YI< X , 1 IYI> X
In soft thresholding, as written in (9), the weighting factor R for all coefficients with greater magnitude than the threshold value λ shrink towards one and for other coefficients set to zero.
The aim of semi-soft thresholding is to offer a compromise between hard and soft thresholding by changing the gradient of the slope. This scheme requires two thresholds, a lower threshold value λ and an upper threshold value λ
In hard thresholding, as written in (7) and (8), all coefficients whose magnitude is smaller than the selected threshold value λ are set to zero and the others whose magnitude is greater than λ remains as they were.
Ri=\
X 2
X2 - X1
(1 - X L)
Y
I Y-^ X1
X i < I Y I < X 2
I Y-> X
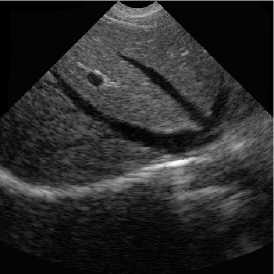
(a) Original kidney ultrasound image
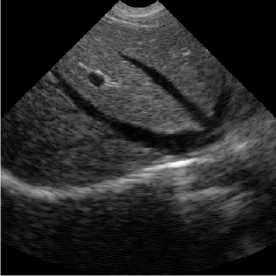
(b) BS-NSWT
(c ) BS-NSCT
Fig. 8. Bayesian shrinkage based on three mentioned transform domains for visual evaluation.
(d) BS-NSST
VisuShrink is the simplest way to find the threshold value based on the standard deviation of noise for all coefficients [17]. The in heritage of finding the threshold value by this method is discarding many coefficients and therefore result a blurred image. In order to overcome this problem, the threshold value was obtained based on Stein’s Unbiased Risk (SURE) which named as SureShrink [18]. In this method, the threshold value for every decomposition level including different sub-bands is obtained. The Bayesian shrinkage or BayesShrink [15] computes the optimum threshold values at each decomposition level and for every sub-bands separately, according to
dropped. In this work, in order to estimate the standard deviation of noise, ctn , we used the robust median estimator,
CT N =
median( Y 1) 0.6745
X l , k =
(aN^ i, k (ctX ) l,k
where Y denotes the transformed coefficient of finest scale sub-bands. Furthermore, assuming a linear transformation, it can be written Y = X + N for each level and any sub-band. Assuming that the signal coefficients and the noise coefficients are also independent at each level and any sub-band [19], i.e. we have O Y = CT X + C NN where ст X is the signal variance without noise and O Y is the variance of noisy signal obtained as,
where X k is BayesShrink [15] threshold, ( ст 2 )zt is noise variance and ( ct x ) ik is the standard deviation of the noise free signal for any level ' l ' and sub-band ' k ' . For implementing the BayesShrink in transform domain based on (11), the noise variance and the free noise signal variance are to be estimated for each decomposition level and sub-band. To simplify the notation, in following, the subscripts l and k that indicate level and sub-band are
MN ст 2 =—У Zy 2
Y MN i,j i=1 j=1
It was shown [19] that the variance of free noise signal can be estimated as,
CT X = max( CT Y - CT 22 , 0) (14)
Table 1. Obtained the FR objective assessment parameters under different noise power in order to compare the performance of Bayesian shrinkage when NSWT, NSCT, and NSST are used as transform domains. Lena and Pepper are used as the test images.
|
ct 2 = 0.1 |
ct 2 = 0.3 |
ct 2 = 0.5 |
||||||||
|
SSIM |
PSNR (dB) |
MSE |
SSIM |
PSNR (dB) |
MSE |
SSIM |
PSNR (dB) |
MSE |
||
|
Noisy Image |
Lena |
0.32 |
37.44 |
0.237 |
0.18 |
27.54 |
0.0637 |
0.143 |
23.72 |
0.0932 |
|
Peppers |
0.469 |
35.84 |
0.0278 |
0.310 |
26.25 |
0.0724 |
0.251 |
22.44 |
0.1060 |
|
|
BS-NSWT |
Lena |
0.66 |
56.09 |
0.0037 |
0.52 |
46.91 |
0.0092 |
0.485 |
42.61 |
0.0141 |
|
Peppers |
0.789 |
57.48 |
0.0032 |
0.681 |
45.39 |
0.0107 |
0.621 |
39.97 |
0.0184 |
|
|
BS-NSCT |
Lena |
0.65 |
54.55 |
0.0043 |
0.50 |
46.38 |
0.0097 |
0.452 |
42.30 |
0.0145 |
|
Peppers |
0.794 |
56.56 |
0.0035 |
0.664 |
44.98 |
0.0111 |
0.594 |
39.66 |
0.0189 |
|
|
BS-NSST |
Lena |
0.71 |
56.87 |
0.0034 |
0.57 |
47.34 |
0.0088 |
0.506 |
42.77 |
0.0139 |
|
Peppers |
0.797 |
58.38 |
0.0029 |
0.672 |
45.60 |
0.0105 |
0.602 |
39.96 |
0.0184 |
|
Table 2. Obtained the NR objective assessment parameters under different noise power in order to compare the performance of Bayesian shrinkage when NSWT, NSCT, and NSST are used as transform domains. Lena and Pepper are used as the test images.
|
ct 2 = 0.1 |
ct 2 = 0.3 |
ct 2 = 0.5 |
||||||||
|
NV |
MSD |
ENL |
NV |
MSD |
ENL |
NV |
MSD |
ENL |
||
|
Noisy Image |
Lena |
0.065 |
0 |
5.30 |
0.097 |
0 |
2.52 |
0.120 |
0 |
1.80 |
|
Peppers |
0.076 |
0 |
7.30 |
0.106 |
0 |
3.09 |
0.130 |
0 |
2.11 |
|
|
BS_NSWT |
Lena |
0.037 |
0.019 |
35.72 |
0.028 |
0.054 |
28.43 |
0.023 |
0.081 |
28.57 |
|
Peppers |
0.046 |
0.023 |
95.71 |
0.033 |
0.061 |
69.31 |
0.026 |
0.092 |
64.39 |
|
|
BS_NSCT |
Lena |
0.035 |
0.022 |
50.45 |
0.027 |
0.056 |
33.77 |
0.022 |
0.081 |
30.13 |
|
Peppers |
0.045 |
0.023 |
110.81 |
0.033 |
0.060 |
66.07 |
0.027 |
0.087 |
52.70 |
|
|
BS-NSST |
Lena |
0.036 |
0.022 |
52.82 |
0.027 |
0.059 |
39.53 |
0.022 |
0.085 |
36.08 |
|
Peppers |
0.045 |
0.024 |
110.24 |
0.033 |
0.062 |
73.60 |
0.026 |
0.091 |
61.73 |
|
-
IV. Bayesian Shrinkage And Our Experimental Results
Thresholding on coefficients in transform domain is a simple non-linear technique. It assumes that the small coefficients are dominated by noise, and coefficients with a large absolute value carry more signal information than noise. So, noisy coefficients, with small values, set to zero and an inverse transform on the manipulated coefficients may result an image with less noise. Obviously, an appropriate method removes more speckle noise and has less blurring effects. Among many transform domains, we have chosen NSWT, NSCT, and NSST. As we used the BayesShrink for three mentioned transform domain, they named as BS-NSWT, BS-NSCT, and BS-NSST. BayesShrink is a popular thresholding method that was applied in Shearlet [11], Contourlet [19] and Wavelet transform domain [20]. Finding the optimum threshold value to get an output image with the least blurring effect and the most noise reduction is the main goal of any algorithm.
The general block diagram of our proposed method is shown in Fig. 1, where the center block is thresholding operator in transform domain. In following, the procedures of our image denoising algorithm are written:
-
• Decompose an input image into three levels by NSWT, NSCT, and NSST. The decomposition levels, tilling frequency and the numbered subbands are shown in Figs. 2, 3.
-
• Determine the noise variance for each decomposition level based on (12). For NSWT, we
have used the diagonal sub-bands numbered 3 for the first, second and third decomposition levels. For NSCT, we have used sub-bands numbered 1,8,9,16 and 1,4,5,8 and 1,2,3,4 in order for the first, second and third decomposition levels. For NSST, we have used sub-bands numbered 8,16 and 4,8 and 2,3 in order for the first, second and third decomposition levels.
-
• Compute the variance of noisy signal for all subbands based on (13) and estimate the variance of noise free signal according to (14).
-
• Obtain the threshold value for each sub-band according to (11), and use the Bayesian soft thresholding for all sub-bands except the coarse one.
-
• Reconstruct the denoised image by using the inverse transform.
In this section, we have compared the performance of BS-NSWT, BS-NSCT, and BS-NSST in terms of subjective and objective image assessment. We were interested in performing experiments on images of different types and with various contents in order to be able to obtain results, which we could claim to be general enough. So, we used two synthetic noisy image and three true ultrasound images as well. In addition, the image assessment parameters averaged from 10 independent trials.
We used Lena with size 256 x 256 and Pepper with size 512 x 512 pixels and 256 gray levels as the synthetic images and two real ultrasound images with the same size 256 x 256 pixels and the last ultrasound image with size 512 x 512 as well. All input images are normalized before using the logarithm transform. Sample noisy images where the speckle noise variance is 0.1 and the results of despeckled Lena, and Pepper are shown in Figs. 4, 5. In Tables 1, 2, we compute FR and NR parameters, for evaluating the despeckling methods where there is different variance of noise. Obviously, for all methods, the quality is decreasing while the noise variance is increasing. For easy comparison, we bold the best achieved values for PSNR and ENL. According to the results, BS-NSST almost all times got the best performance.
Ultrasound images are extremely affected by speckle noise which may cause error decision about a patient disease. In real application, including ultrasound images, there is not a clean signal or noise free signal. Two ultrasound original images and the processed images are shown in Figs. 6, 7. In addition the NR parameters for the true ultrasound images shown in Fig. 6 are written in Table 3 where for easy comparison, we bold the best achieved values for ENL. The parameters are obtained by averaging the results for 10 independent trials. According to the results, unexpectedly, BS-NSCT got the best value for ENL. Accordingly, although BS-NSST image denoising method enjoy superior performance in terms of both subjective and objective evaluation over other NSWT and NSCT for synthetic test images, for real ultrasound images, the BS-NSCT outperform the others according to NR image assessment parameters. It means when dealing with real ultrasound images, BS-NSCT despeckling method preserve most important point targets and texture structures. At the end, the original ultrasound image belongs to kidney with size 512 x 512 pixels and the despeckling results by BS-NSWT, BS-NSCT, and BS-NSST for visual evaluation are shown in Fig. 8.
-
V. Conclusion
In this paper, the threshold values are obtained by BayesShrink where we consider NSWT, NSCT, and NSST as the transform domain. In general, there is a trade-off between getting an accurate estimate of the signal and the ability to reduce noise. Different deblurring methods tries to remove the noise from the image approximation without lost the information. Our experimental results based on objective and subjective criteria verify that BS-NSST is the best method due to remove the most speckle noise and preserve the image edges and textures for synthesized noisy images, but the experimental results carried out on true ultrasound images and obtained NR parameters evaluate BS-NSCT as the best method. To overcome the BS-NSST draw back, in future, we focus on speckle noise analysis in different transform domains.
The author would like to thank the anonymous reviewers who contributed to considerably improve the quality of this paper. S. Ghofrani was supported in part by Islamic Azad University, Tehran South Branch. The title of project was, “Ultrasound Image Despeckling Based on Shearlet Transform”.
Table 3. Obtained the NR objective assessment parameters for two ultrasound images shown in Fig. 6 to compare the performance of
Bayesian shrinkage when NSWT, NSCT, and NSST are used as transform domains.
|
Image#1 |
Image#2 |
|||||
|
NV |
MSD |
ENL |
NV |
MSD |
ENL |
|
|
Noisy Image |
0.0243 |
0 |
15.47 |
0.0322 |
0 |
8.562 |
|
BS-NSWT |
0.0211 |
0.0010 |
22.65 |
0.0289 |
0.0008 |
11.07 |
|
BS-NSCT |
0.0184 |
0.0028 |
38.01 |
0.0242 |
0.0033 |
18.68 |
|
BS-NSST |
0.0201 |
0.0015 |
25.92 |
0.0275 |
0.0014 |
12.57 |
-
[1] M.C. Motwani, M.C. Gadiya, R.C. Motwani, and F. C. Harris, “Survey of image denoising techniques,” Proceedings of Global Signal Processing Expo., pp. 27-30, 2004.
-
[2] N. Minh, V. Martin, “The Contourlet transform: an efficient directional multiresolution image representation,” IEEE Trans. on Image Processing, vol. 14, pp. 1-16, 2005.
-
[3] M. N. Do, and M. Vetterli, “Contourlets: a directional multiresolution image representation,” International Conference on Image Processing, pp. 357-360, 2002.
-
[4] G. Easley, D. Labate, and W. Q. Lim, “Sparse directional image representations using the discrete shearlet transform,” Elsevier, Applied and Computational Harmonic Analysis vol. 25, no. 1, pp. 25-46, 2008.
-
[5] G. R. Easley, D. Labate, W. Q. Lim, “Optimally sparse image representations using shearlets,” 40th Asilomar Conference on Signals, Systems and Computers, pp. 974978, 2006.
-
[6] R. R. Coifman and D. L. Donoho, “Translation invariant de-noising”, Springer New York, Wavelets and Statistics. Lecture Notes in Statistics, pp. 125-150, 1995.
-
[7] M. Lang, H. Guo, J. E. Odegard, C. S. Burrus, and R. O. Wells, “Noise reduction using an undecimated discrete wavelet transform,” IEEE Signal Processing Letters, v ol. 3, no. 1, pp. 10- 12, 1996.
-
[8] A. L. Cunha, J. Zhou, and M. N. Do, “The Nonsubsampled Contourlet transform: theory, design and applications,” IEEE Trans. on Image Processing, vol. 15, no. 10, pp. 3089-3101, 2006.
-
[9] B. Hou, X. Z. Zhang, X. Bu, and H. Feng, “SAR image despeckling based on nonsubsampled shearlet transform,” IEEE, Journal of Selected Topics in Applied earth Observations and Remote Sensing, vol. 5, no. 3, pp. 809823, 2012.
-
[10] G. Andria, F. Attivissimo, M. L. Lanzolla, and M. Savino, “A suitable threshold for speckle reduction in ultrasound images,” IEEE Trans. on Instrumentation and Measurement, vol. 62, no. 8, pp. 2270- 2279, 2013.
-
[11] R. K. Rai, J. Asnani and T. R. Sontakke, “Review of shrinkage techniques for image denoising”, International Journal of Computer Application, vol. 42, no. 19, pp. 1316, 2012.
-
[12] A. Pizurica, A. M. Wink, E. Vansteenkiste, W. Philips, and J. B.T.M. Roerdink, “A review of wavelet denoising in MRI and ultrasound brain imaging,” Bentham Science, Journal of Current Medical Imaging Reviews, vol. 2, no. 2, pp. 247- 260, 2006.
-
[13] Z. Chen, X. Hao, Z. Sun, “Image denoising in shearlet domain by adaptive thresholding,” Journal of Information and Computational Science, vol. 10, no. 12, pp. 37413749, 2013.
-
[14] Y. S. Kim, and J. B. Ra, “Improvement of ultrasound image based on wavelet transform: speckle reduction and edge enhancement,” SPIE, Medical Imaging, vol. 5747, pp. 1085- 1092, 2005.
-
[15] R. Serhunadh, and T. Tessamma, “Spatially adaptive image denoising using undecimated directionlet transform,” International Journal of Computer Applications, vol. 84, no. 11, pp. 43- 49, 2013.
-
[16] A. Ouahabi, “A review of wavelet denoising in medical imaging,” IEEE, 8th International Workshop on Systems, Signal Processing, and their Applications, pp. 19- 26, 2013.
-
[17] D. L. Donoho and I. M. Johnstone, “Ideal spatial adaption via wavelet shrinkage”, Biometrika, vol. 81, no.3, pp. 425-455, 1994.
-
[18] D.L. Donoho, I.M. Johnstone, “Adapting to unknown smoothness via wavelet shrinkage”, Journal of the American Statistical Association, vol. 90, no. 432, pp. 1200–1224, 1995.
-
[19] D. X. Zhang, Q. W. Gao and X. P. Wu, “Bayesian-based speckle suppression for SAR image using Contourlet transform”, Journal of electronic science and technology of china, vol. 6, no. 1, pp. 79-82, 2008.
-
[20] H. A. Chipman, E. D. Kolaczyk, and R. E. McCulloch, "Adaptive Bayesian wavelet shrinkage," Journal of the
American Statistical Association, vol. 92, pp. 1413-1421, 1997.
Author’s Profile
Sedigheh Ghofrani was born 1968 in Ghochan, recieved BSc degree in Electronic Engineering from Tehran University, Iran, in 1991, the MSc. Degree in communication from Islamic Azad University, South Tehran Branch, Iran, in 1997 and Ph.D. in Electronic from Iran University of Science and Technology, in 2004. She has been the assistant professor of Electronic and Electrical Engineering Department at the Islamic Azad University, South Tehran Branch from 2004 to 2011 and associate professor since 2012. Her area of research includes image processing and signal processing. In 2003, she spent eight months at the School of Electronic and Electrical Engineering, the University of Leeds, UK, supported by British Council foundation. In 2012, she spent eight months at the Center for Advanced Communications (CAC) at Villanova University, PA, USA, as visiting research professor.
References Comparing Nonsubsampled Wavelet, Contourlet and Shearlet Transforms for Ultrasound Image Despeckling
- M.C. Motwani, M.C. Gadiya, R.C. Motwani, and F. C. Harris, “Survey of image denoising techniques,” Proceedings of Global Signal Processing Expo., pp. 27-30, 2004.
- N. Minh, V. Martin, “The Contourlet transform: an efficient directional multiresolution image representation,” IEEE Trans. on Image Processing, vol. 14, pp. 1-16, 2005.
- M. N. Do, and M. Vetterli, “Contourlets: a directional multiresolution image representation,” International Conference on Image Processing, pp. 357-360, 2002.
- G. Easley, D. Labate, and W. Q. Lim, “Sparse directional image representations using the discrete shearlet transform,” Elsevier, Applied and Computational Harmonic Analysis vol. 25, no. 1, pp. 25-46, 2008.
- G. R. Easley, D. Labate, W. Q. Lim, “Optimally sparse image representations using shearlets,” 40th Asilomar Conference on Signals, Systems and Computers, pp. 974- 978, 2006.
- R. R. Coifman and D. L. Donoho, “Translation invariant de-noising”, Springer New York, Wavelets and Statistics. Lecture Notes in Statistics, pp. 125-150, 1995.
- M. Lang, H. Guo, J. E. Odegard, C. S. Burrus, and R. O. Wells, “Noise reduction using an undecimated discrete wavelet transform,” IEEE Signal Processing Letters, vol. 3, no. 1, pp. 10- 12, 1996.
- A. L. Cunha, J. Zhou, and M. N. Do, “The Nonsubsampled Contourlet transform: theory, design and applications,” IEEE Trans. on Image Processing, vol. 15, no. 10, pp. 3089-3101, 2006.
- B. Hou, X. Z. Zhang, X. Bu, and H. Feng, “SAR image despeckling based on nonsubsampled shearlet transform,” IEEE, Journal of Selected Topics in Applied earth Observations and Remote Sensing, vol. 5, no. 3, pp. 809- 823, 2012.
- G. Andria, F. Attivissimo, M. L. Lanzolla, and M. Savino, “A suitable threshold for speckle reduction in ultrasound images,” IEEE Trans. on Instrumentation and Measurement, vol. 62, no. 8, pp. 2270- 2279, 2013.
- R. K. Rai, J. Asnani and T. R. Sontakke, “Review of shrinkage techniques for image denoising”, International Journal of Computer Application, vol. 42, no. 19, pp. 13-16, 2012.
- A. Pizurica, A. M. Wink, E. Vansteenkiste, W. Philips, and J. B.T.M. Roerdink, “A review of wavelet denoising in MRI and ultrasound brain imaging,” Bentham Science, Journal of Current Medical Imaging Reviews, vol. 2, no. 2, pp. 247- 260, 2006.
- Z. Chen, X. Hao, Z. Sun, “Image denoising in shearlet domain by adaptive thresholding,” Journal of Information and Computational Science, vol. 10, no. 12, pp. 3741-3749, 2013.
- Y. S. Kim, and J. B. Ra, “Improvement of ultrasound image based on wavelet transform: speckle reduction and edge enhancement,” SPIE, Medical Imaging, vol. 5747, pp. 1085- 1092, 2005.
- R. Serhunadh, and T. Tessamma, “Spatially adaptive image denoising using undecimated directionlet transform,” International Journal of Computer Applications, vol. 84, no. 11, pp. 43- 49, 2013.
- A. Ouahabi, “A review of wavelet denoising in medical imaging,” IEEE, 8th International Workshop on Systems, Signal Processing, and their Applications, pp. 19- 26, 2013.
- D. L. Donoho and I. M. Johnstone, “Ideal spatial adaption via wavelet shrinkage”, Biometrika, vol. 81, no.3, pp. 425-455, 1994.
- D.L. Donoho, I.M. Johnstone, “Adapting to unknown smoothness via wavelet shrinkage”, Journal of the American Statistical Association, vol. 90, no. 432, pp. 1200–1224, 1995.
- D. X. Zhang, Q. W. Gao and X. P. Wu, “Bayesian-based speckle suppression for SAR image using Contourlet transform”, Journal of electronic science and technology of china, vol. 6, no. 1, pp. 79-82, 2008.
- H. A. Chipman, E. D. Kolaczyk, and R. E. McCulloch, "Adaptive Bayesian wavelet shrinkage," Journal of the American Statistical Association, vol. 92, pp. 1413-1421, 1997.
