Comparing the Acceptance of Key Performance Indicators Management Systems on Perceived Usefulness and Perceived Ease of Use in a Higher Education Institution in Malaysia

Author: Mei Yean ONG, Balakrishnan Muniandy, Saw Lan ONG, Keow Ngang TANG, Kia Kien PHUA
Journal: International Journal of Modern Education and Computer Science (IJMECS) @ijmecs
Article in issue: 10 vol.4, 2012.
Free access
This article discusses the findings of a study that elucidated users’ acceptance of two management systems for key performance indicators (KPIs) in terms of their usefulness and ease of use scores at a higher education institution in Malaysia. The two management systems were Key Performance Indicators Monitoring System (KPI-MS) and Excel Spreadsheet System (ESS). ESS is a system developed using Microsoft Excel and has been in used since the year 2008 in the institution to calculate KPIs marks. The ESS system, however, has several shortcomings, and the KPI-MS system was developed with the intention to replace ESS. KPI-MS is an online KPI performance monitoring system which allows users to access the system wherever and whenever they want using a web browser. In addition, KPI-MS is designed as an intelligent system that is able to process raw data automatically to produce results that can be easily visualized in a graphical manner. A survey questionnaire was used to collect data on the acceptance of both systems. A total of 78 participants who were involved in KPI data processing from all 42 schools and centres in the higher education institution in Malaysia participated in this study. The instrument of this study was adapted and modified from Davis’ Technology Acceptance Model (TAM). This instrument was content-validated by three experts in the related field and the reliability index computed with Cronbach alpha was 0.955. A descriptive analysis was conducted to compare the mean scores of both KPI-MS and ESS rated by the users. The results showed that the users rated KPI-MS as a very useful system in monitoring KPI performance of their schools or centres compared to ESS. Also, users rated the KPI-MS to be significantly easier (p≤0.01) and more enjoyable to use. In conclusion, it is recommended that KPI-MS should replace the ESS system in managing KPIs data.
Key Performance Indicators, Key Performance Indicator Monitoring System, Excel Spreadsheet System, Technology Acceptance Model
Short address: https://sciup.org/15014491
IDR: 15014491
Text of the scientific article Comparing the Acceptance of Key Performance Indicators Management Systems on Perceived Usefulness and Perceived Ease of Use in a Higher Education Institution in Malaysia
Published Online September 2012 in MECS
Key Performance Indicators (KPIs) are the performance measurement indices used in organizations and institutions to help them evaluate quantitative improvements and define success [1]. Today, with the improvement of technology and globalization, there is intense competition between institutions to be outstanding [2]. Therefore, KPIs are needed to measure organizational performance. According to Chan and Chan [3], KPIs are specific indicators that look into critical aspects of outputs and outcomes, and thus several issues need to be addressed in KPI measurement system. This article consists of five main sections. The introduction section introduces the importance of KPIs in measuring organizations’ and institutions’ performances followed by the monitoring systems used in Malaysia Higher Education Institutions. The theory used in the study is also discussed in the introduction section. The second section discusses the method used in the research. The basic flow of the development of the KPI-MS system and the information about the participants and the instrument used in the study were also discussed. This is followed by discussing the data obtained for the study. Subsequently, the data was analyzed and discussed. The last section summarizes the findings of the study.
-
A. KPI Monitoring Systems in Malaysian Higher Education Institutions
For higher education institutions, KPIs are used in planning and improving the university’s performance [4]. In Malaysia, public higher education institutions have a set of KPIs that are defined by the Ministry of Higher Education (MoHE), and referred to as the Malaysian Research Assessment (MyRA) instrument. MyRA instrument was first introduced in 2006 and was further improved in 2009. It was introduced with the purpose to assess the performance of Research Universities (RU) and Higher Institutions’ Centres of Excellence (HICoE). MoHE provides the standard benchmarks for the KPIs to enable public RUs in Malaysia to improve their performance and strive to be in the top 100 universities in the world rank. All universities in Malaysia are required to submit their MyRA scores to MoHE each year. The MyRA scores are benchmarked so that a score of more than 100 denotes attachment of RU status and are rewarded by additional funding. Today, five universities in Malaysia have achieved the RU status. MyRA consists of nine sections which are A) General Information that includes the number of academic staff and fulltime students; B) Quantity and Quality of Researchers; C) Quantity and Quality of Research; D) Quantity of Postgraduates; E) Quality of Postgraduates; F) Innovation and Intellectual Property; G) Professional Services and Gifts; H) Networking and Services forged by the universities; and lastly I) Support Services available in the universities. The university being studied is a RU that is also subject to the MyRA assessment criteria of MoHE. Presently, the tool used to process the KPIs data and monitor the KPIs marks is an Excel Spreadsheet System (ESS). MoHE has
introduced the use of ESS to these universities since the year 2008. The use of ESS as a database is fraud with numerous weaknesses. One obvious problem is that the formula embedded on ESS is easily corrupted. These formulae used to compute the KPIs marks are user accessible and can be easily tampered with. Each ESS file can only store information for each school or centre and can only store a year’s information per file. Also, it was not designed to link data to generate charts automatically. As such, collecting, collating and processing of KPI marks of all 42 schools or centres with the higher institution was to claim, time consuming and prone to errors in addition to the disadvantages indicated previously. Therefore, there is a need for an alternative and better system to be developed in order to overcome these problems of the existing system. Hence, the Key Performance Indicators Monitoring System (KPI-MS) was developed to improve on the storage, data processing and management of the KPIs data of this institution of higher learning in Malaysia.
-
B. Technology Acceptance Model (TAM)
Technology Acceptance Model (TAM) was proposed by Fred Davis in the year 1986 to study the acceptance of a newly developed information system especially in terms of its ‘perceived usefulness’ and ‘perceived ease-of-use’ [5][6][7]. Ever since then, many studies had been conducted using TAM to determine users’ degree of acceptance of a particular information system. According to Davis, ‘perceived usefulness’ refers to the degree to which the users found that using a particular information system can enhance the users’ job, while ‘perceived ease-of-use’ refers to the degree to which the users found that using an information system is free of effort [6]. Davis proposed in his model that ‘perceived usefulness’ and ‘perceived ease-of-use’ of an information system will affect the users’ behavioural intention to use it. Ramayah and Ignatius [8] had done research to find out the perceived usefulness, perceived ease of use and perceived enjoyment of an online shopping system. Parka et al. have also done research on the user acceptance of the digital library system [9]. Fig. 1 shows Davis’ TAM model. The figure has clearly shown the relation between ‘perceived usefulness’ and ‘perceived ease-of-use’ with the intention to use an information system by the users.
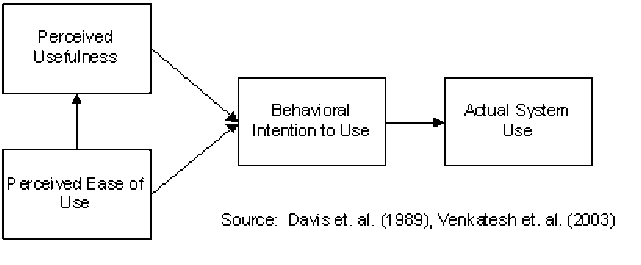
Figure 1. Technology Acceptance Model (TAM).
A pilot study conducted had shown that there have been interests in the development of a KPI management system [10]. However, no KPI-MS system was developed or evaluated to examine users’ acceptance of the system and whether users find the newly developed system more useful and easy to use [10]. There are many studies focusing on the acceptance on e-learning, mobile learning, and also multimedia learning. These studies looked at how users or students find e-learning, mobile learning, or even multimedia learning systems are useful to them and whether they are easy to use and are useful. As acceptance of a newly developed system is important, such a study needs to be carried out to determine the users’ acceptance of the newly developed KPI-MS comparing with the ESS. The aims of this study is to compare the KPI-MS with the ESS in terms of accuracy of KPI mark computation, user’s ‘perceived usefulness’ and ‘perceived ease-of-use’. Specifically, the research questions of this study are as follows:
-
i. How is the acceptance of the KPI-MS compared to the ESS in terms of usefulness?
-
ii. How is the acceptance of the KPI-MS compared to ESS in terms of ease of use?
-
iii. Which KPI management system is preferred by the schools and centres in the institution?
-
iv. What new features of the KPI-MS are more needed and accepted by the users?
There are two hypotheses set for this study:
-
i. There is no significant difference (p≤0.05) between KPI-MS and ESS in terms of users’ ‘perceived usefulness’.
-
ii. There is no significant difference (p≤0.05) between KPI-MS and ESS in terms of ‘perceived ease-of-use’.
-
II. RESEARCH METHODOLOGY
The proposed KPI-MS is an online KPI monitoring system which allows users to access it wherever and whenever they want using a web browser. It functions as a central data storage system using SQL as database. This is a robust industry-class database that enables the system to store multiple schools’ and centres’ information with multiple years so that cumulative annual data can be retrieved and compared with other years. KPI-MS is designed as an intelligent system where it is able to process raw data automatically to produce meaningful information. It has a single relational database file structure which is easily maintained and also compatible with corporate database structure. This system collects information to be computed cumulatively for comparison with different years. The KPI-MS system is developed with the purpose of helping the 42 schools and centres in the higher education institution to store KPI data, calculate KPI marks and generates reports and charts automatically [11][12]. Besides, KPI-MS is developed to provide value-added services, such as on-line realtime monitoring of each school’s and centre’s KPI accomplishments including performance comparison by years, between targeted (benchmark) and current accomplishment, as well as between schools and centres in the higher education institution. The system flow of KPI-MS is illustrated in the figure below:
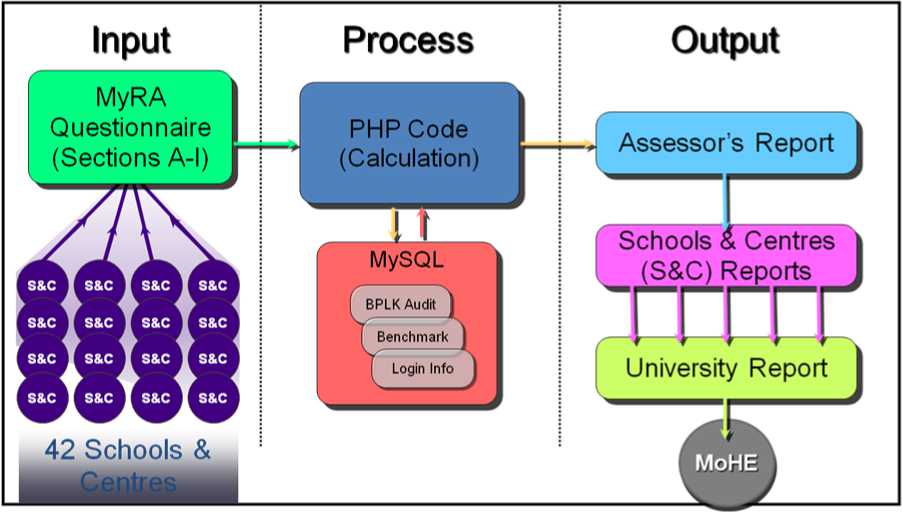
Figure 2. The system flow of KPI-MS.
Fig. 3 and Fig. 4 below show the user interface of the KPI data entry form for KPI-MS and ESS system, respectively.
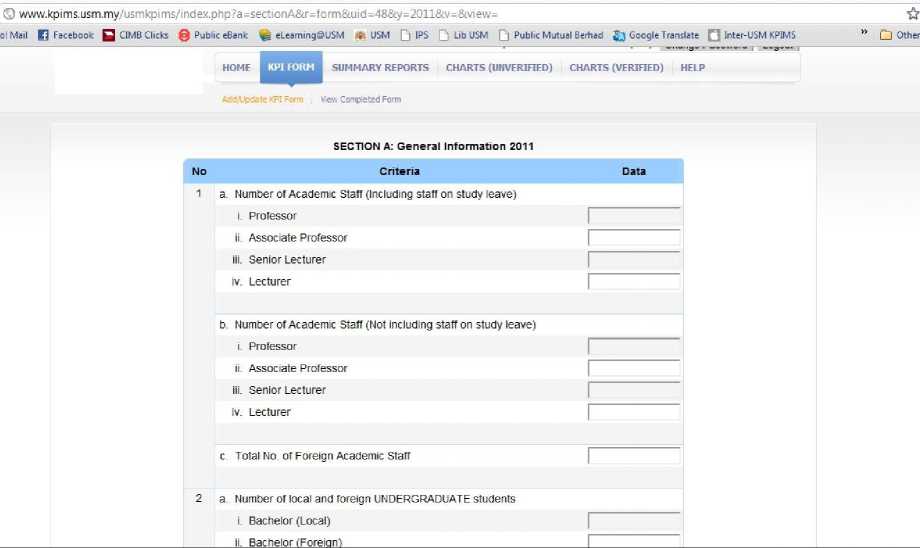
Figure 3. The interface of KPI data entry form in the KPI-MS system showing an uncluttered data entry form that is easy to use.
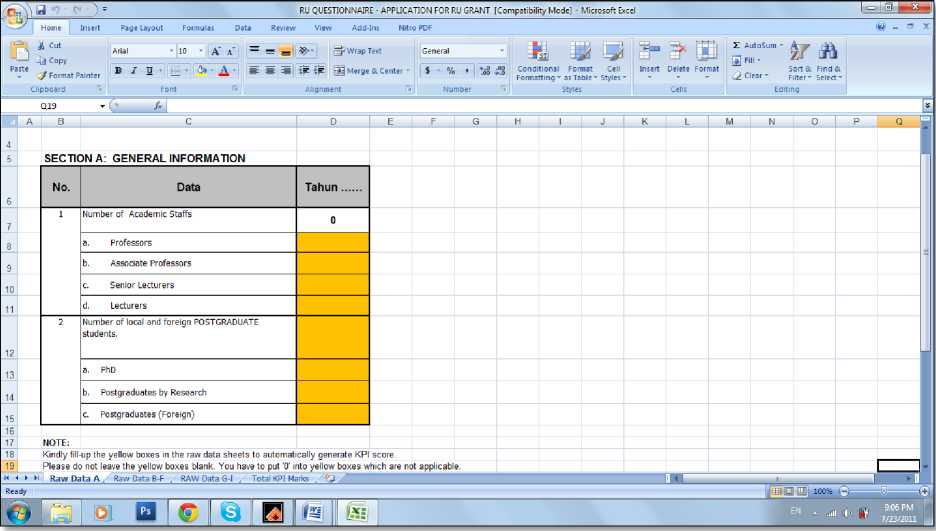
Figure 4: The interface of KPI form in the Excel Spreadsheet system showing the cell-based method of data entry to be confusing and prone to error.
Three workshops were conducted to introduce KPI-MS to staff responsible for monitoring KPIs in their respective schools and centres. Altogether, 78 staff from 42 schools and centres in a higher education institution of Malaysia participated in these workshops. The breakdown of the participants according to the workshops were 19 participants during Workshop 1, 8 participants for Workshop 2 and the largest group was 51 participants for workshop 3. The workshops were held in all three campuses of the institution.
All the three workshops began with a brief explanation of the importance of the MyRA instrument as the KPI achievement of the institution. This was then followed by an explanation on the institution’s KPIs and some of the problems encountered by the Corporate and Sustainable Development Division ( Bahagian Pembangunan Lestari dan Korporat , acronymed BPLK in the local language) in collecting, collating and processing KPI data for schools and centres in the institution. The participants were then introduced to the KPI-MS system and were demonstrated the capabilities and functions of the KPI-MS system. A hands-on session was carried out to allow the participants to explore and use the KPI-MS system with their own data that were already available in their ESS. To facilitate the use of the new system, a user manual was also given to the participants during the hands-on session to allow them to use the KPI-MS system on their own. The experience of using the KPI-MS thus allowed the participants to make comparison with the ESS that they have been using since the implementation of MyRA in 2008.
-
A. Participants
Among the 78 participants, 34 were males and 44 were females. Each School or Centre was represented by at least one participant. Participants were either lecturers or administrative officers. The questionnaire showed that the staff in-charge of KPI data management have a wide range of working experience. Almost half of the participants (48.72%) have 1-5 years of working experience. The rest have 6-10 years (21.80%), 11-15 years (11.54%), 16-20 years (7.69%), and 21-25 years (5.13%) of experience. Only 2.56% each had 26-30 and more than 31 years of working experience.
-
B. Research instrument
A study on the effectiveness of the new KPI-MS was done by conducting a campus-wide questionnaire survey amongst users exposed to the traditional and new methods, ie. ESS and KPI-MS methods, respectively. At the end of the workshop, all participants were requested to fill-in a questionnaire form to rate the KPI-MS system and the ESS system in terms of their 1) Perceived Usefulness, and 2) Perceived Ease-of-Use. The research instrument consists of 4 background information items, 13 items on the perceived usefulness and 11 items on the perceived ease of use. This instrument was adapted from Davis’ Technology Acceptance Model (TAM) and the content validated by three experts each in the field of systems development, instructional technology and psychometrics. The reliability of this instrument has a Cronbach’s alpha value of 0.955.
-
III. DATA ANALYSIS
In analyzing the results, responses from the 4 BPLK participants and 1 participant from the Centre of Knowledge, Communication & Technology ( Pusat Pengetahuan Komunikasi dan Teknologi, acronymed as PPKT in the local language) were excluded as they attended the workshop merely for the purpose of getting to know the system for management of KPI data. Both centres are not governed by the MyRA system as BPLK is an administrative centre while PPKT is an ICT service centre of the institution. Prior to analysis of the results, the responses of the participants were screened. It was found that 14 participants have not used the ESS before and thus did not provide responses for rating of the ESS system. 2 participants only responded to the rating of the ESS but failed to rate the KPI-MS system. Thus, the responses from these participants (16 of them) are incomplete for the purpose of making comparison between the ESS and the KPI-MS systems, and were excluded from the comparison study. The results reported in this paper were obtained based on the 62 participants of the workshops from the Schools and Centres which had prior exposure to the ESS and KPI-MS.
The arithmetic mean ratings for each item were computed for the purpose of comparison. The total scores of each respondent in terms of ‘Perceived ease of use’ and ‘Perceived usefulness’ were also computed and compared. For checking of the construct measured by the questionnaire, the reliability of the 2 constructs was computed separately for its internal consistency. For “Perceived Usefulness”, the value of the Cronbach’s alpha was 0.915 and for “Perceived Ease of Use”, it was 0.945. These indices indicate a very high consistency within the constructs being measured. Overall, the reliability of the questionnaire was 0.955.
-
IV. RESULTS AND DISCUSSION
-
A. Comparing “Perceived Usefulness” of KPI-MS with ESS
Table I. shows the data which compare the mean of the usefulness scores rated by the users that were exposed to both the KPI-MS and ESS management systems. The significant values ( p -values) were obtained by comparing the means between mean scores using the paired-sample t-test.
TABLE I. DIFFERENCES BETWEEN GROUPS USING THE PAIRED-SAMPLES T-TEST
|
Group |
Mean (μ) |
SD |
Sig.( p -value) |
|
|
Usefulness Score |
KPI-MS |
47.19 |
4.69 |
0.000 |
|
ESS |
30.51 |
5.89 |
* Significant at p < 0.05
The result showed that the users rated the KPI-MS significantly better (p=0.000) compared to ESS as indicated by the much higher means in the usefulness score of the former. This finding conformed to the results obtained from several studies, such as that conducted by Davis [7]. Davis’ study had proved that the attitude towards using an informational system is highly related to the usefulness of the system. The usefulness score obtained in this study will definitely help to improve the system through design in order to be accepted by the users. In addition, the ESS which is not able to generate reports easily and formulae that can easily be corrupted obtained a significantly lower ‘usefulness’ mean score compared to KPI-MS. The lower mean score indicates that users prefer to use KPI-MS compared to ESS in storing and monitoring their KPIs marks. Table I. shows the mean values rated by the users for the two systems.
-
B. Comparing “Perceived Ease-of-Use” of KPI-MS System with ESS System
In terms of “Ease of Use” of the system, the results again showed that the KPI-MS was consistently superior to the ESS system. Users rated the KPI-MS significantly better ( p =0.000) compared to ESS where the mean in the ‘ease-of-use’ score of the KPI-MS is much higher. Even though the ESS system has been in use since 2008, the results did not indicate that it is easier to use. This, notwithstanding the fact that the KPI-MS is a new development, most participants found the KPI-MS significantly easier to use. The users might be facing problems when they had accidentally modified the formula in the ESS which is difficult to detect or correct. In addition, the SD for all items is smaller than that in the rating of the ESS system. This shows that the participants’ ratings are similar with little difference for all the evaluated items. In contrast, the higher SD value of the ESS system shows a larger difference in ratings for the users. This may be explained by the fact that users who have had more experience in working with ESS will find it is easy to use whereas less experience users will find the ESS system more difficult to use. Testing on the ease-of-use of these systems is also important as it also determines the users’ intention to use the system. Table II. shows the mean values obtained for each of the items in terms of ‘ease-of-use’ for both KPI-MS and ESS.
TABLE II. DIFFERENCES BETWEEN GROUPS USING THE PAIRED-SAMPLES T-TEST
|
Group |
Mean (μ) |
SD |
Sig.( p -value) |
|
|
Ease-of-use Score |
KPI-MS |
38.76 |
4.242 |
0.000 |
|
ESS |
27.90 |
13.884 |
* Significant at p < 0.05
-
C. New Features of KPI-MS that are accepted by the users
As indicated in Table III., all five new features of the KPI-MS were well received by the participants of the workshops. The feature on “instantaneous charting” was especially well received as it has the highest rating with a mean Likert score of 3.81, (scale 1-4) useful. The other four features on “Networking capability”, “Data Security”, “BPLK online feedback” and “Multiuser” were rated slightly lower but were, nonetheless, considered as “very useful” as their mean scores were greater than 3.00. However, the large standard deviation for “Data Security” shows that there is a big difference of ratings on this feature by the participants. The results obtained showed that all of these features are well accepted and needed by all the users to make their job easier.
Table III. New Features of KPI-MS.
|
Features of KPI-MS |
Mean Likert score |
Standard Deviation (S.D.) |
|
Networking capability |
3.51 |
0.50 |
|
Data security |
3.53 |
1.10 |
|
Multiuser capability |
3.61 |
0.83 |
|
Instantaneous charting capability |
3.81 |
0.74 |
|
BPLK online feedback |
3.68 |
0.47 |
*Mean Likert score on a scale of 1-4.
-
V. CONCLUSION
Overall, the KPI-MS was shown to be superior to the ESS in terms of usefulness and ease-of-use. Since the KPIs marks are also used by the institution to benchmark/rank schools’ and centres’ and determine monetary incentives, the ‘usefulness’ and ‘ease-of-use’ of the system is very important.
KPI-MS was also found to be very useful in terms of enhancing accessibility of the KPIs data on-line, and presenting more information in a clear and uncluttered manner. Users were particularly pleased with the graphical visualization of their KPIs data which is not available in the current Excel spreadsheet system. In addition to data security, the new features that are available in the KPI-MS, such as instantaneous charting capability, networking capability, and the BPLK online feedback, were also very well received by the participants in the management of their schools’ and centres’ KPI data.
In terms of ‘user-friendliness’, even though the KPI-MS is new compared to the Excel system which has been in used for the past four years, participants rated the KPI-MS significantly higher than the Excel method, this notwithstanding the fact that Excel is a ubiquitous software.
In conclusion, it is clear that the KPI-MS system is accepted in terms of its ‘usefulness’ and ‘ease-of-use’ by the institution community.
ACKNOWLEDGEMENT
This study was done under the Research University (RU) grant.
References Comparing the Acceptance of Key Performance Indicators Management Systems on Perceived Usefulness and Perceived Ease of Use in a Higher Education Institution in Malaysia
- Xiong, G., Qin, T., Wang, F., Hu, L., & Shi, Q. (2010). Design and improvement of KPI system for materials management in Power Group Enterprise. IEEE, 171-176.
- Arash, S., & Mahbod, M. A. (2007). Prioritization of key performance indicators: An integration of analytical hierarchy process and goal setting. [Article]. International Journal of Productivity & Performance Management, 56(3), 226-240.
- Chan A. P. C., & L., C. A. P. (Apr 2004). Key performance indicators for measuring construction success. Benchmarking: An International Journal, 11(2), 203-216 (214 pages). doi: 10.1108/14635770410532624
- Breakwell, G. M., & Tytherleigh, M. Y. (2010). University leaders and university performance in the United Kingdom: is it 'who' leads, or 'where' they lead that matter most? Science+Business Media 60, 491-506. doi: 10.1007/s10734-010-9311-0
- Davis, F. D. (1986). A technology acceptance model for empirically testing new end-user information systems: theory and results. Doctorial Doctorial Dissertation, Massachusetts Institute of Technology.
- Davis, F. D. (1989). Perceived usefulness, perceived ease of use, and user acceptance of information technology. Management Information Systems Research Center, University of Minnesota, 13(3), 319-340. doi: 10.2307/249008
- Davis, F. D. (1993). User accceptance of information technology: system characteristics, user perceptions, and behavioural impacts. Int. J. Man-Machine Studies, 38, 475-487.
- Ramayah, T., & Ignatius, J. (2005). Impact of perceived usefulness, perceived ease of use and perceived enjoyment on intention to shop online. ICFAI Journal of Systems Management (IJSM, III(3), 36 – 51.
- Parka, N., Roman, R., Lee, S., & Chung, J. E. (2009). User acceptance of a digital library system in developing countries: An application of the Technology Acceptance Model. International Journal of Information Management, 29, 196–209.
- Ong, M. Y., Muniandy, B., Ong, S. L., Tang, K. N., & Phua, K. K. (2011). User acceptance of a key performance indicators monitoring system (KPI-MS) in a higher education institution in Malaysia: A pilot study. Paper presented at the 5th International Malaysian Educational Technology Convention, Kuantan, Pahang, Malaysia.
- Muniandy, B., Ong, M. Y., Phua, K. K., & Ong, S. L. (2011a). Assessing Key Performance Indicators Monitoring System (KPI-MS) of a university using Technology Acceptance Model. International Journal of Social Science and Humanity, 1(3), 171-176.
- Muniandy, B., Ong, M. Y., Phua, K. K., & Ong, S. L. (2011b). User Acceptance of a Key Performance Indicators Monitoring System (KPI-MS) in Higher Education: An Application of the Technology Acceptance Model. Paper presented at the 2nd International Conference on Education and Management Technology, Shanghai, China.
