Comparison of data clustering methods for automatic determination of granulation in a genetic fuzzy system

Author: Pleshkova T.S., Stanovov V.V.
Journal: Siberian Aerospace Journal @vestnik-sibsau-en
Section: Informatics, computer technology and management
Article in issue: 1 vol.23, 2022.
Free access
The paper proposes the use of clustering methods to determine the most appropriate number of fuzzy terms when building a genetic fuzzy system. At the same time, a fuzzy logic system is used to solve data classification problems and is automatically generated by a genetic algorithm. We used a genetic algorithm with the encoding of terms and classes in a binary string, while each individual encoded a rule base. To build a rule base, it is necessary to set such a parameter as the number of fuzzy terms, since it significantly affects the quality of the generated classifiers. A comparison of the most well-known algorithms such as DBSCAN, k-means and the mean shift algorithm was carried out to identify the best data clustering meth-od. Computational experiments were carried out on several data sets to evaluate the effectiveness of the selected number of fuzzy terms. According to the results, it was determined that the mean shift algorithm selects such a number of terms that allows building more accurate classifiers in comparison with two other methods involved in testing. A comparison was also made with alternative classification methods such as k nearest neighbors, support vector machines and neural networks, as a result of which the proposed method showed comparable classification quality. The developed approach to automating the determination of the number of terms makes it possible to exclude manual selection of granulation for various data, reducing the cost of creating an effective fuzzy system for the classification problem.
Classification, fuzzy logic, genetic algorithm, DBSCAN, k-means, mean shift algorithm
Short address: https://sciup.org/148329605
IDR: 148329605 | UDC: 519.87 | DOI: 10.31772/2712-8970-2022-23-1-33-42
Text of the scientific article Comparison of data clustering methods for automatic determination of granulation in a genetic fuzzy system
Classification is an important tool for data analysis. Its essence is to group objects into classes according to their common features. It is known that classification is a necessary step in understanding any field of study [1]. At the moment, there are various methods that allow solving classification problems. But many modern and popular methods are a kind of black box [2], which receives data as input and outputs a response, but performs a classification without providing information about the processes occurring inside.
Not all problems allow using black boxes, since often, depending on the field of study, it is necessary to understand which features influenced the classification result. Interpretable classification is used for many problems in which it is important to be able to justify solutions and explain the result, especially for those problems in which the cost of error is too high. Such problems include the classification of various equipment for space applications. Therefore, when studying various methods used to classify data, it was decided to use evolutionary algorithms to build systems based on fuzzy logic (FL) [3].
Fuzzy logic was proposed by the American mathematician Lotfi Zade with the aim of describing the vague definitions of natural language [4]. The FL approach imitates the way a person makes decisions and instead of clear concepts of true (1) and false (0) includes all intermediate values between 0 and 1. In fuzzy classification, each object is considered to be assigned to all classes with certain degrees of membership, which in its turn indicate the strength of association between the object and the corresponding class [5]. Therefore, one of the important stages is the selection of a fuzzy rule base, which is a set of independent rules. Each of them expresses a cause-effect relationship between the input variables and the corresponding class using a fuzzy set or terms [6].
In this case, there is a problem of selecting fuzzy granulation (terms), since the number of terms depends on the data. The solution of this problem is a multilevel process, so the paper will focus on creating a rule base using a genetic algorithm, selecting fuzzy granulation using data clustering, describing experiments, results and directions for future research.
Building a rule base by a genetic algorithm
As it was mentioned earlier, the quality of the selected rule base (RB) affects the classification accuracy (the percentage of correctly classified objects using the selected RB) and interpretability, so the developed algorithm uses the search for RB using a genetic algorithm (GA) [7]. It is worth noting that the hybridization of GA and FL has already been considered earlier, for example, in [6], a selfadjusting evolutionary algorithm for the formation of fuzzy systems is proposed for solving classification problems with the representation of rule bases in the form of matrices of variable dimension. In [8], an algorithm was developed that is a hybridization of the Pittsburgh and Michigan approaches, which is implemented in the framework of evolutionary multicriteria optimization.
Genetic algorithms are part of evolutionary search algorithms, which combine various options for using evolutionary principles to achieve the goal. GAs allow searching for the optimal solution for a wide range of applied solutions. GA is divided into several stages: population initialization, selection, crossing, mutation, and formation of a new generation [9]. The search process starts with a set of individuals or with a population. An individual is characterized by a set of parameters (variables) known as genes. Genes are combined in a chain, forming a chromosome. The size of a chromosome can vary depending, as in this work, on the number of terms or classes. The number of bits per chromosome can be determined by the formula (1)
len = (var • bt + bc ) • m,
wherevaris the number of variables in the data sample; bt is the number of bits required to encode one term; bc is the number of bits required to encode one class; m is the number of rules.
A graphical representation of the encoding of a rule into a chromosome with three terms is shown in fig. one.
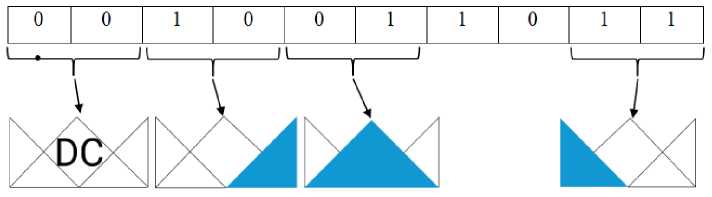
Fig. 1. Graphical representation of encoding a rule into a chromosome
Рис. 1. Графическое представление кодирования правила в хромосому
It is worth noting that a different number of terms was considered in the work, namely from 2 to 7 (Fig. 2).
In the beginning the initial population is created randomly, and an array is filled in. The array has the dimension of the number of individuals N, multiplied by len. After creation and filling, it is necessary to translate the binary array into a phenotype, i.e., a rule that is a sequence of integers encoding the numbers of terms. In the future, these rules are used to assess the accuracy of the RB.
Translation is carried out first for the bits allocated for variables, i.e., every bt positions in a string of length len are considered. When translating, it is worth considering an additional term - ignoring, which allows simplifying the rules and the RB itself as a whole. And then the translation is done for the last bc bits allocated for the class.
After translation, the quality of the individual, i.e., the accuracy of the RB, is determined using the fitness function. The class is determined using formula (2) (determination of the winning rule). To determine the winning rule, it is necessary for each of the rules to calculate the minimum by membership degrees for all variables [6]. The winning rule will be determined with the maximum membership degree.
N Rule = arg max(min( 4 jm f ( X f ))), (2)
mf, where N is the number of the winning rule; m is the number of rules; j is an element of the
rule; µ is the membership degree; x is a variable with index f [6].
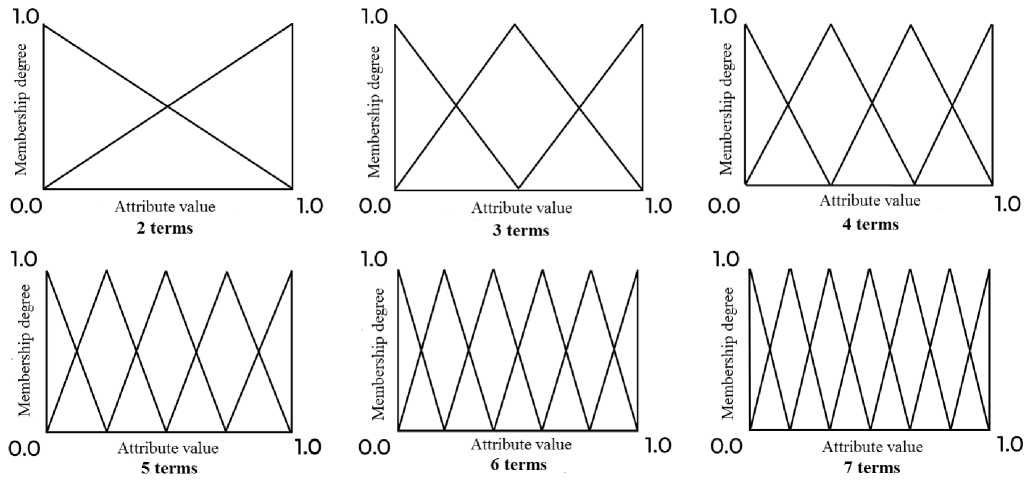
Fig. 2. Visual display of different number of terms
Рис. 2. Визуальное отображение различного количества термов
After obtaining a fitness score for each individual, we can determine the probability of selecting a particular individual for reproduction. On the basis of our own calculations and analysis of works [6; 10; 11] tournament selection with Т = 2, single-point crossing and average mutation were chosen as GA parameters. The block diagram of the GA is shown in fig. 3.
Population initialization 2 bits per term
|
0 |
1 |
1 |
0 |
0 |
1 |
|
|
1 |
0 |
1 |
0 |
1 |
1 |
|
|
0 |
1 |
1 |
1 |
0 |
0 |
|
Tournament selection (selection of fitter individuals) |
Single-point crossing |
Average mutation |
Formation of a new generation (after the appearance of new individuals it is necessary to clear |
|
|
o|1 1 1 |0| 0| 1 1 a fitter one |
.1 1 0 1 о 1 1 |
1 i 1 i 1 i 1 о 1 о 1 i 1 |
||
|
ill1 |
0 1 11 o| 1 |
|l|l|0|0|0|l| |
the population of |
|
|
1 0 1 1 1 1 11 I 0| 0 |
11 |
old ones) |
||
|
a less fit one |
I 1 I 1 I 1 0 1 0 1 I |
|||
The stages are repeated until the result is satisfactory or the condition is met that the maximum number of generations has been passed.
Fig. 3. Block diagram of a genetic algorithm
Рис. 3. Структурная схема генетического алгоритма
It should be noted that the efficiency of the GA is strongly influenced by the configuration of its parameters, the choice of which depends on the problem being solved, so determining the required set is an additional study.
Algorithm testing
Testing was performed on normalized data from the UCI Machine Learning repository [12]. The description of the characteristics of the samples is presented in Table 1.
Table 1
|
Sample |
Number of measurements |
Number of variables |
Number of classes |
|
Australian credit |
690 |
14 |
2 |
|
Iris |
150 |
4 |
3 |
|
Seeds |
210 |
7 |
3 |
|
Glass |
214 |
9 |
6 |
|
Ionosphere |
351 |
34 |
2 |
Characteristics of test datasets
In the process of testing the algorithm, the following parameters were selected: the number of rules, the number of terms. The selection was carried out by enumeration, a cycle by terms was implemented, in which there was a cycle according to the rules. The algorithm was run with the following parameters: the number of individuals - 100, the percentage of sample splitting - 80/20, the number of generations - 800, the splitting was random, not stratified. After every hundred generations, the accuracy was measured, i.e., the percentage of correctly classified objects on the test set, which did not participate in the learning process. Accuracy is measured to analyze the quality of the algorithms work process. The average value was calculated for 10 runs. The classification results for the Ionosphere sample can be found in Tables 2, 3 for two and three terms, respectively.
Table 2
Results of the data classification algorithm on the Ionosphere sample, 2 terms
|
Number of rules Number of generations |
3 |
4 |
5 |
6 |
7 |
8 |
9 |
10 |
11 |
12 |
|
300 |
0,765 |
0,787 |
0,762 |
0,772 |
0,768 |
0,746 |
0,763 |
0,737 |
0,786 |
0,772 |
|
400 |
0,765 |
0,787 |
0,763 |
0,776 |
0,765 |
0,746 |
0,763 |
0,735 |
0,785 |
0,773 |
|
500 |
0,768 |
0,790 |
0,763 |
0,776 |
0,765 |
0,744 |
0,761 |
0,735 |
0,786 |
0,772 |
|
600 |
0,769 |
0,790 |
0,763 |
0,776 |
0,765 |
0,744 |
0,759 |
0,735 |
0,787 |
0,772 |
|
700 |
0,772 |
0,792 |
0,766 |
0,775 |
0,779 |
0,744 |
0,759 |
0,735 |
0,787 |
0,770 |
|
800 |
0,772 |
0,792 |
0,766 |
0,777 |
0,779 |
0,744 |
0,759 |
0,735 |
0,790 |
0,770 |
Table 3
Results of the data classification algorithm on the Ionosphere sample, 3 terms
|
Number of rules Number of generations |
3 |
4 |
5 |
6 |
7 |
8 |
9 |
10 |
11 |
12 |
|
300 |
0,548 |
0,546 |
0,580 |
0,573 |
0,566 |
0,559 |
0,572 |
0,600 |
0,576 |
0,577 |
|
400 |
0,548 |
0,546 |
0,580 |
0,575 |
0,565 |
0,562 |
0,570 |
0,600 |
0,575 |
0,579 |
|
500 |
0,549 |
0,546 |
0,580 |
0,575 |
0,565 |
0,561 |
0,570 |
0,600 |
0,576 |
0,579 |
|
600 |
0,549 |
0,546 |
0,585 |
0,583 |
0,565 |
0,559 |
0,573 |
0,600 |
0,576 |
0,579 |
|
700 |
0,549 |
0,548 |
0,585 |
0,587 |
0,569 |
0,559 |
0,577 |
0,600 |
0,576 |
0,579 |
|
800 |
0,551 |
0,546 |
0,585 |
0,590 |
0,573 |
0,568 |
0,577 |
0,600 |
0,577 |
0,579 |
Analyzing tables 2 and 3, we can conclude that the highest classification accuracy is achieved with different parameters, i.e., there is a dependence of the classification accuracy on the number of terms. To solve the problem of determining the best number of terms, various algorithms can be used, but below in the paper a comparison of data clustering methods for automatically determining the number of terms is carried out.
Automatic determination of fuzzy granulation
Fuzzy granulation can be determined in various ways. In this paper, the problem is solved using data clustering, so the following methods are compared:
-
1. The DBSCAN method (Density-based spatial clustering of applications with noise), a variation of this algorithm was considered in [13]. The “number of neighbors” parameter for various data sets was calculated as half of the number of objects in the class containing the least number of objects. The “radius of the ε -neighborhood” parameter was generated from a normal distribution with a mean value equal to the mean Euclidean distance for one variable, and a standard deviation equal to the standard deviation of distances for the same variable.
-
2. The k-means method using the elbow method as an assessment metric (a criterion for the quality of clustering assessment) [14]. The elbow method is based on finding distortion, i.e., the sum of the squared distance (SSE) between the data points and the centroids of their assigned clusters [15]. To determine the best number of terms in the algorithm, a search of numbers from 2 to 7 and an assessment of how well different k clusters fit the sample were made.
-
3. Mean Shift [16] is a non-parametric algorithm used in unsupervised learning. The advantage of this algorithm is that it is not necessary to specify the number of clusters in advance, since the average shift algorithm will determine the number immediately from the data.
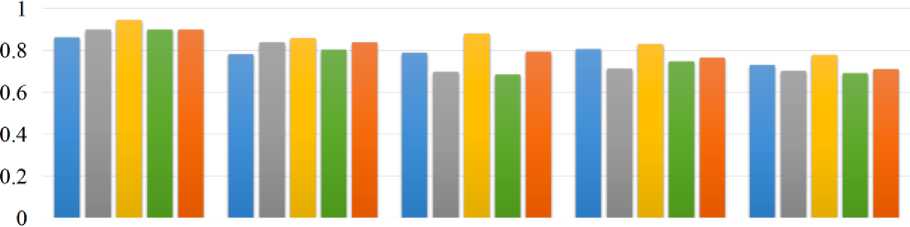
The results of the experiments are presented in Fig. 4 and table 4, where the best accuracy and number of terms for various data are highlighted in bold.
Iris Australian Ionosphere Seeds_dataset Glass
-
■ Selection of terms
Application of the DBSCAN method with increased resource
-
■ Selection of terms with increased resource
Application of the k-mcans method with increased resource
-
■ Application of the Mean Shift method with increased resource
Fig. 4. Visualization of results of comparison of clustering methods
Рис. 4. Визуализация результатов сравнения методов кластеризации
Initially, the selection of terms was carried out on 100 individuals. When testing, the number of individuals was increased to 300, which gave better results. In fig. 4 this improvement is designated as the selection of terms with an increased resource.
According to the results presented in table 4 and in fig. 4, we can conclude that the Mean Shift method more accurately predicts the number of terms for a different data set. DBSCAN and k-means are inferior on some samples.
The results of the best configurations of the algorithm for various samples can be found in table 5.
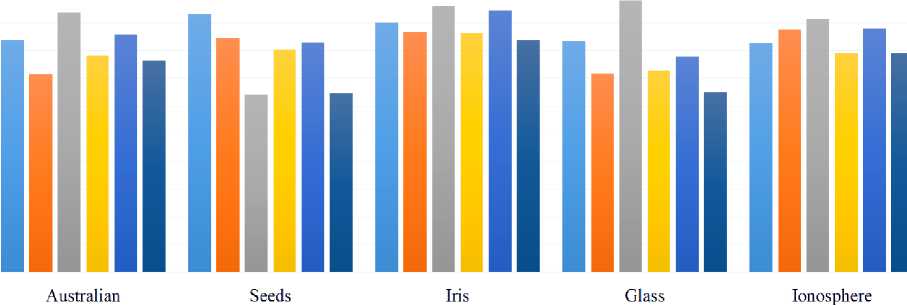
The developed classification algorithm was also compared with alternative approaches: k nearest neighbor, support vector machines, neural networks. The data are shown in fig. 5.
The results of the data classification algorithm using various methods
The best configurations of the data classification algorithm on all samples
Table 4
|
Data |
Method |
Number of terms |
Best accuracy |
|
Iris |
DBSCAN |
2 |
0,837 |
|
k-means |
3 |
0,847 |
|
|
Mean Shift |
2 |
0,837 |
|
|
Australian |
DBSCAN |
2 |
0,783 |
|
k-means |
3 |
0,779 |
|
|
Mean Shift |
5 |
0,774 |
|
|
Ionosphere |
DBSCAN |
3 |
0,590 |
|
k-means |
4 |
0,575 |
|
|
Mean Shift |
2 |
0,792 |
|
|
Seeds |
DBSCAN |
2 |
0,558 |
|
k-means |
3 |
0,647 |
|
|
Mean Shift |
3 |
0,647 |
|
|
Glass |
DBSCAN |
3 |
0,649 |
|
k-means |
3 |
0,649 |
|
|
Mean Shift |
3 |
0,649 |
Table 5
|
Data |
Iris |
Australian |
Ionosphere |
Seeds |
Glass |
|||||
|
Number of terms |
4 |
2 |
2 |
4 |
4 |
|||||
|
Number of rules Number of generations |
4 |
5 |
5 |
10 |
4 |
11 |
6 |
7 |
7 |
8 |
|
300 |
0,860 |
0,863 |
0,776 |
0,781 |
0,787 |
0,786 |
0,793 |
0,805 |
0,702 |
0,727 |
|
400 |
0,860 |
0,863 |
0,776 |
0,781 |
0,787 |
0,785 |
0,795 |
0,805 |
0,702 |
0,729 |
|
500 |
0,860 |
0,863 |
0,776 |
0,783 |
0,790 |
0,786 |
0,805 |
0,805 |
0,704 |
0,729 |
|
600 |
0,860 |
0,863 |
0,774 |
0,783 |
0,790 |
0,787 |
0,807 |
0,805 |
0,704 |
0,729 |
|
700 |
0,860 |
0,863 |
0,774 |
0,783 |
0,792 |
0,787 |
0,805 |
0,805 |
0,709 |
0,729 |
|
800 |
0,860 |
0,863 |
0,774 |
0,783 |
0,792 |
0,787 |
0,805 |
0,805 |
0,709 |
0,729 |
Analyzing the data presented in fig. 5, we can conclude that the proposed developed algorithm is inferior in accuracy to the MLP and k nearest neighbor methods, but on some data sets it is better than the SVM method or comparable to it. But with an increase in volume resources up to at least 300 indi- viduals, the algorithm shows better results. The use of the Mean Shift method is inferior in accuracy to the developed algorithm, but it automates the determination of the number of terms for different samples.
lain (к = 5)
SVM
MLP
Developed algorithm
■ Developed algorithm with increased resource
■ Application of the Mean Shift method with increased resource
-
Fig. 5. Visualization of results of comparison of clustering methods
Рис. 5. Визуализация результатов сравнения методов кластеризации
Conclusion
The paper proposes an algorithmic scheme for data classification using a genetic fuzzy system and automatic determination of fuzzy granulation by data clustering. The algorithm was tested on various data sets with various parameters, and the best configurations were analyzed. Automation of the determination of granulation by various methods was carried out on the basis of the available information. The comparison showed that the Mean Shift method is the most suitable for determining the number of terms. The application of this method shows a slight decrease in accuracy on some data, but its application can significantly reduce the running time of the main algorithm due to the absence of the need for multiple runs. A comparison was also made with the most popular algorithms for data classification - neural networks, k nearest neighbor and the support vector machines, which showed that the developed algorithm is not much inferior in accuracy, but future work will focus on improving the classification accuracy. The main advantage is the ability to interpret the decision-making process, therefore, the hybridization of evolutionary algorithms and fuzzy logic requires further research. In future works it is also planned to implement alternative hybridization approaches to improve the accuracy of the algorithm.
