Comprehensive assessment of integration activity of business structures in Russian regions

Author: Karelina Mariya Gennadevna
Journal: Economic and Social Changes: Facts, Trends, Forecast @volnc-esc-en
Section: Regional economy
Article in issue: 5 (47) т.9, 2016.
Free access
In the context of economic sanctions and growing international isolation, the research into regional differences in integration development acquires special relevance for Russia; this fact determines the need for a comprehensive assessment of integration activity of business structures in Russian regions. The diversity of approaches to the study of problems and prospects of economic integration and the current debate about the role of integration processes in the development of regional economies determined a comprehensive approach to the concepts of “integration” and “integration activity” in order to create objective prerequisites for analyzing integration activity of business structures in the regions of Russia. The information base of the research is the data of Russian information and analytical agencies. The tools used in the research include methods for analyzing structural changes, methods for analyzing economic differentiation and concentration, nonparametric statistics methods, and econometric analysis methods...
Business structure, integration activity, regional economy, mergers and acquisitions, structural changes, econometric approach
Short address: https://sciup.org/147223866
IDR: 147223866 | UDC: 332.14 | DOI: 10.15838/esc.2016.5.47.6
Text of the scientific article Comprehensive assessment of integration activity of business structures in Russian regions
In recent decades the role of economic integration in the system of economic relations of any state has increased significantly. The scope and level of economic integration are largely macroeconomic indicators showing effective functioning of the national economy and its institutions. Integration processes in modern Russian conditions help restore the structural integrity of the national economy, align spatial characteristics of the country’s industrial potential, boost innovative business activity, enhance competitiveness of domestic products, which is a crucial factor in domestic economic reindustrialization [3].
Research on integration activity of business structures in Russia’s regions should begin with clarifying fundamental categories that describe it. The term “economic integration” appeared in the 1930s in the works of German and Swedish economists, but no general theory of integration has been established so far [6]. Theoretical schools focusing their attention on separate sides of the integration process give different definitions of integration as an economic phenomenon. Therefore, traditionally there exist different approaches to the interpretation of main categories characterizing the integration process [23]. A.B. Borisov’s Comprehensive Dictionary of Economics contains one of the most succinct definitions of integration: integration (from the Latin word integer – whole) is an association of economic subjects, deepening of their interaction, and development of relations between them. Economic integration takes place both at the level of national economies of entire countries and at the level of individual businesses [24].
According to the synergetic paradigm describing the laws of development of complex systems, evolutionary processes are based on the ability of such systems to streamline the internal structure by strengthening the relationships between structural elements. Applying this principle to the study of production integration process helps formulate the concept of integration activity , which refers to the economic activities of economic entities, aimed to deepen and promote cooperation, linkages and coordination to ensure that business entities make a more extensive use of their competitive advantages and achieve synergetic effect from the association.
As a matter of fact, the research on specifics of development of integrated corporate business structures in Russia and the studies of challenges for socioeconomic development in Russian regions are mostly carried out independently from each other – by different scientists, experts and various research and analytical agencies. As a result, despite the fact that quite a few works on integration activity of economic entities at the level of the Russian economy as a whole have been recently published (for example, I.G. Vladimirova, Yu.V. Ignatishin, S.V. Gvardin, M.M. Musatova, N.B. Rudyk, etc.), the analysis of integration activity of business structures in the regions of Russia does not receive due attention1.
Thus, research into the differentiation of regional disparities of socio-economic indicators, including the integration activity of economic entities, becomes especially urgent for Russia. Moreover, research in this area should be based on comparable statistical information, since only in this case successive studies will be possible to perform. A comparative analysis of the data of information-analytical agencies has been carried out, and on its basis the database of the agency “Mergers and Acquisitions” has been chosen as a source of information for this study.
Statistical analysis of integration activity of business structures in the regional context
Uneven distribution of economic activity in Russia contributes to the differentiation of its constituent entities in terms of development. A growth in the differentiation of Russian regions can be explained by tough competition for scarce resources. In 2013, five regions contained 24.52% of Russia’s labor resources. Five regions leading in the volume of investment had 64.53% of such investments [13].
In modern conditions, business structures are an essential attribute of economic development in Russian regions. They operate in virtually all economic sectors and implement their projects in a significant number of regions [12, 18]. At that, socio-economic development of constituent entities of the Russian Federation is closely connected with the activities of entities located on its territory, i.e. it depends directly on the quantitative and qualitative results of performance of enterprises within Russian business structures in the long term. This relationship is manifested through investment and innovation components, through the support of social sphere, and compensations that Russian business structures pay for the use of resources and infrastructure of the territory [5, 16].
Table 1 presents descriptive statistics of the total value of the regional market of mergers and acquisitions for 2006–2013. The data in the table show that the minimum value of the total value of the regional M&A market in 2013 amounted to 63 million US dollars. At the same time, the distribution of the regions was nonuniform throughout the analyzed period (coefficient of variation ranges from 311.15 to 426.48%).
Table 1. Descriptive statistics of the total value of the regional market of mergers and acquisitions by RF subjects, 2006-2013
|
Indicator |
Value |
|||||||
|
2006 |
2007 |
2008 |
2009 |
2010 |
2011 |
2012 |
2013 |
|
|
1. Minimum value xmin, mln US dollars |
63 |
98 |
85 |
18 |
43 |
75 |
61 |
63 |
|
2. Maximum value xmax, mln US dollars |
27651 |
71010.4 |
77154 |
42343.6 |
73619 |
68514 |
11811 |
12005 |
|
3. Average value x ,, mln US dollars |
1015.3 |
2098.9 |
1910.6 |
922.1 |
912.3 |
1268.9 |
1368.9 |
1320.5 |
|
4. Variation coefficient υ , % |
343.1 |
426.48 |
347.9 |
383.23 |
354.87 |
311.5 |
399.2 |
398.78 |
|
5. Standard deviation σ , mln US dollars |
3483.6 |
8951.6 |
6648.9 |
3534.2 |
3237.4 |
3952.7 |
5463.8 |
5265.9 |
|
6. Asymmetry A |
7.84 |
7.78 |
7.91 |
7.86 |
6.93 |
6.01 |
5.60 |
5.72 |
|
7. Excess E |
10.94 |
11.35 |
12.71 |
12.13 |
11.05 |
11.35 |
11.56 |
11.48 |
Source: author’s calculations using the data of the information-analytical agency “Mergers and acquisitions”.
complete lack of integration activity in constituent entities such as Stavropol Krai, the Volgograd and Rostov oblasts, and the Republic of Ingushetia.
Let us consider individual factors in relative structural shifts with the variable base of comparison of the indicator “Total value of the regional M&A market” in each Federal District for 2004–2013 (Tab. 2) .
|
Federal District |
2005/ 2004 |
2006/ 2005 |
2007/ 2006 |
2008/ 2007 |
2009/ 2008 |
2010/ 2009 |
2011/ 2010 |
2012/ 2011 |
2013/ 2012 |
|
Central |
1.7 |
1.5 |
1.3 |
1.3 |
2.7 |
0.7 |
0.6 |
0.7 |
0.7 |
|
Northwestern |
0.3 |
0.4 |
3.9 |
1.3 |
0.9 |
1.4 |
0.4 |
0.3 |
0.4 |
|
Southern |
11.0 |
13.0 |
1.3 |
27.0 |
7.7 |
0.1 |
3.1 |
2.8 |
2.9 |
|
Volga |
0.2 |
0.1 |
9.7 |
0.5 |
4.1 |
0.2 |
1.2 |
0.9 |
0.9 |
|
Ural |
1.5 |
1.6 |
0.7 |
1.0 |
6.4 |
0.8 |
1.2 |
1.1 |
1.2 |
|
Siberian |
0.2 |
0.1 |
1.6 |
5.3 |
9.0 |
0.1 |
0.7 |
0.6 |
0.5 |
|
Far Eastern |
15.0 |
17.0 |
0.7 |
56.6 |
0.6 |
0.5 |
3.2 |
2.3 |
2.3 |
|
North Caucasian |
13.5 |
11.0 |
1.1 |
23.0 |
6.8 |
0.3 |
2.8 |
1.7 |
1.8 |
|
Source: author’s calculations using the data of the information-analytical agency “Mergers and acquisitions”. |
|||||||||
indicator. The maximum relative structural shift in 2004–2013 with the variable base of comparison was observed in the Far Eastern Federal District in 2008 (56.6 p.p.).
In order to study the mobility of structural changes of integration activity in regions of the federal districts we shall analyze structural changes in terms of the “number of merger and acquisition transactions”. The analysis of linear shift relative to structural shift with the constant base of comparison shows that structural changes in all federal districts of Russia in 2004–2013 are characterized as large structural shifts. The distribution of federal districts in 2013 by the value of linear structural shift is presented in Figure 1.
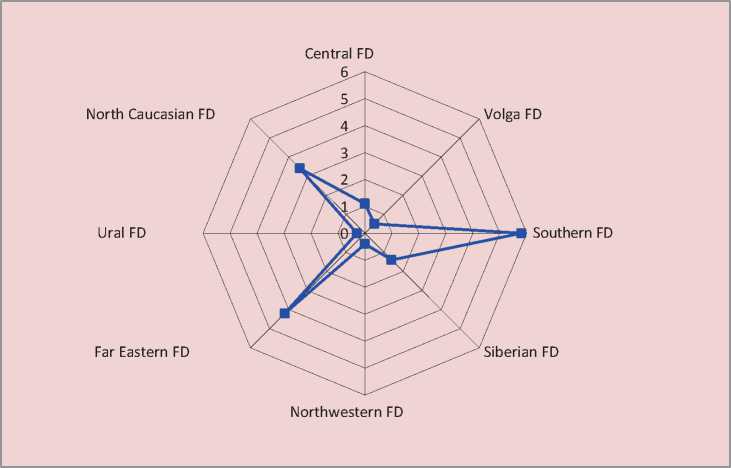
Source: author’s calculations using the data of the information-analytical agency “Mergers and acquisitions”.
In order to avoid the cancellation of changes in the weights of individual items opposite in the sign in the total volume, quadratic relative structural shifts in the structure of the number of M&A transactions and total value of M&A market at the federal level in 2013 to 2009 were calculated (Fig. 2) .
The impact of macroeconomic factors on mergers and acquisitions was noted by many foreign researchers. For example, Wu Changqi, Xie Ningling [21] argue that mergers and acquisitions depend on the external environment, that is, on factors such as growth/crisis of the economy, level of competition, and political and economic changes. Some researchers emphasize the importance of noneconomic, namely political, legal, etc. factors (Liu Yan, Liu Ming [25]).
During the crisis Russian business structures have significantly reduced the scale of export expansion and focused on the domestic market to address the problems of debt and restructuring their assets. Residents has taken a wait-and-
Figure 2. Relative structural changes, calculated by quantitative volume and total value of the market of mergers and acquisitions (2013, 2009)
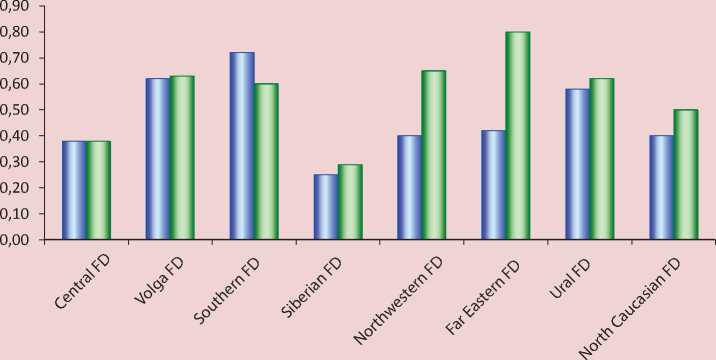
Source: author’s calculations based on the information-analytical agency “Mergers and acquisitions”.
see approach with regard to reducing or eliminating the gap between their price expectations and the expectations of sellers and therefore did not hurry to enter regional markets [10].
In order to support a hypothesis that there exists a significant divergence of mergers and acquisitions for corporate structures in Russian regions let us consider the dynamics of change in the coefficients of inequality of distribution of integration activity calculated in terms of “Total value of M&A market” for the quintile (20-percent) groups of regions for 2004– 2013. The fifth quintile group (leading regions) included entities such as Moscow, the Moscow Oblast, Saint Petersburg,
Yamalo-Nenets Autonomous Okrug, Republic of Tatarstan, etc.
The idea of the process of concentration of integration activity in the Russian Federation regions as a whole is given in Table 3 . For the period 2003–2012 the share of the fourth quintile group was relatively constant. In this case, the proportion of the first, second and third quintile groups decreased from 5.71 to 5.46%, i.e. for the studied 10 years, it dropped in 1.28 times.
The least integration-active first quintile group of regions was characterized by the most significant drop from 1.08 to 0.62% (decline in 1.74 times). At the same time the share of the most integration-active fifth quintile group increased in 1.02 times.
Table 3. Shares of quintile groups of Russian regions in the total cost volume of the market of mergers and acquisitions, %
|
2004 |
2005 |
2006 |
2007 |
2008 |
2009 |
2010 |
2011 |
2012 |
2013 |
|
|
Total value of M&A market |
100 |
100 |
100 |
100 |
100 |
100 |
100 |
100 |
100 |
100 |
|
Including by 20% groups of regions |
||||||||||
|
First (the least M&A activity) |
1.08 |
0.96 |
0.86 |
0.39 |
0.49 |
1.32 |
0.53 |
1.34 |
0.60 |
0.62 |
|
Second |
1.68 |
2.65 |
2.76 |
1.85 |
1.70 |
2.05 |
1.95 |
2.85 |
2.08 |
2.02 |
|
Third |
2.95 |
2.89 |
3.05 |
3.12 |
2.28 |
3.35 |
4.29 |
4.04 |
3.08 |
2.82 |
|
Fourth |
5.43 |
5.18 |
5.27 |
4.88 |
4.95 |
4.78 |
5.05 |
5.15 |
4.18 |
4.11 |
|
Fifth (the greatest M&A activity) |
88.86 |
88.32 |
88.06 |
89.76 |
90.58 |
88.50 |
88.18 |
86.62 |
90.06 |
90.43 |
|
Source: author’s calculations using the data of the information-analytical agency “Mergers and acquisitions”. |
||||||||||
The basis for calculating the Gini coefficient is to build the Lorenz curve, characterizing the accumulation of the feature depending on the accumulation of elements in the group [22]. According to the approach of V.A. Litvinov, the Gini coefficient, determining the degree of deviation of the actual distribution of the integration activity from the line of their possible uniform distribution, fully characterizing the process of concentration of integration activities for groups of subjects of the Russian Federation, only indirectly reflects the actual concentration in the narrow sense of the word, i.e. the desire to “pull” the entire integration activity of economic entities in one region [9].
Taking into account the above, we propose to use the Herfindahl concentration ratio in the study of regional integration in the activity of business structures when analyzing the concentration:
к = 2 d i , (1) i = 1
where di is the share of each group of regions in the total value of M&A.
This coefficient varies from 0 to 1. Unlike the Gini index, the Herfindahl coefficient is an indicator of “direct action” and indifferent to the line of a theoretically possible uniform distribution [20]. In other words, the Herfindahl coefficient takes the unequal distribution of integration activity as an axiom, and its changes reflect changes in the proportions between the groups, i.e., in the ratios of proportions of selected groups of regions in the total cost volume of the market of mergers and acquisitions.
Throughout the period 2004–2013, the Gini coefficient showed high values, indicating the uneven distribution of the integration activity in Russian regions (Fig. 3).
The highest value of the Gini coefficient is in 2007 (G2007=0.92), the lowest – in 2011 (G2011=0.74). During 2004–2013, the value of the Herfindahl coefficient did not fall below K2005 = 0.76, indicating a high concentration of the integration activity of Russian business structures. In addition, in 2013 there was an increase in the concentration of the integration activity by 1.92% compared to 2012.
Figure 3. Evolution of the values of the Gini coefficient and the Herfindahl coefficient for the integration activity of Russian regions in 2004–2013
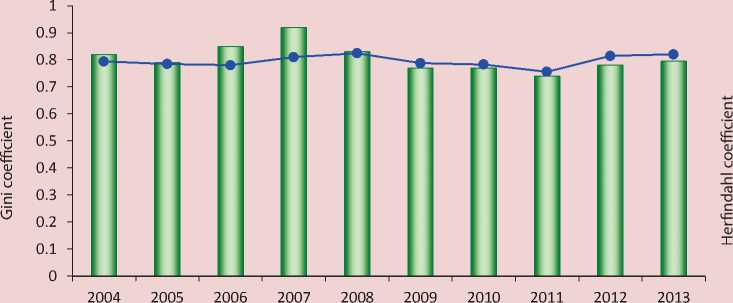
■ ■ Gini coefficient • Herfindahl coefficient
Source: author’s calculations according to the information-analytical agency “Mergers and acquisitions”.
and, therefore, it is necessary in its study to apply special indicators, such as quantile differentiation factors.
Thus, the economy of Russia is characterized by deformed spatial structure of the integration activity of business structures in the regions. Existing state and regional policies for the development of integration activities do not have a sufficient influence on the smoothing of imbalances in the distribution of areas of implementation of integration projects. All this indicates the need to adjust the state policy on increasing integration activity of Russian business structures in the regions of the Russian Federation, which should be based on a reasonable approach to multidimensional ranking of Russian regions by the level of integration activity.
Econometric approach to the measurement of regional integration activity
On the basis of significant domestic and foreign experience in assessing the development of territories, the work proposes an econometric approach for estimating regional integration activity , which helps not only estimate the value of the integration potential of the region, but also identify opportunities and reserves for regional economic growth, determine directions of the state policy in the field of promoting the integration development of business structures in Russia’s regions.
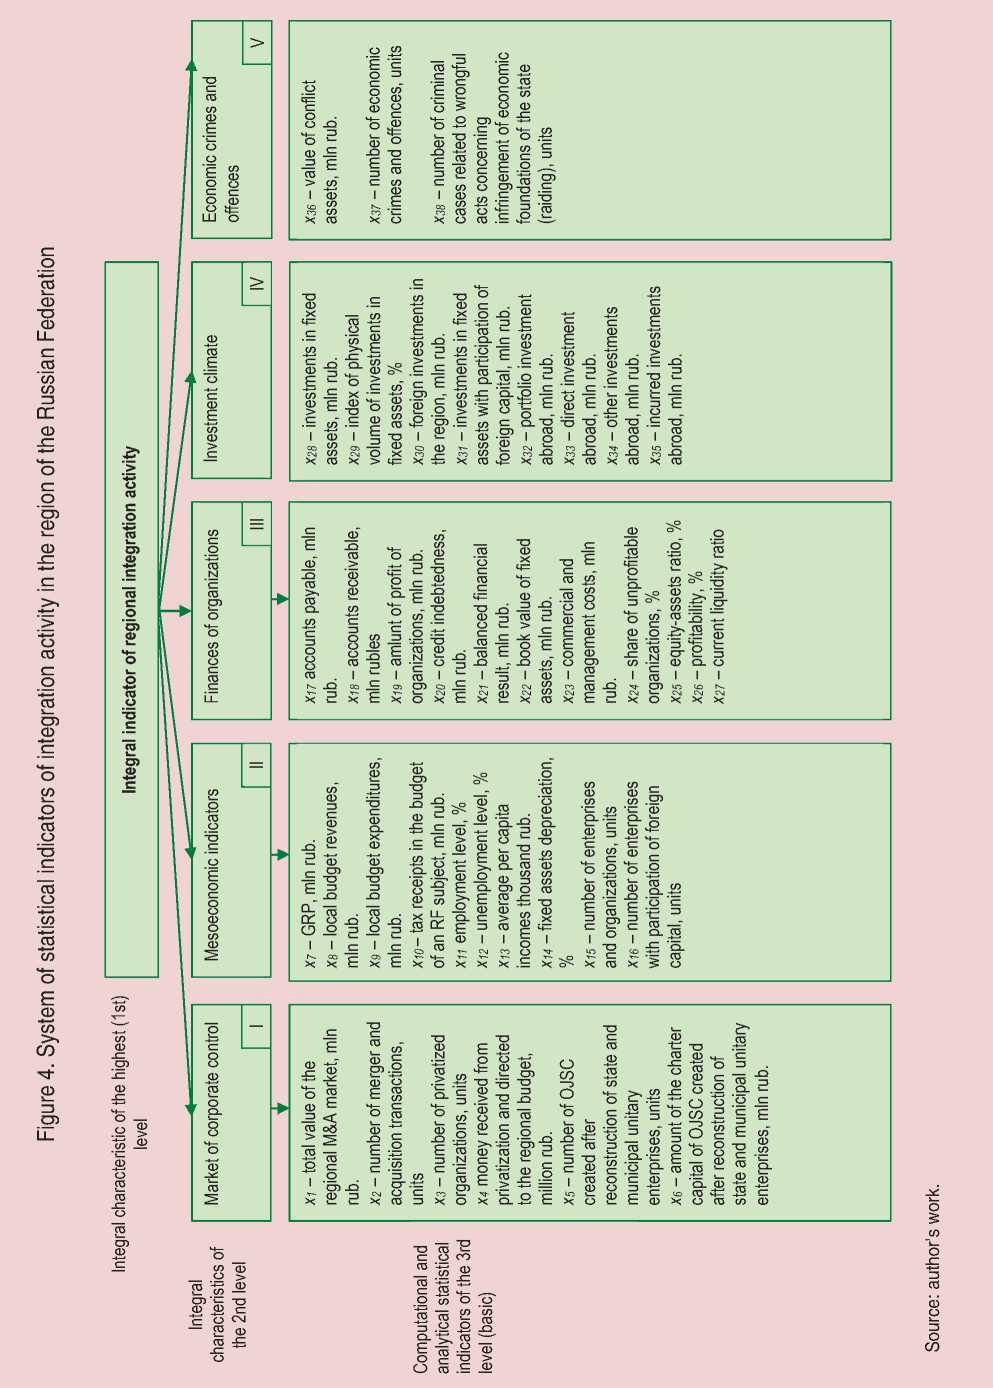
The central place in the proposed approach belongs to the development of a system of indicators: defining the structure and content, identifying the relationships between them and endowing their set with systemic nature [4]. Based on the analysis of Russian and foreign experience, taking into account the above specifics of distribution of integration processes on the territory of Russia, as well as specifics of formation and implementation of integration policy by Russian constituent entities subjects of the Russian Federation, a system of indicators of regional integration activity was proposed (Fig. 4) .
This system is adapted to the existing and available statistical information of Rosstat and informational and analytical agency “Mergers and acquisitions” and includes 38 indicators, divided into 5 functional blocks:
-
1) market for corporate control (6 variables);
-
2) mesoeconomic indicators (10 variables);
-
3) finances of organizations (11 variables);
-
4) investments (8 variables);
-
5) economic crimes and offences (3 variables).
According to the works of S.A. Ayvazyan, an integral indicator of the feature under consideration is a particular kind of convolution of values of the more particular features and criteria that describe integration activity in detail [1, 19]. In the framework of the ongoing research into integration activity of business structures in the regions of Russia we chose the objectivist approach, which is based on structural-functionalist type of paradigms. Under this approach, researcher’s interests are focused on analyzing and assessing the statistical indicators characterizing the whole conglomerates of the property under consideration.
The methodology for developing the integral indicator in the framework of the objectivist approach is a multistep procedure based on the convolution of statistically recorded indicators and on some methods for the multicriteria ranking
of objects. In particular, the shares of initial indicators in the integral indicators are selected so that the value of the integral indicator could be used for the most accurate restoration of the values of all base indicators in the a priori set [7].
The work has considered only 61 Russian regions due to the fact that the completed mergers and acquisitions were registered only in these regions of the Russian Federation in 2003–2013. The aggregation of indicators characterizing the integrative activity of business structures in the Russian regions in 2013 was carried out in a time when the eigenvalue of the first main component exceeds 55% of the sum of all eigenvalues of the principal components [2]. For this purpose, an integrated indicator of “regional integration” was found for the standardized values of specific indicators.
According to Table 4 the individual criteria within the block “Meso-economic indicators” have the greatest weight. In particular, the indicator “Tax receipts in the budget of a constituent entity of the Russian Federation” has the maximum weight ю 10 = 0.0807, this can be explained by the fact that the main taxpayers in Russia’s constituent entities are represented by integrated business structures that affect the development and integration activities in the regions in general.
Integrated indicators were used to rank the Russian Federation subjects. As a result, it has been found out that regions with high integration activity include five subjects, regions with the median integration activity – 30 subjects, regions with low integration activity – 26
Table 4. Indicators with the highest weight in the integral indicator of “Regional integration activity”, 2013
|
Indicator |
Name of indicator |
Integral feature |
Weight coefficient |
|
x2 |
Number of M&A transactions |
Market of corporate control |
0.0735 |
|
x6 |
Amount of the charter capital of JSC that were established as a result of transformation of state and municipal unitary enterprises |
0.0735 |
|
|
x7 |
Gross regional product |
Mesoeconomic indicators |
0.0779 |
|
x 10 |
Tax revenues in the budget of a constituent entity of the Russian Federation |
0.0802 |
|
|
x19 |
Amount of profit of organizations |
Finances of organizations |
0.0786 |
|
x21 |
Balanced financial result |
0.0781 |
|
|
x33 |
Investments abroad incurred |
Investment climate |
0.0742 |
|
x 34 |
Direct investmens abroad |
0.0709 |
|
|
x 35 |
Other investments abroad |
0.0738 |
|
|
x 36 |
Value of disputed assets |
Economic crimes and offences |
0.0618 |
|
x 38 |
Number of criminal cases related to illegal acts concerning infringement on the economic foundations of the state (raiding) |
0.0618 |
|
|
Source: author’s developments. |
|||
subjects. The results of the generalized ranking assessment of the level of regional integration activity are presented in Table 5 .
The majority of subjects within the Siberian Federal District are in the group with the median level of regional integration activity, where quite a few transactions are caused by processes occurring in the agricultural sector. First, the Siberian
Federal District provides favorable ground for Russian agricultural companies to enter the most attractive Chinese market. Second, there are several strong players in Siberia, for example “Khleb Altaya”, “Mel’nik”, “OGO” and others.
Significant differences in the level of development of integration activity of Russia’s regions depend on the current situation, the impact of which on the market of mergers and acquisitions will be offset in the medium term; they also depend on a situation in the long run. The opportunistic factor can be found in the presence of reserves of production capacities. This can provide an opportunity to increase the output in many types of economic activities only as a result of increasing demand, without any new construction, and reconstruction, and, as a consequence, it can give impetus to the revitalization of integration activity in the medium term.
Table 5. Results of the generalized ranking assessment of the level of regional integration activity of constituent entities of the Russian Federation, 2013
|
RF constituent entity |
Level of regional integration activity |
|
Moscow, Moscow Oblast, Saint Petersburg, Tyumen Oblast, Khanty-Mansi Autonomous Okrug (Yugra) |
High |
|
Oblasts: Amur, Vologda, Irkutsk, Kemerovo, Leningrad, Lipetsk, Novgorod, Novosibirsk, Orenburg, Penza, Samara, Saratov, Sverdlovsk, Tambov, Tomsk, Tula, Chelyabinsk, Ulyanovsk, Yaroslavl Republics: Bashkortostan, Mordovia, Tatarstan, Udmurtia, Khakassia, Chuvashia, Yakutia Krais: Krasnodar, Krasnoyarsk Autonomous Okrugs: Chukotka, Yamalo-Nenets |
Median |
|
Oblasts: Arkhangelsk, Astrakhan, Belgorod, Bryansk, Vladimir, Volgograd, Voronezh, Kaliningrad, Kaluga, Kostroma, Kursk, Nizhny Novgorod, Omsk, Orel, Pskov, Rostov, Smolensk, Tver Republics: Karelia, Tyva Krais: Altai, Zabaikalsky, Perm, Primorsky, Stavropol, Khabarovsk |
Low |
|
Source: author’s developments. |
Factors of a long-term nature can include the sectoral structure of production. In the regions whose economies are dominated by extractive industries financial resources are invested in capitalintensive long-term integration projects. Investments in infrastructure are necessary for creating conditions for economic growth; at that, direct contribution from investment in the short term may not give a significant increase in value added.
In these circumstances, one of the most important conditions for solving the tasks at hand is to consolidate limited resources through the development of active interaction between the authorities and business structures. Partnership cooperation is characterized by coherence and presence of a certain balance of interests of the authorities and business structures, regulation of their rights, duties, cross risk-sharing, and solidarity [17].
In this context, of great interest for regional comparisons is the comparison of regional integration activity in 2013 to regional integration activities in 2008, due to the fact that in 2013 compared to 2008 in the technical and legal aspect of executing mergers and acquisitions of business structures it is possible to identify the following trends:
-
• transactions are made in a much shorter period of time than previously;
-
• transactions of Russian holdings become less formal and often more simple in structure.
The maximum contribution to the value of the integral indicator of regional integration activity in 2008 is made by the indicators within the “financial institutions” block. In particular, the indicator “Accounts receivable” has a maximum weight ю 18 = 0.0824 , the indicator “Amount of profit of organizations” — w 19 = 0.0818 , the indicator “Net financial result” — ш 21 = 0.0818 . This is due to the fact that 2008 accounted for the peak in the number of mergers and acquisitions and focused on the stability of the financial situation of the target company.
After the integral indicator of regional integration activity in 2008 was built, it has been found that regions with high integration activity comprise four subjects, regions with median integration activity – 38 subjects, regions with low integration activity – 19 subjects. It should be noted that in 2008, 62.30% of the regions had median integration activity. The regions leading in 2008 have retained their positions in 2013 (Moscow, Moscow Oblast, Tyumen Oblast, Khanty-Mansi Autonomous Okrug).
Conclusions
The analysis described in the paper can serve as a basis for selecting the regions that require state support in order to enhance integration activity within minimum time and with maximum efficiency. Reduction of differences in the level of economic development of Russia’s regions helps solve important tasks such as preservation of a single economic space of Russia, development of interregional economic integration, and formation of national and regional markets.
Comprehensive assessment of the evolution of integration activity of constituent entities of the Russian Federation can be the basis for the development of federal target programs to equalize economic development of the regions within the integration development, to create a favorable environment for business development and improvement of investment climate and to enhance the efficiency of providing state support to Russian Federation regions.
One of the main areas that could promote integration activity of business structures in the regions of Russia and enhance the efficiency of integration of business entities are as follows:
-
• improving the investment climate and development of competition in Russia’s regions;
-
• introducing rational forms of participation of Russian business structures in the implementation of industrial policy priorities at both regional and federal levels;
-
• elaborating regional development policies for constituent entities of the Russian Federation, taking into account the specifics of integration processes in business structures within regions (there should be a clear relationship between strategic development plans for regions and consolidated development plans for the enterprises of integrated structures);
-
• improving the ways of participation of regional authorities in the activities of integrated structures when implementing regional projections of investment strategies;
-
• introducing the so-called individual support of integration projects, when representatives of regional administrations take active part in resolving various administrative issues in the implementation of integration projects for business entities.
References Comprehensive assessment of integration activity of business structures in Russian regions
- Aivazyan S.A. Analiz kachestva i obraza zhizni naseleniya . Moscow: Nauka, 2012. 432 p..
- Aivazyan S.A., Mkhitaryan V.S. Prikladnaya statistika i osnovy ekonometriki. T. 1: Teoriya veroyatnostei i prikladnaya statistika . Moscow: Yuniti-dana, 2001. 656 p..
- Bersenev V.L., Vazhenin S.G., Tatarkin A.I. Instituty ekonomicheskoi integratsii . Yekaterinburg: Institut ekonomiki UrO RAN, 2003. 70 p..
- Borodkin F.M., Aivazyan S.A. Sotsial'nye indikatory: uchebnik . Moscow: Yuniti-dana, 2006. 607 p..
- Glebova I.S. Rodnyanskii D.V. Integratsionnye protsessy kak faktor sotsial'no-ekonomicheskogo razvitiya regiona . Sovremennye problemy nauki i obrazovaniya , 2013, no. 1, p. 284..
- Endovitskii D.A., Soboleva D.E. Ekonomicheskii analiz sliyanii/pogloshchenii kompanii: nauchnoe izdanie . Moscow: KNORUS, 2008. 448 p..
- Karelina M.G. Innovatsionnaya aktivnost' rossiiskikh regionov: problemy izmereniya i ekonometricheskii podkhod . Regional'naya ekonomika: teoriya i praktika , 2015, no. 21 (396), pp. 14-24..
- Kuznetsova O.V., Kuznetsov A.V., Turovskii R.F., Chetverikova A.S. Investitsionnye strategii krupnogo biznesa i ekonomika regionov . 3rd edition. Moscow: Librikom, 2013. 440 p..
- Litvinov V.A. Kontsentratsiya i differentsiatsiya denezhnykh dokhodov po gruppam naseleniya Rossiiskoi Federatsii . Ekonomicheskii zhurnal VShE , 1999, no. 2, pp. 226-237..
- Musatova M.M. Osnovnye trendy razvitiya integratsionnykh protsessov v sovremennykh usloviyakh . Novosibirsk: Novosibirskii gosudarstvennyi universitet, 2013. 131 p..
- Mkhitaryan V.S., Polikarpova M.G. Otsenka effektivnosti integratsionnykh proektov metallurgicheskikh kompanii . Problemy teorii i praktiki upravleniya , 2013, no. 2, pp. 114-122..
- Polikarpova M.G., Ivanova T.A. O sisteme statisticheskikh pokazatelei integratsionnoi aktivnosti v rossiiskoi ekonomike . Voprosy statistiki , 2014, no. 11, pp. 24-37..
- Rastvortseva S.N., Ternovskii D.S. Faktory kontsentratsii ekonomicheskoi aktivnosti v regionakh Rossii . Ekonomicheskie i sotsial'nye peremeny: fakty, tendentsii, prognoz , 2016, no. (44), pp. 153-170..
- Eliseeva I.I., Egorova I.I. et al. Statistika . Moscow: Velbi; Prospekt, 2004. 448 p..
- Shmoilova R.A., Minashkin V.G. et al. Teoriya statistiki . Moscow: Finansy i statistika, 2003. 656 p..
- Tyutyk O.V. Model' regional'nogo rynka sliyaniya i pogloshcheniya: osobennosti transformatsii otnoshenii sobstvennosti i effektivnost' regional'noi ekonomicheskoi sistemy (na primere Permskogo kraya) . Voprosy sovremennoi nauki i praktiki , 2008, no. 3 (13), pp. 241-245..
- Uskova T.V., Kozhevnikov S.A. Upravlenie ekonomikoi regiona na osnove partnerskogo vzaimodeistviya organov vlasti i biznes-struktur . Ekonomicheskie i sotsial'nye peremeny: fakty, tendentsii, prognoz , 2014, no. 6 (36), pp. 34-46..
- Chernykh A.A. Strukturnaya politika v korporativnom sektore promyshlennosti regiona . Predprinimatel'stvo , 2011, no. 6, pp. 58-62..
- Aivazian S.A. Synthetic indicators of quality of life: construction and utilization for social-economic management and comparative analysis. Austrian Journal of Statistics, 2005, vol. 34, no. 1, pp. 5-20.
- Calkins, S. The New Merger Guidelines and the Herfindahl-Hirschman Index. California Law Review, 1983, no. 71, pp. 402-429.
- Wu Changqi, Xie Ningling. Determinants of cross-border merger & acquisition performance of Chinese enterprises. Procedia Social and Behavioral Sciences, 2010, no. 2, pp. 6896-6905.
- Dorfman R. A formula for the Gini coefficient. The Review of Economics and Statistics, 1979, no. 1, pp. 146-149.
- Haan J., Sturn J.-E. On the relationship between economic freedom and economic growth. European Journal of Political Economy, 2000, no. 16, pp. 215-241.
- Lubatkin M.H. Mergers and the performance of the acquiring firm. Academy of Management Review, 1983, no. 8 (2), pp. 218-225.
- Yan L., Ming L. The analysis on non-economic influencing factors in transnational mergers made by Chinese energy firms based on ESP Paradigm. Energy Procedia, 2011, no. 5, pp. 69-73.
