Computer A ided Detection of Tumours in Mammograms

Author: R.Ramani, N.Suthanthira Vanitha
Journal: International Journal of Image, Graphics and Signal Processing(IJIGSP) @ijigsp
Article in issue: 4 vol.6, 2014.
Free access
Mammography is a special CT scan technique, which uses X-rays and high-resolution film to detect breast tumors efficiently. Mammography is used only in breast tumor detection, and images help physicians to detect diseases due to cells normal growth. Mammography is an effective imaging modality for early breast cancer abnormalities detection. Computer aided diagnosis helps the radiologists to detect abnormalities earlier than traditional procedures. In this paper, an automated mammogram classification method is presented. Symlet, singular value decomposition and weighted histograms are used for feature extraction in mammograms. The extracted features are classified using naïve bayes, random forest and neural network algorithms.
Computer Aided Diagnosis, Mammography, Breast Tumor, Symlet, Singular Value Decomposition, Weighted Histograms
Short address: https://sciup.org/15013287
IDR: 15013287
Text of the scientific article Computer A ided Detection of Tumours in Mammograms
Published Online March 2014 in MECS
Breast cancer [1] is a common cancer among women. Though potentially fatal, early diagnosis can result in successful treatment. An important step in breast cancer diagnosis is tumor classification. Tumors are either benign or malignant, and only the latter is cancer. The diagnosis requires precise and reliable diagnosis to ensure that doctors can distinguish between benign and malignant tumors. Mammography is presently an effective imaging modality for breast cancer abnormalities detection.
The breast cancer prevention is impossible presently; data indicates declining death rates [2] due to mainly cancer detection where mammography has a big role to play. Widespread mammography use needs aids from computer technology. There are many approaches were proposed from the 90s most based on film-digitization involving three steps: enhancement, segmentation and classification. The image processing steps is shown in Fig.1 [3].
A mammogram has three kinds of tissues: breast supporting tissues (consisting of fibrous tissue and fat), lobes, and lesions (calcifications/masses) [4]. Generally, such tissues have varying brightness levels with lesions being the brightest. If the spot where the highest level is seen can be located, then a threshold for the original image segmentation is possible.
There are two types of Mammography; "screening mammography" and "diagnostic mammography" [5]. Screening mammography is a breast X-ray used for early detection of breast cancer in women with no signs/symptoms of cancer and includes a physician's result interpretation. The exam includes to breast X-rays after which screening mammography detects tumors. It can also find micro calcification (tiny calcium deposits) that can show cancer. Diagnostic mammography is an X-ray of the breast to check the symptoms of breast cancer after the discovery of a lump or other sign. Such analysis includes pain, skin thickening, nipple discharge or breast size/shape change. The screening mammography diagnostic can be used to test the changes in breast area.
Real world data can include irrelevant, redundant, noisy data and not all attributes used for classification. The feature selection is necessary when handling real world data sets. A pre processing step to machine learning in real world data reduces dimensionality, removes irrelevant data, noise from data and thus improves results. Hence, features increase data retaining, management cost and confuse classification algorithms. They also result in low learning precision. To select an original features subset present in dataset, this provides useful information.
Feature selection is an important in breast cancer detection and classification. After features extraction, not all features are used to differentiate between normal and abnormal patterns. The advantage of limiting input features to make accuracy and reduce computation complexity. Many features [6] are extracted from digital mammograms, they include region-based features [7], shape-based features [8], texture based features selection [9], and position based features [10]. Texture features classify normal and abnormal in digital mammogram patterns. Feature classifies masses as benign or malignant using selected features. There are various methods used for mass classifications and some popular techniques are artificial neural networks [11] and linear discriminating analysis [12].
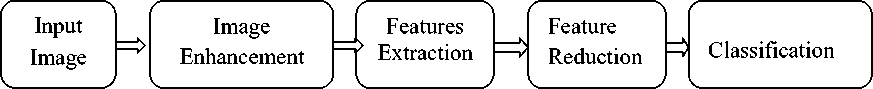
Figure 1. Typical steps in image processing algorithms
In this paper, an automated mammogram classification method is presented. Symlet wavelet is used for image decomposition, singular value decomposition for feature reduction and weighted histogram for feature extraction from mammograms. The extracted features are classified using naïve bayes, random forest and neural network algorithms. A brief review of related work is given in section II. In section III, the proposed methodology technique is introduced. The implementation results and comparison are provided in section IV. Finally, the conclusions are summed up in section V.
-
II. LITERATURE REVIEWS
Wavelets transformation is an effective mathematical tool to analyze mammogram images possessing fuzzy like texture characteristics. Rajkumar et al [13] carried out a comparative discrete wavelets transformation (DWT) and stationary wavelets transformation (SWT) performance study to classify mammogram images as normal, benign and malignant. A fractional part of highest wavelets coefficients is used as features for classification in each wavelets transformation. Up to 83% of images were classified into exact risk level using discrete wavelets transforms, whereas stationary wavelet transformation obtained only 76% accuracy.
Singh et al [14] revealed outcomes of applying image processing threshold, edge based and watershed segmentation on mammogram images and presented a case study based on time consumption and simplicity. Real-time implementation of proposed system using data acquisition hardware and software interface with mammography systems was possible. Two techniques based on statistical and LBP features using support vector machine (SVM) and the k-nearest neighbor (KNN) classifiers proposed by Berbar et al [15]. System evaluation was through digital database for screening mammography (DDSM) which classifies normal from abnormal cases with great accuracy.
This approach deals with digital mammograms classification was described by Buciu et al [16]. Manually extracted patches around tumors to segment abnormal areas from remaining image, which is the background. Gabor wavelets filter mammogram images and directional features extracted at different orientation/frequencies. Principal component analysis (PCA) reduces filtered and unfiltered high-dimensional data's dimensions. Proximal Support Vector Machines do the last classification.
The superior classification performance results when Gabor features are extracted as against using original mammogram images. Gabor features robustness for digital mammogram images distorted by Poisson noise and at varying intensity levels is addressed. Faye et al [17] introduced a method of digital mammogram classification using feature extraction from wavelets coefficients.
A matrix puts a building set image's wavelets coefficients as a row vector. The method selects columns to maximize Euclidian distances between class representatives with selected columns being used for classification. The method is tested with images provided by Mammographic Image Analysis Society (MIAS) to classify normal, abnormal and later benign, malignant tissues. A high accuracy rate of 98% was achieved for both classifications.
Luo et al [18] used forward selection (FS) and backward selection (BS), two feature selection methods to remove irrelevant features and improve cancer prediction results, which showed that feature reduction improved predictive accuracy with density being an irrelevant feature in dataset where data identified on collected full field digital mammograms. Additionally, decision tree (DT), support vector machine—sequential minimal optimization (SVM-SMO) and ensembles solved breast cancer diagnostic problem while trying result prediction with better performance. The test proved that ensemble classifiers were better at accuracy than single classifiers.
A novel method of mammogram classification with a unique weighted association rule based classifier presented by Dua et al [19]. Pre processed images reveal regions of interest. Texture components are extracted from an image segmented parts and discretized for rule discovery. Association rules extracted from image segments are derived between various texture components, which is used for classification based on intra and inter class dependencies.
These rules are commonly used mammography dataset classification. Rigorous experimentation evaluates rules' efficiency under various classification scenarios. The results proved this method worked well for datasets with accuracies as high as 89%, beating accuracy rates of other rule based classification methods.
Elsayad, A.M. et al 2010 evaluates two Bayesian network classifiers: Naïve Bayesian and Markov blanket estimation on the prediction of severity of breast masses. The prediction accuracies of Bayesian networks were benchmarked against the multilayer perceptron neural network [25]. Prathibha, B.N. et al 2011 proposed discrete wavelet transform (DWT) feature and was merged with discrete cosine transform (DCT) features. Classification was done with a combination of nearest neighbor (NN) classifiers; kNN, class based NN and density based NN [26].
-
III. METHODOLOGY
Mammogram Database
Mammographic Image Analysis Society (MIAS), a digital mammogram database, has digitized images to 50 micron pixel edge with a Joyce-Loebl scanning microdensitometer. A linear device with a 0-3.2 optical density range represents pixels in an 8-bit word [20]. The database consists of 322 digitised films and radiologist "truth"-markings on detected abnormalities locations. This was reduced to 200 micron pixel edge with padding/clipping to ensure all images were 1024 x1024 pixels at 8 bits per pixel. Erosion followed by dilatation with same structuring element, completes the opening function. The Mini MIAS database excludes excessive network training and a better system generalization. Fig 2 shows a sample dataset image.
The Symlets are Daubechies’ approximately symmetry wavelets; these are orthogonal wavelets with close to symmetric scaling function [21]. Symlets are nearly symmetrical wavelets created to modify the Daubechies (db) wavelet family with properties of both wavelet families being similar.
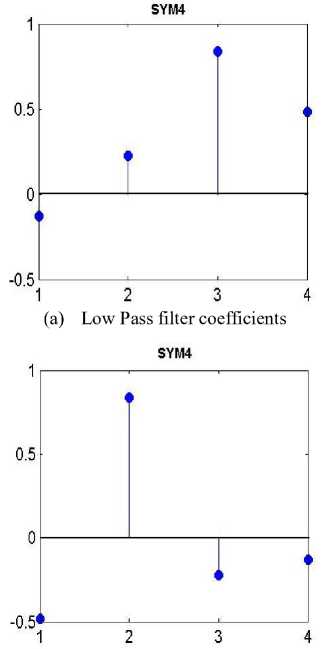
(b) High Pass filter coefficients
Figure 3. Symlet4 Wavelet
h ( z ) = ^J h k z k and g ( z ) = zh ( - z 1 ) k
Where h and g are wavelet decomposition (analysis) filters, with h being a low pass filter and g is a high pass filter. Seven different symlets functions exist from sym2 to sym8. The study used sym4 function with its low and high pass filters coefficients as shown in Fig.3.
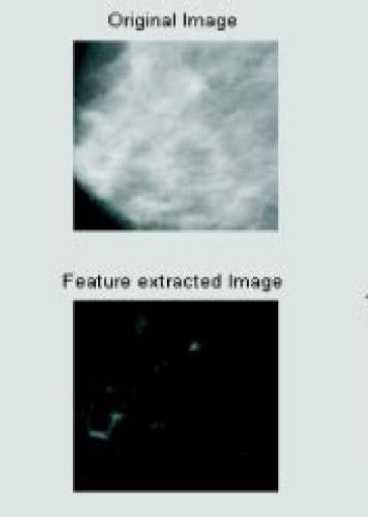
Figure 2. Original image and feature extracted image
Coefficients from symlet are reduced with singular value decomposition (SVD), which reduces a high dimensional, variable data set to a lower dimensional space exposing original data substructure clearly ordering it from the highest variation to the least. SVD ensures finding original data sets points’ best approximation with fewer dimensions.
When A is symmetric and positive definite, an orthogonal matrix Q for which A = QΛQT is possible. where Λ is an Eigen values matrix. SVD formulates matrix A as a product UΣVT where U and V are orthogonal and Σ is a diagonal matrix where non-zero entries of Eigen values of ATA square roots. The U and V columns provide bases for 4 fundamental subspaces [22].
The histogram method represents, analyzes and recognizes images as it calculates easily, efficiently, robust to noise and local image transformations. Assume for N data points with scalar values f1, . . . fN, each fi, m intervals/bins defined by the points b0, b1, . . . , bm where bi < bi+1. Assuming uniformly spaced bins then bi+1 - bi = b for i = 1. . ., m - 1.
The histogram h = (h1, . . . ,hm) records points number fj falling into each bin and calculated as follows: Set h = (0, . . . , 0) then for i = 1 : N Find the j such that b j ≤ fi< b j +1 and set h j = h j + 1.
Sometimes N data points f1, . . .fN also have nonnegative weights w1, . . . wN associated with them. Weighted histogram h = (h1, . . . ,hm) records the weights sum of the points fj that falling into each bin and calculated as follows: Set h = (0, . . . , 0) then for i = 1 : N.
Find the j such that b j ≤ f i < b j+1 and set h j = h j + w j.
The extracted features are classified using naïve bayes, random forest and neural network. A naive bayes classifier is a simple probabilistic classifier based on bayes' theorem. The bayes theorem is based on strong a (naive) independent assumption which relates the conditional and marginal probability distributions of random variables.
The random forest [23] employs the Bagging method to create a randomly sampled set of the training data. Each randomly created set is used to build the trees of the random forest. A new instance is classified by voting of the trees.
Artificial neural networks [24] are widely used of its efficiency in classification. The neural networks are made up of neurons; these neurons are connected to form input layer, hidden layer and output layer. The inputs feed to the network is propagated through the network to obtain an output. Training data is used to train the network using learning algorithms like back propagation.
-
IV. RESULTS AND DISCUSSION
Mini-MIAS dataset mammograms are used to evaluate the presented method. Only a dataset subset is used. Features extraction is through Symlet wavelets and weighted histogram. Extracted features are reduced through SVD with reduced feature set being classified by naïve bayes, Random forest and neural network algorithms. Training set includes 60% data with the remaining being used as test set.
Recall and precision are measured for both proposed semantic and keyword techniques allowing absolute and relative performance measures to be calculated using standard measures. The accuracy, precision, recall and f measure are computed as follows:
Accuracy (%) = (TN + TP) / (TN + FN + FP + TP) (2)
TP precision =--------
TP + FN recall =
TP
TP + FP
2*recall* precision f Measure =---------------- recall + precision
Where TN (True Negative) = Number of correct predictions for an instance is invalid
TP (True Positive) = Number of correct predictions for an instance is valid
FP (False Positive) = Number of incorrect predictions for an instance is valid
FN (False Negative) = Number of incorrect predictions for an instance is invalid
The Results of various techniques and classification accuracy are tabulated in Table 1. The precision recall obtained being shown in Table 2. In Fig 4 and 5, reveal the same respectively.
TABLE I. CLASSIFICATION ACCURACY FOR VARIOUS TECHNIQUES
|
Algorithms |
Classification Accuracy % |
|
Naïve Bayes |
81.21% |
|
Random Forest |
86.67% |
|
Neural Network |
89.7% |
In Fig 4 is the graphical representation of the classification accuracy. The classification accuracy is obtained for various techniques such as naive bayes, random forest and neural networks. From the above techniques, the classification accuracy for naive bayes is 81.21%, 86.67%, for random forest and neural netwok is 89.7%. The obtained value is show in Table 1. The classification accuracy for Neural Network achieves the best results when compare with other two methods.
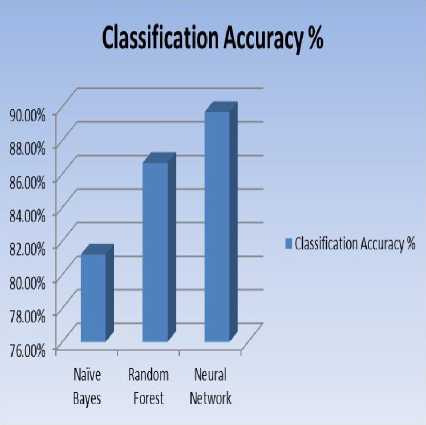
Figure 4. Classification Accuracy for mammogram
TABLE II. PRECISION, RECALL
|
Algorithms |
Precision |
Recall |
|
Naïve Bayes |
0.788 |
0.800 |
|
Random Forest |
0.847 |
0.859 |
|
Neural Network |
0.883 |
0.886 |
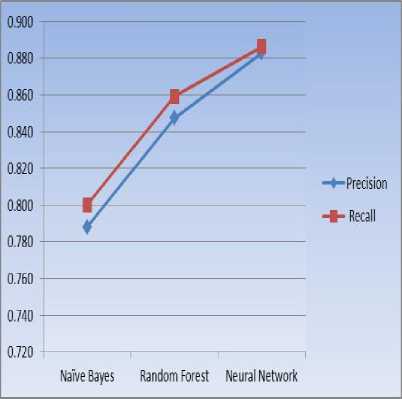
Figure 5. Precision, Recall
The precision and recall is obtained for various techniques such as naive bayes, random forest and neural networks. The precision and recall value for naive bayes is 0.788 and 0.800, 0.847 and 0.859 for random forest. The precision and recall value for neural network is 0.883 and 0.886. From the above observation the precision and recall is better for neural network with the presented feature extraction method.
-
V. ONCLUSION
The Computer aided diagnosis systems helps to doctors in detection/diagnosis of abnormalities quicker than traditional procedures. This paper presents an automated mammogram classification method based on symlet, singular value decomposition and weighted histogram algorithms used for feature extraction. Extracted features classified with naïve bayes, random forest and neural network algorithms. Mini MIAS dataset mammograms used for evaluation in this method. The selected features classified by naïve bayes, random forest and neural network algorithms. This result proves that the neural network’s classification accuracy is good.
ACKNOWLEDGEMENT
The authors are sincerely thankful to the unanimous reviewers for their critical comments and suggestions to improve the quality of the manuscript.
References Computer A ided Detection of Tumours in Mammograms
- Aruna, S., & Rajagopalan, S. P. (2011). A Novel SVM based CSSFFS Feature Selection Algorithm for Detecting Breast Cancer. International Journal of Computer Applications, 31(8).
- Qi, H., & Snyder, W. E. (1999, May). Lesion detection and characterization in digital mammography by Bezier histograms. In Medical Imaging'99 (pp. 1521-1526). International Society for Optics and Photonics.
- Talha, M., Sulong, G. B., & Alarifi, A. Enhanced Breast Mammograms Classification using Bayesian Classifier.
- Qi, H., & Snyder, W. E. (1998). Lesion detection and characterization in digital mammography by Bézier histograms. In Engineering in Medicine and Biology Society, 1998. Proceedings of the 20th Annual International Conference of the IEEE (Vol. 2, pp. 1021-1024). IEEE.
- Sickles, E. A., Wolverton, D. E., & Dee, K. E. (2002). Performance Parameters for Screening and Diagnostic Mammography: Specialist and General Radiologists1. Radiology, 224(3), 861-869.
- R.Nithya, B.Santhi, "Mammogram Classification Using Maximum Difference Feature Selection Method", Journal of Theoretical and Applied Information Technology, Vol. 33, pp 197 - 204, 2011.
- Dominguez, A. R., & Nandi, A. K. (2007, April). Enhanced multi-level thresholding segmentation and rank based region selection for detection of masses in mammograms. In Acoustics, Speech and Signal Processing, 2007. ICASSP 2007. IEEE International Conferenceon (Vol. 1, pp. I-449). IEEE.
- Mu, T., Nandi, A. K., & Rangayyan, R. M. (2008). Classification of breast masses using selected shape, edge-sharpness, and texture features with linear and kernel-based classifiers. Journal of Digital Imaging, 21(2), 153-169.
- Manduca, A., Carston, M. J., Heine, J. J., Scott, C. G., Pankratz, V. S., Brandt, K. R., Sellers, T. A., Vachon, C. M & Cerhan, J. R. (2009). Texture features from mammographic images and risk of breast cancer. Cancer Epidemiology Biomarkers & Prevention, 18(3), 837-845.
- Jas, M., Mukhopadhyay, S., Chakraborty, J., Sadhu, A., & Khandelwal, N. (2013). A Heuristic Approach to Automated Nipple Detection in Digital Mammograms. Journal of Digital Imaging, 1-9.
- Delogu, P., Evelina Fantacci, M., Kasae, P., & Retico, A. (2007). Characterization of mammographic masses using a gradient-based segmentation algorithm and a neural classifier. Computers in Biology and Medicine, 37(10), 1479-1491.
- Shi, J., Sahiner, B., Chan, H. P., Ge, J., Hadjiiski, L., Helvie, M. A., ... & Cui, J. (2008). Characterization of mammographic masses based on level set segmentation with new image features and patient information. Medical physics, 35, 280.
- Rajkumar, K. K., & Raju, G. (2011). A comparative study on classification of mammogram images using different wavelet transformations. International Journal of Machine Intelligence, 3(4).
- Singh, N., & Mohapatra, A. G. (2011). Breast cancer mass detection in mammograms using k-means and fuzzy c-means clustering. International Journal of Computer Applications (0975–8887), 22(2).
- Berbar, M. A., Reyad, Y. A., & Hussain, M. (2012, July). Breast Mass Classification using Statistical and Local Binary Pattern Features. InProceedings of the 2012 16th International Conference on Information Visualisation (pp. 486-490). IEEE Computer Society.
- Buciu, I., & Gacsadi, A. (2011). Directional features for automatic tumor classification of mammogram images. Biomedical Signal Processing and Control, 6(4), 370-378.
- Faye, I., Samir, B. B., & Eltoukhy, M. M. (2009, December). Digital mammograms classification using a wavelet based feature extraction method. In Computer and Electrical Engineering, 2009. ICCEE'09. Second International Conference on (Vol. 2, pp. 318-322). IEEE.
- Luo, S. T., & Cheng, B. W. (2012). Diagnosing breast masses in digital mammography using feature selection and ensemble methods. Journal of medical systems, 36(2), 569-577.
- Dua, S., Singh, H., & Thompson, H. W. (2009). Associative classification of mammograms using weighted rules. Expert systems with applications, 36(5), 9250-9259.
- Suckling, J. et al. (1994). The mammographic image analysis society digital mammogramdatabase, International Congress Series 1069 pp. 375–378.
- Kaleka, J. S. (2012). Comparative Performance Analysis of Haar, Symlets and Bior wavelets on Image compression using Discrete Wavelet Transform. International Journal of Computers & Distributed Systems, 1(2), 11-16.
- Baker, E. S., & DeGroat, R. D. (1998). A correlation-based subspace tracking algorithm. Signal Processing, IEEE Transactions on, 46(11), 3112-3116.
- L. Breiman. Random Forests. Machine Learning, 45(1):5-32, 2001.
- Peterson, C., & Soderberg, B. (1993). Artificial neural networks. Modern heuristic techniques for combinatorial problems, 197-242.
- Elsayad, A.M. "Predicting the severity of breast masses using Bayesian networks", Informatics and Systems (INFOS), 2010.
- Prathibha, B.N. "An analysis on breast tissue characterization in combined transform domain using nearest neighbor classifiers", Computer, Communication and Electrical Technology (ICCCET), 2011.
