Contact distribution function based clustering technique with self-organizing maps

Author: G. Chamundeswari, G. P. S. Varma, Ch. Satyanarayana
Journal: International Journal of Image, Graphics and Signal Processing @ijigsp
Article in issue: 3 vol.10, 2018.
Free access
Currently clustering techniques play a vital role in object recognition process. The clustering techniques are found to be efficient with neural networks. So, the present paper proposed a novel method for clustering the input objects with Self-Organizing Map (SOM). The proposed method considers the input object as a random closed set. The random set can be efficiently described with various features viz., volume fractions, co-variance and contact distributions etc. In the proposed method, the input object is described efficiently with spherical contact distribution. The proposed method is experimented with the leaf data set with 795 images. The performance of the proposed method is evaluated with various topologies of SOM and is measured with four measures viz., FNR, FPR, TPR and TNR. The results indicate the efficiency of the proposed method.
Spherical contact distribution, Linear contact distribution, Feature vector, Neighborhood and Topology
Short address: https://sciup.org/15015944
IDR: 15015944 | DOI: 10.5815/ijigsp.2018.03.02
Text of the scientific article Contact distribution function based clustering technique with self-organizing maps
Published Online March 2018 in MECS DOI: 10.5815/ijigsp.2018.03.02
Currently, the researchers are focus on the design of efficient object recognition method. The object recognition methods can be applicable to various applications viz., surveillance systems, tumor detection, leaf or plant analysis etc. The object can be described with various features of shape, color or texture etc. An object recognition method by combining texture, color and shape features [1] is found to be efficient than Krawtchouk moments, Zernike moments, or Tchebichef moments. This method involves the computation of three different feature vectors. A method is designed for the fruit and vegetable recognition system [2]. It consists of three stages viz., background subtraction, feature extraction, and training and classification. The underwater recognition system [3] is designed with chain coding, texture and statistical features. The described feature vector is given to a learning algorithm for getting efficient result. A Mean Local Mapped Pattern (M-LMP) [4] is a descriptor designed based on visual code book. It performs analysis of appearance features of the object local patch. For diabetic patients, estimation of carbohydrate content in the meal is conducted by a food recognition algorithm. The bag-of-features (BoF) model [5] is used for the automatic recognition.
-
II. Related Work
The Gaussian mixture model clustering technique [6] is used for object recognition. In this method, updated PageRank algorithm is used for detection of saliency points. Then the points are used for representing the input object. An approach for estimation of shape and position of an object [7] is proposed based on interpolating, data mining and steoreometric methods. The clustering stage involved in the proposed method is observed be complex. The clustering of Voting Lines (CVL) method [8] gets the direct consistent hypothesis with the combination of pair wise and weighted approach for clustering voting lines. It represents the object boundary with the sparse representation. The efficiency of the clustering based object recognition process can be increased with the boosting technique. The cluster based boosting (CBB) method [9] consists of outlier detection stage for enhancing the efficiency. For the object recognition method, it is observed that the depth information [10] play a vital role. Based on this, the clusters are efficiently formed and thus recognize the objects.
The self-organizing map (SOM) is with features used to recognize various human activities [11]. The features reflect the body joint features which are computed based on various distance measures. The emotion recognition model [12] uses the feature vector of length 26. The feature vector is further processed by SOM for classification. The hand and full body is tracked [13] efficiently with the touch-free gesture technology. This technology along with the SOM is found to be efficient. The clustering techniques involved in the bankruptcy trajectory [14] uses two different types of SOMs i) feature SOM ii) trajectory SOM. The temporal features are analyzed with FSOM and clustering is performed with TSOM. Moving Average SOM [15] is found to be efficient for segmenting the medical images. The texture features are used widely used for object recognition. Local directional patterns [16] are one of the popular texture features. The local binary patterns [17] along with the K-NN and surf matching are used for recognizing the objects. The texture can be further described with the 2D local power spectrum [18]. The spectrum is generated with the Gabor filters. An object [19, 20, 21] can be represented with the random closed set and describes the object with various features and performs classification with distance measure. To improve the efficiency of the object recognition process, the present paper describes the input object with contact distribution based features and further analysis is performed with SOM.
The present paper is organized as follows. The section I give the introduction to the object recognition, section II discusses about the related work, section III discusses about the proposed methodology. The detailed results and discussion is provided in section III and the conclusions in section IV.
-
III. METHODOLOGY
The object recognition techniques are needed for various applications of computer vision and pattern recognition. Among various approaches for object recognition, the texture based methods are found to be simple and efficient. The Haralick based features are the standard texture features. Other than these, there are various standard features viz., Local Binary Pattern (LBP), Local Directional Pattern (LDP) etc.
The present paper considers an approach for representing the input object with random set. The random set can be used to represent both the binary and grey level images. For binary images, univariate random closed set is used for representation and for grey level images; multivariate random closed set is used. This representation of the object can be further described with various features viz., volume fraction, covariance, cross covariance, Ripley’s function, contact distribution. It is found that the contact distribution function based feature vector is efficient for object recognition. So, the present paper considers the contact distribution based description of the input object. The contact distribution functions are used to describe the random spatial structures of the input object. The contact distribution function can be either spherical or linear. The present paper considers the spherical contact distribution function based feature vector for representing the input object.
Let S be the random closed set and the window is T then the volume fraction (VF) in (1) indicates the area or volume of the window.
VF . Ы . VS)
I T
The covariance (CV) of the S with increasing size t is given in (2).
(I S + t) n (T + t ) v ( e№ , ДS ) )
CV (t) = T+t = v(^{^')
The Spherical contact distribution function (SCDF) of S with a ball of radius t centered at origin is given in (3).
SCDF(t) = 1 - v(TB(°,‘) (SC)'^(T)-(3)
v ( e в (о, , ) (T ) ) v ( S C )
In [22], these features are used to describe the binary texture efficiently. They used distance measures for classification stage. To improve the accuracy of the recognition rate, the present paper uses the clustering technique. Among various clustering techniques, the selfOrganizing Map (SOM) is observed to be efficient. So, the present paper uses SOM for the clustering stage. The topology of the SOM is shown in Fig. 1. The proposed method is experimented with the leaf data base which consists of 90 groups of images. So, the SOM is designed with the size 15×6 topology. The neighborhood connections of the designed SOM are shown in Fig. 2. The weight positions of the designed SOM are shown in Fig. 3.
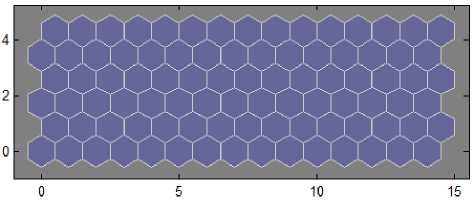
Fig. 1. SOM Topology.
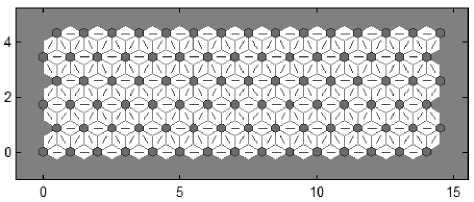
Fig. 2. SOM Neighbor Connections.
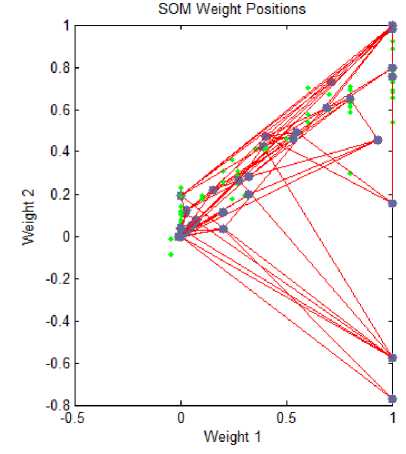
Fig. 3. SOM Weight Positions.
and the performance measures are shown in Fig. 7, 11, 15 and 19.
For each topology, the FNR is computed with all the four distance measures and are shown in Fig. 4, 5, 6 and 7. In these figures, FNR at various neighborhood sizes are portrayed. From this, it is observed that the least FNR is obtained with Hextop topology. For each topology, the FPR is computed with all the four distance measures and arures shown in Fig. 8, 9, 10 and 11. In these figures, FPR at various neighborhood sizes are portrayed. From this, it is observed that the least FPR is obtained with Randtop topology. For each topology, the TPR is computed with all the four distance measures and are showures in Fig. 12, 13, 14 and 15. In these figures, TPR at various neighborhood sizes are portrayed. From this, it is observed that the highest TPR is obtained with Randtop topology. For each topology, the TNR is computed with all the four distance measures and are shown in Fig. 16, 17, 18 and 19. In these figures, TNR at various neighborhood sizes are portrayed. From this, it is observed that the highest TNR is obtained with Hextop topology.
-
IV. Results and Discussions
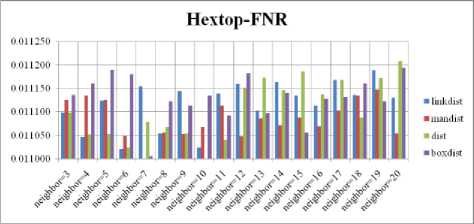
Fig. 4. FNR Comparison Result of SOM-Hextop with various distance measures.
The present paper describes the input object with spherical contact distribution features. The described feature vector is given to SOM. The present paper evaluated the proposed approach with the leaf database of 795 images which are grouped into 90categories. The present paper has conducted the experiment with four different SOM organizations viz., Hextop, Randtop, Tritop and Gridtop. The Hextop uses hexagonal pattern, Randtop uses random pattern, Tritop uses triangle pattern and Gridtop uses rectangular grid pattern in the topology of the SOM. For each topology pattern structure, the present paper evaluates the performance of the proposed approach with various neighborhood sizes ranging from 3 to 20. For each experiment of SOM, the distance between the neurons is computed with four different distance measures viz., link dist, man dist, dist and box dist. The dist computes the Euclidean distance, the man dist computes the manhattan distance, the link dist computes the number of links as distance and the box list computes the layer neuron position vector based distance.
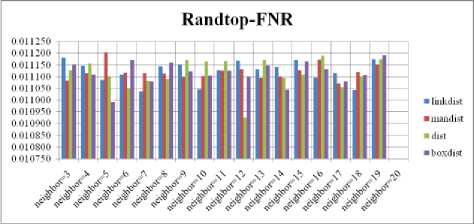
Fig. 5. FNR Comparison Result of SOM-Randtop with various distance measures.
For each experiment, the described feature vector is given to the designed SOM with the associated topology structure, neighborhood size and distance function. The performance of the experiment is indicated with fur measures viz., FNR (False Negative Ratio), FPR (false Positive Ratio), TPR (True Positive Ratio) and TNR (True Negative Ratio).
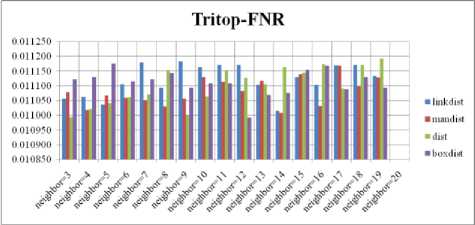
Fig. 6. FNR Comparison Result of SOM-Tritop with various distance measures.
The SOM with Hextop topology structure is considered for the evaluation and the evaluated performance measures are shown in Fig. 4, 8, 12 and 16. The SOM with Randtop topology is considered for the evaluation and the performance measures are shown in Fig. 5, 9, 13 and 17. The SOM with Tritop topology is considered for the evaluation and the performance measures are shown in Fig. 6, 10, 14 and 18. The SOM with Gridtop topology is considered for the evaluation
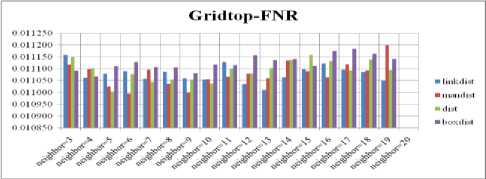
Fig. 7. FNR Comparison Result of SOM-Gridtop with various distance measures.
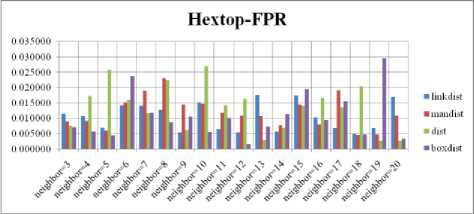
Fig. 8. FPR Comparison Result of SOM-Hextop with various distance measures.
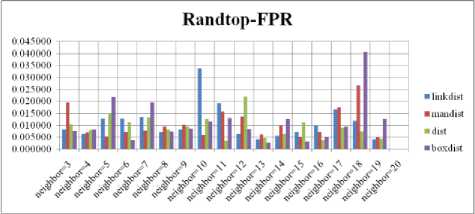
Fig. 9. FPR Comparison Result of SOM-Randtop with various distance measures.
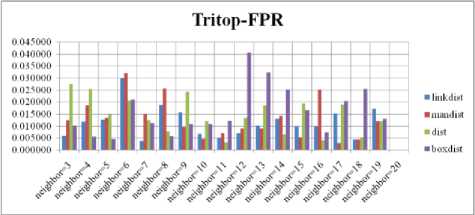
Fig. 10. FPR Comparison Result of SOM-Tritop with various distance measures.
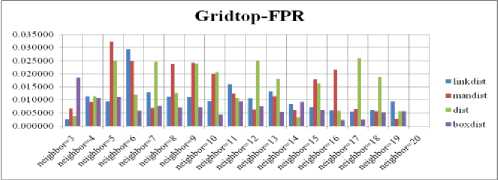
Fig. 11. FPR Comparison Result of SOM-Gridtop with various distance measures.
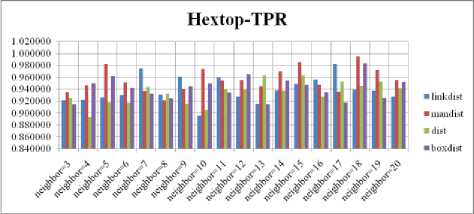
Fig. 12. TPR Comparison Result of SOM-Hextop with various distance measures.
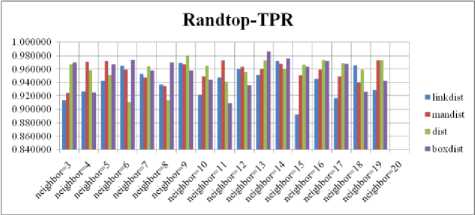
Fig. 13. TPR Comparison Result of SOM-Randtop with various distance measures.
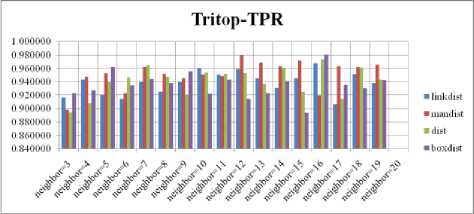
Fig. 14. TPR Comparison Result of SOM-Tritop with various distance measures.
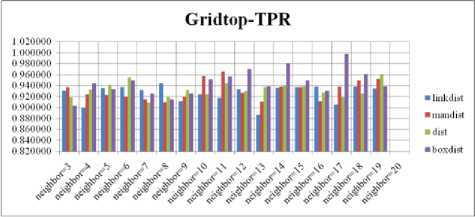
Fig. 15. TPR Comparison Result of SOM-Gridtop with various distance measures.
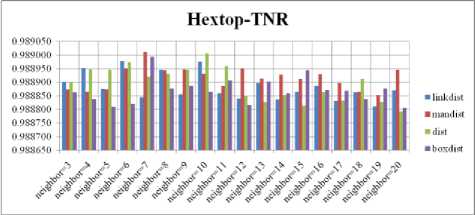
Fig. 16. TNR Comparison Result of SOM-Hextop with various distance measures.
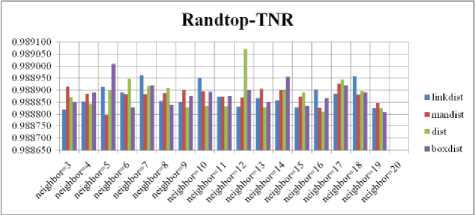
Fig. 17. TNR Comparison Result of SOM-Randtop with various distance measures.
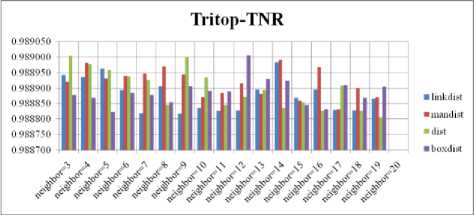
Fig. 18. TNR Comparison Result of SOM-Tritop with various distance
measures.
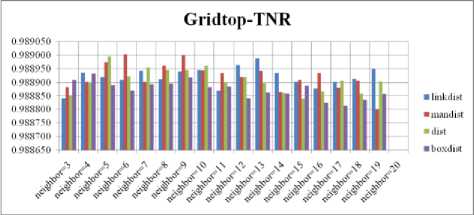
Fig. 19. TNR Comparison Result of SOM-Gridtop with various distance measures.
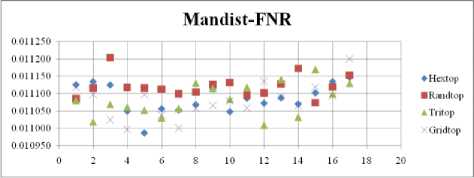
Fig. 22. FNR Comparison Result of SOM-Man distance measure with various topology functions.
Boxdist-FNR
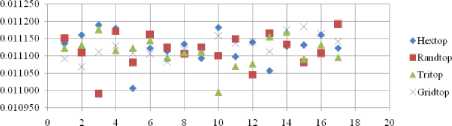
Fig. 20. FNR Comparison Result of SOM-Box distance measure with various topology functions.
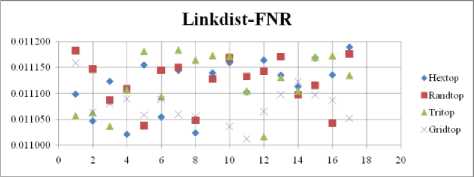
Fig. 21. FNR Comparison Result of SOM-Link distance measure with various topology functions.
The FNR measure with Boxdist distance function is shown in Fig. 20. The least FNR value is obtained at neighborhood (NH)=4 with Randtop and NH=10 with Tritop. The FNR measure with Linkdist distance function is shown in Fig. 21. The least FNR value is obtained at NH=13 with Gridtop and NH=14 with Tritop. The FNR measure with Mandist distance function is shown in Fig. 22. The least FNR value is obtained at NH=7 with Hextop. The FNR measure with dist distance function is shown in Fig. 23. The least FNR value is obtained at NH=12 with Randtop.
The FPR measure with Boxdist distance function is shown in Fig. 24. The least FPR value is obtained at NH=12 to 16 with Hextop, Randtop and Gridtop. The FPR measure with Linkdist distance function is shown in Fig. 25. The least FPR value is obtained at NH=3 with Gridtop. The FPR measure with Mandist distance function is shown in Fig. 26. The least FPR value is obtained at NH=18 with Tritop and NH=19 with Gridtop. The FPR measure with dist distance function is shown in Fig. 27. The least FPR value is obtained at NH=19, 20 with Hextop.
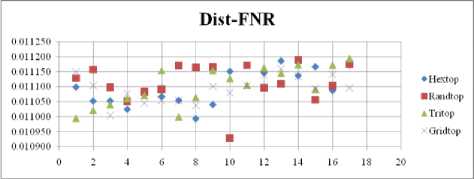
Fig. 23. FNR Comparison Result of SOM-dist distance measure with various topology functions.
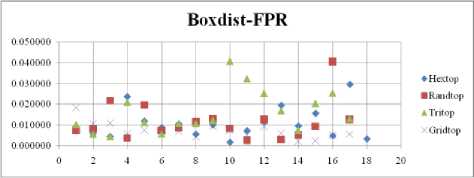
Fig. 24. FPR Comparison Result of SOM-Box distance measure with various topology functions.
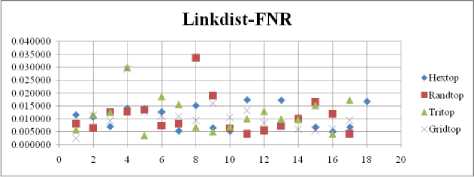
Fig. 25. FPR Comparison Result of SOM-Link distance measure with various topology functions.
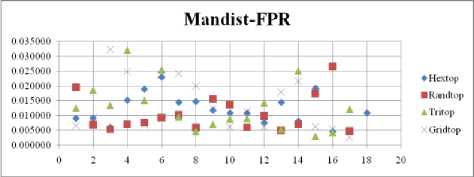
Fig. 26. FPR Comparison Result of SOM-Man distance measure with various topology functions.
dist distance measure, chi2PDF for dist distance measure and chi2PDF for box dist distance measure. The SOM with Gridtop structure is used for the evaluation and the performance measures with various distance measures are shown in Tables 13, 14, 15 and 16. From these results, it is observed that for SOM with Gridtop structure, efficient results are obtained by evpPDF for linkdist distance measure, chi2PDF for man dist distance measure, evpPDF for dist distance measure and chi2PDF for box dist distance measure.
Dist-FPR
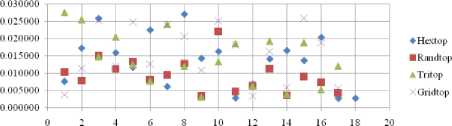
Fig. 27. FPR Comparison Result of SOM-dist distance measure with various topology functions.
The present paper extended the present approach with the normalization (norm) process. This will normalizes the derived feature vector to a length of 1 and the normalized result is given to the SOM with various topology structures, distance functions. The proposed approach is extended with various probability distribution functions (PDFs). For this, the present paper uses the following PDFs.
-
• Poisson PDF (poisPDF)
-
• Exponential PDF (expPDF)
-
• Extreme Value PDF (evpPDF)
-
• Weibel PDF (wblPDF)
-
• Chi Square PDF (chi2PDF)
These results are evaluated with SOM neighborhood size=3. The SOM with Hextop structure is used for the evaluation and the performance measures with various distance measures are shown in Tables 1, 2, 3 and 4. From these results, it is observed that for SOM with Hextop structure, efficient results are obtained by evpPDF for linkdist distance measure, poisPDF for man dist distance measure, evpPDF for dist distance measure and poisPDF for box dist distance measure. The SOM with Randtop structure is used for the evaluation and the performance measures with various distance measures are shown in Tables 5, 6, 7 and 8. From these results, it is observed that for SOM with Randtop structure, efficient results are obtained by original (org) for linkdist distance measure, chi2PDF for man dist distance measure, norm for dist distance measure and evpPDF for box dist distance measure. The SOM with Tritop structure is used for the evaluation and the performance measures with various distance measures are shown in Tables 9, 10, 11 and 12. From these results, it is observed that for SOM with Tritop structure, efficient results are obtained by chi2PDF for linkdist distance measure, evpPDF for man
Table.1 Hextop-linkdist with neighborhood=3
|
FNR |
FPR |
TPR |
TNR |
|
|
org |
0.011099 |
0.011622 |
0.921712 |
0.988901 |
|
norm |
0.011090 |
0.009224 |
0.857443 |
0.988910 |
|
poisPDF |
0.011221 |
0.000463 |
0.488426 |
0.988779 |
|
expPDF |
0.011173 |
0.004571 |
0.773207 |
0.988827 |
|
evpPDF |
0.011096 |
0.008717 |
0.969061 |
0.988904 |
|
wblPDF |
0.011159 |
0.002972 |
0.797028 |
0.988841 |
|
chi2PDF |
0.011156 |
0.006868 |
0.970909 |
0.988844 |
Table.2 Hextop-man dist with neighborhood=3
|
FNR |
FPR |
TPR |
TNR |
|
|
org |
0.011126 |
0.009069 |
0.935376 |
0.988874 |
|
norm |
0.011049 |
0.020867 |
0.901355 |
0.988951 |
|
poisPDF |
0.011194 |
0.001667 |
0.931667 |
0.988806 |
|
expPDF |
0.011181 |
0.000859 |
0.854697 |
0.988819 |
|
evpPDF |
0.011151 |
0.004452 |
0.984437 |
0.988849 |
|
wblPDF |
0.011117 |
0.013056 |
0.864722 |
0.988883 |
|
chi2PDF |
0.011154 |
0.010463 |
0.922870 |
0.988846 |
Table.3 Hextop- dist with neighborhood=3
|
FNR |
FPR |
TPR |
TNR |
|
|
org |
0.011099 |
0.007640 |
0.925693 |
0.988901 |
|
norm |
0.011094 |
0.010172 |
0.945383 |
0.988906 |
|
poisPDF |
0.011141 |
0.000823 |
0.921399 |
0.988859 |
|
expPDF |
0.011195 |
0.002448 |
0.764219 |
0.988805 |
|
evpPDF |
0.011053 |
0.021482 |
0.956296 |
0.988947 |
|
wblPDF |
0.011177 |
0.002275 |
0.786614 |
0.988823 |
|
chi2PDF |
0.011122 |
0.007053 |
0.970725 |
0.988878 |
Table.4 Hextop-box dist with neighborhood=3
|
FNR |
FPR |
TPR |
TNR |
|
|
org |
0.011136 |
0.007151 |
0.915071 |
0.988864 |
|
norm |
0.011139 |
0.004318 |
0.917904 |
0.988861 |
|
poisPDF |
0.011140 |
0.004769 |
0.950787 |
0.988860 |
|
expPDF |
0.011093 |
0.004384 |
0.806727 |
0.988907 |
|
evpPDF |
0.011126 |
0.014597 |
0.963181 |
0.988874 |
|
wblPDF |
0.011078 |
0.017840 |
0.837715 |
0.988922 |
|
chi2PDF |
0.011175 |
0.004582 |
0.984307 |
0.988825 |
Table.5 Randtop-linkdist with neighborhood=3
|
FNR |
FPR |
TPR |
TNR |
|
|
org |
0.011129 |
0.008218 |
0.980671 |
0.988871 |
|
norm |
0.011125 |
0.007328 |
0.837116 |
0.988875 |
|
poisPDF |
0.011169 |
0.002677 |
0.486212 |
0.988831 |
|
expPDF |
0.011174 |
0.001100 |
0.843344 |
0.988826 |
|
evpPDF |
0.011132 |
0.013776 |
0.975113 |
0.988868 |
|
wblPDF |
0.011108 |
0.009069 |
0.757597 |
0.988892 |
|
chi2PDF |
0.011146 |
0.006351 |
0.971427 |
0.988854 |
Table.10 Tritop-man dist with neighborhood=3
|
FNR |
FPR |
TPR |
TNR |
|
|
org |
0.011171 |
0.006931 |
0.948624 |
0.988829 |
|
norm |
0.011040 |
0.012365 |
0.932079 |
0.988960 |
|
poisPDF |
0.011134 |
0.006543 |
0.549012 |
0.988866 |
|
expPDF |
0.011201 |
0.000556 |
0.877222 |
0.988799 |
|
evpPDF |
0.011140 |
0.006906 |
0.981982 |
0.988860 |
|
wblPDF |
0.011161 |
0.004466 |
0.895534 |
0.988839 |
|
chi2PDF |
0.011169 |
0.009286 |
0.912937 |
0.988831 |
Table.6 Randtop-man dist with neighborhood=3
|
FNR |
FPR |
TPR |
TNR |
|
|
org |
0.011183 |
0.008182 |
0.958485 |
0.988817 |
|
norm |
0.011032 |
0.013431 |
0.975458 |
0.988968 |
|
poisPDF |
0.011161 |
0.005278 |
0.661389 |
0.988839 |
|
expPDF |
0.011162 |
0.000513 |
0.855043 |
0.988838 |
|
evpPDF |
0.011023 |
0.017981 |
0.948686 |
0.988977 |
|
wblPDF |
0.011198 |
0.002698 |
0.819524 |
0.988802 |
|
chi2PDF |
0.011142 |
0.004082 |
0.973696 |
0.988858 |
Table.11 Tritop- dist with neighborhood=3
|
FNR |
FPR |
TPR |
TNR |
|
|
org |
0.011081 |
0.010362 |
0.911860 |
0.988919 |
|
norm |
0.011152 |
0.003747 |
0.907364 |
0.988848 |
|
poisPDF |
0.011129 |
0.003589 |
0.518633 |
0.988871 |
|
expPDF |
0.011083 |
0.003586 |
0.829747 |
0.988917 |
|
evpPDF |
0.011055 |
0.026878 |
0.950899 |
0.988945 |
|
wblPDF |
0.011160 |
0.005228 |
0.750328 |
0.988840 |
|
chi2PDF |
0.011141 |
0.007279 |
0.959388 |
0.988859 |
Table.7 Randtop- dist with neighborhood=3
|
FNR |
FPR |
TPR |
TNR |
|
|
org |
0.011034 |
0.016052 |
0.950615 |
0.988966 |
|
norm |
0.011070 |
0.008711 |
0.957956 |
0.988930 |
|
poisPDF |
0.011133 |
0.004264 |
0.473514 |
0.988867 |
|
expPDF |
0.011116 |
0.002873 |
0.841571 |
0.988884 |
|
evpPDF |
0.011117 |
0.015200 |
0.940355 |
0.988883 |
|
wblPDF |
0.011097 |
0.005831 |
0.838613 |
0.988903 |
|
chi2PDF |
0.011060 |
0.014216 |
0.985784 |
0.988940 |
Table.12 Tritop-box dist with neighborhood=3
|
FNR |
FPR |
TPR |
TNR |
|
|
org |
0.011074 |
0.011142 |
0.933302 |
0.988926 |
|
norm |
0.011145 |
0.005568 |
0.905543 |
0.988855 |
|
poisPDF |
0.011133 |
0.003396 |
0.529938 |
0.988867 |
|
expPDF |
0.011061 |
0.010848 |
0.811374 |
0.988939 |
|
evpPDF |
0.011098 |
0.010023 |
0.967755 |
0.988902 |
|
wblPDF |
0.011088 |
0.004139 |
0.818083 |
0.988912 |
|
chi2PDF |
0.011190 |
0.004074 |
0.984815 |
0.988810 |
Table.8 Randtop-box dist with neighborhood=3
|
FNR |
FPR |
TPR |
TNR |
|
|
org |
0.011068 |
0.011504 |
0.955163 |
0.988932 |
|
norm |
0.011127 |
0.006955 |
0.948600 |
0.988873 |
|
poisPDF |
0.011125 |
0.004071 |
0.618152 |
0.988875 |
|
expPDF |
0.011084 |
0.003421 |
0.818801 |
0.988916 |
|
evpPDF |
0.011081 |
0.008237 |
0.991763 |
0.988919 |
|
wblPDF |
0.011152 |
0.008770 |
0.813452 |
0.988848 |
|
chi2PDF |
0.011192 |
0.001202 |
0.976576 |
0.988808 |
Table.13 Gridtop-linkdist with neighborhood=3
|
FNR |
FPR |
TPR |
TNR |
|
|
org |
0.011194 |
0.003035 |
0.952521 |
0.988806 |
|
norm |
0.011070 |
0.012077 |
0.832367 |
0.988930 |
|
poisPDF |
0.011105 |
0.005925 |
0.538520 |
0.988895 |
|
expPDF |
0.011166 |
0.016914 |
0.827531 |
0.988834 |
|
evpPDF |
0.011171 |
0.002690 |
0.975088 |
0.988829 |
|
wblPDF |
0.011077 |
0.016495 |
0.861282 |
0.988923 |
|
chi2PDF |
0.011120 |
0.019133 |
0.958645 |
0.988880 |
Table.9 Tritop-linkdist with neighborhood=3
|
FNR |
FPR |
TPR |
TNR |
|
|
org |
0.011125 |
0.007852 |
0.958815 |
0.988875 |
|
norm |
0.011140 |
0.007000 |
0.804111 |
0.988860 |
|
poisPDF |
0.011105 |
0.005925 |
0.538520 |
0.988895 |
|
expPDF |
0.011119 |
0.007823 |
0.747733 |
0.988881 |
|
evpPDF |
0.011051 |
0.021112 |
0.967777 |
0.988949 |
|
wblPDF |
0.011136 |
0.005208 |
0.794792 |
0.988864 |
|
chi2PDF |
0.011231 |
0.001238 |
0.976539 |
0.988769 |
Table.14 Gridtop-man dist with neighborhood=3
|
FNR |
FPR |
TPR |
TNR |
|
|
org |
0.011137 |
0.007817 |
0.925516 |
0.988863 |
|
norm |
0.011097 |
0.007507 |
0.881382 |
0.988903 |
|
poisPDF |
0.011134 |
0.006543 |
0.549012 |
0.988866 |
|
expPDF |
0.011192 |
0.001840 |
0.831494 |
0.988808 |
|
evpPDF |
0.011061 |
0.012548 |
0.976341 |
0.988939 |
|
wblPDF |
0.011171 |
0.003884 |
0.829449 |
0.988829 |
|
chi2PDF |
0.011152 |
0.006815 |
0.982074 |
0.988848 |
Table.15 Gridtop- dist with neighborhood=3
|
FNR |
FPR |
TPR |
TNR |
|
|
org |
0.011161 |
0.006691 |
0.937754 |
0.988839 |
|
norm |
0.011056 |
0.010466 |
0.845089 |
0.988944 |
|
poisPDF |
0.011129 |
0.003589 |
0.518633 |
0.988871 |
|
expPDF |
0.011162 |
0.016874 |
0.783126 |
0.988838 |
|
evpPDF |
0.011152 |
0.004088 |
0.984801 |
0.988848 |
|
wblPDF |
0.011183 |
0.011806 |
0.832639 |
0.988817 |
|
chi2PDF |
0.011170 |
0.006667 |
0.960000 |
0.988830 |
Table.16 Gridtop-box dist with neighborhood=3
|
FNR |
FPR |
TPR |
TNR |
|
|
org |
0.011143 |
0.007129 |
0.926204 |
0.988857 |
|
norm |
0.011148 |
0.003654 |
0.796346 |
0.988852 |
|
poisPDF |
0.011133 |
0.003396 |
0.529938 |
0.988867 |
|
expPDF |
0.011055 |
0.003738 |
0.774040 |
0.988945 |
|
evpPDF |
0.011003 |
0.024876 |
0.952902 |
0.988997 |
|
wblPDF |
0.011010 |
0.023719 |
0.765170 |
0.988990 |
|
chi2PDF |
0.011123 |
0.007302 |
0.970476 |
0.988877 |
-
V. Conclusion
The present paper proposes an approach for describing the object with spherical contact distribution function. The described features are further represented with normalization and various Probability Distribution Functions (PDFs). Further the represented features are clustered with the Self-Organizing Map (SOM). Experiments are conducted with various topology structures and distance measures. The results show the efficiency of the proposed approach.
References Contact distribution function based clustering technique with self-organizing maps
- A. Kadir et al., "A New Object Recognition Approach Using Combination of Texture, Color and Shape Features", Applied Mechanics and Materials, Vol. 761, pp. 111-115, 2015.
- Shiv Ram Dubey, Anand Singh Jalal, “Fruit and vegetable recognition by fusing colour and texture features of the image using machine learning,” International Journal of Applied Pattern Recognition, Vol. 2, No. 2, 2015, pp. 160-181.
- Srividhya, K. & Ramya, M.M. Multimed Tools Appl (2017).
- Carolina toledo ferraz, Osmando pereira junior, Marcos verdini rosa, and Adilson gonzaga, “Object recognition based on bag of features and a new local pattern descriptor,” International journal of Pattern Recognition and Artificial Intelligence, December 2014, Vol. 28, No. 08, pp. 1-32.
- Marios M. Anthimopoulos , Lauro Gianola, Luca Scarnato, Peter Diem, Stavroula G. Mougiakakou, “A Food Recognition System for Diabetic Patients Based on an Optimized Bag-of-Features Model,” IEEE Journal of Biomedical and Health Informatics, Vol. 18, No. 4, July 2014, pp.1261-1271.
- Zhixiang Ren, Shenghua Gao, Liang-Tien Chia, and Ivor Wai-Hung Tsang, “Region-Based Saliency Detection and Its Application in Object Recognition,” IEEE Transactions on Circuits and Systems for Video Technology, vol. 24, no. 5, may 2014, pp. 769-779.
- Luca Bianchi, Alessandro Martinelli, "A Clustering Approach to Object Estimation, Featuring Image Filtering Prototyping for DBSCAN in Virtual Sets," 14th International Conference on Image Analysis and Processing, 2007.
- Ommer B., Malik J., "Multi-scale Object Detection by Clustering Lines," Proceedings of the IEEE International Conference on Computer Vision, 2009.
- Reshma Y.N., Rokade P.P., "Refined Clustering technique based on boosting and outlier detection," International Journal of Scientific & Engineering Research, Volume 6, Issue 11, November -2015, pp. 472-476.
- Memar Kouchehbagh, Sara, "Semantic Segmentation and Object Detection Based On Active Contour Model and Fuzzy Clustering"(2016).Electronic Theses and Dissertations. Paper 5653.
- Ahmad Jalal, Kamal S., Daijin Kim, "Depth map-based human activity tracking and recognition using body joints features and Self-Organized Map," International Conference on Computing, Communication and Networking Technologies (ICCCNT), 2014.
- Anima Majumder, Laxmidhar Behera, Venkatesh K.Subramanian, "Emotion recognition from geometric facial features using self-organizing map," Pattern Recognition Volume 47, Issue 3, March 2014, Pages 1282-1293.
- Foti Coleca, Andreea State, Sascha Klement, Erhardt Barth, Thomas Martinetz, "Self-organizing maps for hand and full body tracking," Neurocomputing Volume 147, 5 January 2015, Pages 174-184.
- Ning Chen, Bernardete Ribeiro, Armando Vieira, An Chen, "Clustering and visualization of bankruptcy trajectory using self-organizing map," Expert Systems with Applications Volume 40, Issue 1, January 2013, Pages 385-393.
- Nima Torbati, Ahmad Ayatollahi, Ali Kermani, "An efficient neural network based method for medical image segmentation," Computers in Biology and Medicine Volume 44, 1 January 2014, Pages 76-87.
- Brewster E., Keller J.M., Popescu M., "A new approach for extracting texture features to aid detection of explosive hazards using synthetic aperture acoustic sensing," Proceedings Volume 10182, Detection and Sensing of Mines, Explosive Objects, and Obscured Targets XXII; 101821F (2017).
- Rasika Raikar, Shivani Pandita, "Edge Texture Features for Object Recognition," International Journal of Scientific Engineering and Research (IJSER), Volume 3 Issue 8, August 2015, pp. 17-20.
- Kasim Terzić, Sai Krishna, J.M.H.du Buf, "Texture features for object salience," Image and Vision Computing Volume 67, November 2017, Pages 43-51.
- Nithyananda C R, Ramachandra A C, “Adaptive Image Enhancement Using Image Properties and Clustering,” I.J. Image, Graphics and Signal Processing, 8, 2016, 9-14.
- M. M. Zeinali, S. Ghofrani, A. Sengur, “Application-Oriented Farsi ALPD Using Deterministic Edge Clustering,” I.J. Image, Graphics and Signal Processing, Vol.7, No.7, Jun. 201, 1-8.
- M. A. H. Akhand, Mahtab Ahmed, M. M. Hafizur Rahman, “Convolutional Neural Network based Handwritten Bengali and Bengali-English Mixed Numeral Recognition,” .J. Image, Graphics and Signal Processing,9, 2016, 40-50.
- Irene Epifanio, Guillermo Ayala, “A Random Set View of Texture Classification," IEEE Transactions on Image Processing, Vol. 11, No. 8, August 2002, pp. 859-867.
