Contextual Risk-based Decision Modeling for Vehicular Networks

Author: Vijey Thayananthan, Riaz Ahmed Shaikh
Journal: International Journal of Computer Network and Information Security(IJCNIS) @ijcnis
Article in issue: 9 vol.8, 2016.
Free access
A vehicular ad hoc network (VANET) is the emerging technology that allows the drivers to keep the road safety throughout the journey. In VANETs, vehicles can collaborate with each other by exchanging the messages. When these messages are incorrect, drivers will have to face many serious problems which include traffic congestion and minor to fatal road accidents. Therefore, drivers need a method which provides the correct decision using risk analysis calculated from the vehicle context. For this purpose, we propose a new contextual risk-based decision methodology for vehicular networks. This methodology can be used to provide robust and reliable decisions.
Decision Method, Risk Management, Vehicle context, Vehicular Networks
Short address: https://sciup.org/15011569
IDR: 15011569
Text of the scientific article Contextual Risk-based Decision Modeling for Vehicular Networks
Published Online September 2016 in MECS DOI: 10.5815/ijcnis.2016.09.01
With the emergence of Vehicular Ad-hoc Networks (VANETs), researchers have started work on the development of the various different types of safety and traffic efficiency related applications. With the help of these applications, autonomous vehicles communicate with each other to provide a safe and comfortable journey for the drivers and passengers. In order to increase reliability and accuracy of these applications, various researchers have adopted [1-3] and suggested [4] the use of trust management schemes. However, most of those did not incorporate risk in the decision logic.
The risk is essential to incorporate in VANET applications. For example, choosing the correct lane of the road depends on warning messages announced through safety application. Let us assume that, the warning messages for maximum speed limits are m1 (“Lane X is 16m/s”), m2 (“Lane Y is 14m/s”) and m3 (“Lane Z is 12m/s”). Assume that vehicle A is traveling at the speed of 15m/s, and risk values of each lane are 0.4, 0.7 and 1.0 respectively. Based on these warning messages and assumptions, vehicle A can take the correct decision that leads the lane X, which has the lowest risk value among the other lanes. Even vehicle A can increase the speed because the speed limit of the lane X is higher than the speed it was traveling. The sudden speed variation of the vehicles not only affects the risk values but also it spoils the road safety and security of the messages faded by the interruption of sudden speed.
Each vehicle on the road has some messages received from either a calling or non-calling vehicle. Also, each vehicle sends the messages which depend on the current location and situation of the road. Both calling and non-calling vehicles become uncontrollable when they face unwanted threats which are appearing from random sources of vehicles. To minimize such situations, the implementation of risk-based decision system is highly recommended.
In this paper, we have proposed a probability distribution based mathematical model for measuring the risk which forecasts the drivers that they can drive safely through the selected lane. The proposed model calculates the risks which help us to prevent the traffic accident. Each vehicle predicts the risk dynamically derived from vehicle context which includes various parameters like lane type, road type, congestion, weather, speed, and time. When vehicle updates its future risk level as it obtains through the VANET, it takes the decision using risk limit called as a threshold of the risk. If any vehicle gets the risk above the threshold, driver of the vehicle or the future driverless vehicle itself takes risk-mitigating decision [5]. If any vehicle gets the risk below the threshold, they can increase the speed or move into the fast lane, which is available at the time.
The rest of the paper is organized as follows. Section 2 discusses the related work. Section 3 describes the proposed probability-based decision method. Section 4 contains analysis and evaluation of the proposed method. Section 5 describes the recommendations for the future work and directions. Finally, section 6 concludes the paper.
-
II. Related Work
According to Fitzgerald and Landfeldt [6,7], we can calculate the total risk value which is the probability of overall risk. Using the same approach, we can calculate the probability of risk for lane and other parameters used in this research.
According to Boban and Vinhoza [8], García-Costa, et. al. [9], and Boban, et. al. [10], Gap or interval between the vehicles should affect the risk calculations because the mathematical model uses the length of the lanes and the vehicles. Although the recommended time of the interval is around few seconds (2 to 3 seconds), it changes the speed and affects the risk calculations.
Risk analysis of intelligent transport system for vehicular communication depends on the Threat,
Vulnerability, and Risk Analysis (TVRA) methodology Moalla, Labiod, Lonc and Simoni [11]. In this approach, the risk is the multiplication of likelihood and impact which indicates the seriousness of the threats to system resources, services, and users involved in the vehicular communication. The likelihood can be defined that it is the multiplication of the needed capabilities and the motivation. The impact is proportional to the level of the serious problem given in vehicle context. For instance, time keeping of the gap is a serious issue during the driving because it depends on many factors and environmental conditions.
To improve the safety and security, the risk predictions based on the driver's behavior provide necessary information to calculate the risk Vijey et al [12], Kristie et al [13] and McKnight et al [14]. In the current trust management schemes, there are many trust models which include the expansion of the trust conditions Minhas et al [15] and Moharrum and Al-Daraiseh [16], limitations of the trust methods Huang et al [17] and risk prediction. We have studied the risk prediction model which depends on nonlinear regression. According to that, selected model works well with all the necessary conditions and predict the dangers of different road traffic status. An extended version of prediction model may be useful to improve the existing regression models they are the weight function and the Bicubic interpolation method Liu et al [18]. In this model, the following reasonable assumptions need to be considered.
Vd (x, t )=
dx
Where d n(x, t) represents the number of vehicles in location x of the lane at time t .
According to Dang et al [20], the authors assumed that driver behavior comprises two basic actions: changing the car’s speed and changing the wheel turning angle. In their braking model, the deceleration Bb is inversely proportional to the distance of the car from the obstacle S , and directly proportional to its speed S.
Bb = W. (SУ + w,
1 Y
S
-
• Each road has a same number of lanes.
-
• All roads are bi-directional.
-
• All vehicles are equipped with standard wireless communication devices.
-
• Vehicles on the roadway are moving with traffic regulations and driving policies.
-
• Wireless transmission range is definite.
According to Ho et al [19], a particular version of the Poisson Arrival Location Model (PALM) called as a Stochastic model provides interesting results when specific risks are approaching this problem. The PALM adopts an algorithm approach to calculating the risk of moving vehicles. It relies on both the time-dependent behavior and vehicle mobility. Evaluation of the Stochastic approach enhances the accuracy of risk calculations in the traffic model which deals with an approximation of vehicle interactions. The authors have adopted the following equation (Eq. 1) for finding a speed of the vehicle based on the density.
S (x, t ) = S.
Г1 - vm)I k, J
In Eq. 3, speed and distance coefficients are Ws and Ws respectively. Here, a and ^ are constants which depend on the vehicle context and drivers’ behaviour.
According to Zhao and Wu [21], the mathematical model for rule-based decision field theory (RDFT) which is the extension of the Decision Field Theory is discussed with experimental results. Here, driver’s decision-making process regarding speed choice is analyzed with Individual Differences.
As Dhar, Datta, Bera and Ray [22] mentioned in their paper, decision-making approach is illustrated by virtual road traffic scenario. Here, TOPSIS (Technique for Order Preference by Similarity to Ideal Solution), which is a multi-criteria decision making (MCDM) tool is proposed to analyse and test the above-mentioned scenario. In spite of tool’s strength based on decision-making capacity, it is used in multiple applications such as network optimization. In their proposed algorithm, few vehicle contextual parameters such speed of the vehicle are considered.
According to Darus and Bakar [23], safety and comfort of automotive users are considered with suitable algorithm allowed to enhance the vehicle safety standardization in VANET. In order to improve the vehicle safety and comfort, congestion control algorithm is proposed. It not only prevents the congestion in VANETs environment but also it allows drivers or vehicles to take an appropriate decision through the intelligent service which is one of the features in the proposed algorithm.
According to Joe, Shaji and Kumar [24], solution for securing inter-vehicle wireless communication in VANET is established using secure communication. To prevent the vehicular communication from the attackers, the overall solution is valid and interesting, despite the decision model concept used in VANET. The secure vehicular wireless communication increases the quality of services which increase the safety to all road users.
Where, the mean free speed is Sm and jamming density is k j and in Eq. 2, density (Vd) which represents the number of vehicles ( n ) is given as.
In this work, we have determined a risk based on the threat likelihood and the impact. Threat likelihood is determined with the help of vehicle context only. For this
purpose, the following commonly used parameters are selected to establish the appropriate mathematical model.
-
1. Lane ( L ), e.g., straight, curve, winding, Uphill, Downhill, Intersection, Corner.
-
2. Road ( R ), e.g., dry, wet, icy
-
3. Traffic or Congestion ( C ), e.g., the car in front ( F ),
-
4. Weather ( W ), e.g., clear, raining, snowing, foggy, windy.
-
5. Speed ( S ), e.g., accelerating, decelerating, constant
-
6. Time ( T ), e.g., day, night, dusk, dawn.
car on left ( Le ), car on the right ( Ri ), the car in the back ( B ).
speed
Table 1. Indexes of Risks for Restricted and Non-Restricted Lanes
|
No restriction |
With extra restriction |
|||||
|
Downhill |
Uphill |
Corner |
Intersection |
Winding |
||
|
Straight |
1 (i) |
2 (i) |
3 (ii) |
4 (ii) |
5 (ii) |
|
|
Curve |
6 (i) |
7 (ii) |
8 (ii) |
9 (iii) |
10 (iii) |
11 (iii) |
Table 2. Selected Indexes for Risk Calculations
Congested roads in urban areas have too much traffic, which causes the unnecessary accidents. When we avoid the risks as pre-conditions, we can reduce the accidents and unnecessary traffics. Numbers used in the Tables 1 and 2 represent levels of risks in different scenarios. They represent the indexes of which actual probabilities obtain from the mathematical models. Table 1 shows the indexes for a more elaborated form for restricted and non-restricted cases. Here, restrictions of the lanes are useful to which risks derive from risk calculations based on the type of the lanes. In this mathematical model, we have assumed that the three levels of impact (i), (ii), and (iii) represent the seriousness of the risk.
Table 2 shows the indexes for the rest of the five parameters employed in the vehicle context. The congestion parameter has three sub-categories which affect the overall risk calculation; they are small, medium and large vehicles.
The likelihood analysis affects the risk values influenced by the Eq. 4, which depends on functions of probabilities calculated from the environmental conditions, the situation of the road, etc. Selected constants (p , p , p , p , p and p ) are values of probabilities estimated
VC = f ( P l, P r ,P c, P w, P s, P t ) (4)
In most of the situations, we can determine the reasonable values of input parameters using probability distributions and statistical approaches which deal with mean, standard deviation, etc. In this calculation, we have introduced the new measurement of the congested lane given in the following section. For instance, the lane probability ( p ) is the total number of risk-related problems estimated in 11 different types of the lanes mentioned in Table 1. Other probabilities are also obtainable from Table 2 and vehicle densities. According to the figure 1, we can determine the probability of lanes (p ) based on the lane space (Ls) which depends on the length of the vehicle. Here, we assume that few of all three types (small, medium and large) are on a particular lane. The area of the shaded (yellow color) part in figure 1 represents the probability of the lane.
The level of the risk directly influence with the values of probability depended on the traffic situation because speed changes the lane space and vehicle density.
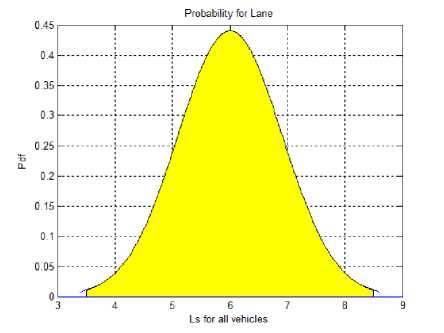
Fig.1. Probability of Lane at 10km/h Speed
-
B. Traffic or congestion
Traffic calculation is the main part of vehicle context because it depends on the length of the vehicles and the gap between the vehicles. So, these calculations are also important in our model to determine the risk. The vehicle density V can be calculated by Eq. 5, where n is the total number of vehicles within the selected length l .
V = n d l
Table 3 shows the probability of congestion ( p ) estimated from vehicle density.
Table 3. Probability of Three Different Vehicles
|
Vehicle types |
Vehicle Length (m) |
Assumed Probability |
Number of vehicles |
|
|
10km/h |
20km/h |
|||
|
Small |
3.5 |
0.59 |
30 |
18 |
|
Medium |
5 |
0.32 |
16 |
10 |
|
Large |
8.5 |
0.09 |
4 |
2 |
The density (V ) of the traffic flow is defined as the numbers of vehicles per unit road. Inverse of the density is the gap, which corresponds to the distance between two vehicles, V = 1/g, where g represents a gap. As shown in figure 2, the probability of congestion (p ) for all three types of vehicles is estimated using lane space during the congestion. In figure 2, the keeping time is varied according to the types of vehicles, speed, and environmental conditions. The level of the risk should be changing when vehicles take the decision based on time of the gap.
Traffic depends on many factors such as length of the vehicles, the gap between the vehicles, etc. This gap not only varies with the speed of the vehicles but also other factors used in the vehicle context. When speed is increasing, recommended time of the gap will be reduced according to the length of the vehicles.
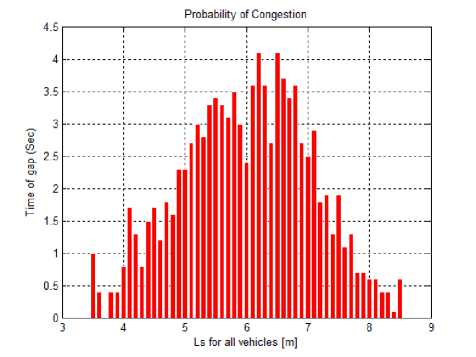
Fig.2. Probability of Possible Time Gap at 1km Vehicle Density
n = Jbi = Lv + g < 100
i = i (6)
Using Eq. 6, the lane space (Ls) can be defined that the total length (L ) of the vehicle and required interval (g=1/V ) which avoids the colliding risks. Average Ls is required to calculate the risk because Ls is varied according to the type of the vehicles and the intervals. When waiting time increases in specific lanes, the traffic density increases with the length of the lane. Here, the speed of the vehicles should be assumed that vehicles in specific lane use constant speed.
-
C. Likelihood of vehicle context
The probability distribution of individual parameter selected for vehicle context allows us to determine the likelihood of the vehicle context. According to [11], likelihood is the multiplication of needed capabilities and motivation. As shown in figure 3, we have selected the probability of road (p ), weather (p ), speed (p ) and time (p ) using g depended on the vehicle density. In the likelihood calculation, g dominates the levels of risk depended on the needed capabilities and motivation of the attacker. In the vehicle context, indexes of each parameter represent the needed capabilities. Motivations influenced with probabilities of individual parameters are changing according to the situation at the time.
When the speed of the vehicles becomes faster, g increases to avoid the colliding risk. It does not only depend on the speed but also, it influences with individual parameters mentioned in the vehicle context. The probability distribution of g depends on these parameters and allows us to choose (i), (ii) and (iii) as Unlikely, Possibly and Likely respectively.
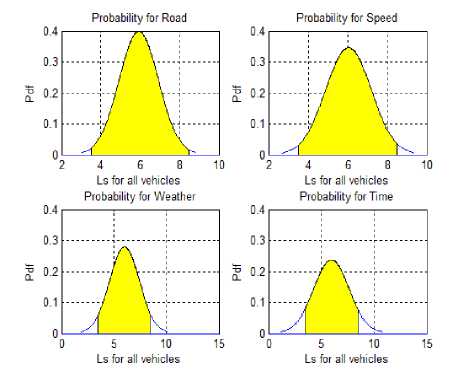
Fig.3. Probabilities of Selected Parameters at 10k/h
Also, we can measure the likelihood ( L ) using probabilities influenced with g which varies according to the situation based on vehicle context. The probability values obtained from above figures allow us to implement the following equation.
L C
_ Pl Z^ + P R Z> + P c Z^ + P w EW + P s Z X S + P t Z^ i
6x
Using Eq. (7), we can calculate the likelihood (L ) which allows us to estimate the risk depended on the impact values.
-
D. Impact selection
In this paper, impact influences with which sensitivity levels depend on the gap between the two vehicles, braking distances based on the environmental conditions, etc. The impact depends on the risk limit (R ) selected from the manageable likelihood values. Table 4 shows the ideal values for the risk limits of vehicle context.
Table 4. Impact Selection for Vehicle Context
|
Likelihood |
Impact |
||
|
4>R ≥3 |
3>R ≥2 |
2>R ≥1 |
|
|
Unlikely (i) |
3 |
2 |
1 |
|
Possible (ii) |
3.3 |
2.3 |
1.4 |
|
Likely (iii) |
3.5 |
2.7 |
1.8 |
The risk limit changes when the maximum limit of the usable speed is set to some fixed values as given in Table 4. These values allow us to determine the impact which is the level of the serious problems and risk as in Eq. 8. The likelihood (Eq. 7) obtained from Table 1 and 2, where we used the selected indexes as random values.
Risk(Rc ) = Likelihood (Lc) * impact
Using Eq. 8, we can calculate the total risk value (R ) of vehicle context using statistical approach illustrated in figures 1, 2 and 3. Here, the decision depends on the risk limit of the vehicle context (R ) which is the fixed value obtained from the actual situation of the congested lanes. The risk estimation procedures which depend on the risk limits, (R ) show that they depend on the likelihood of the vehicle context. For instance, this procedure allows drivers to take the correct decision with the following condition.
Decision = <
Reduce if RIncrease if R
> Rc
< Rc
Drivers can correct their mitigating behaviors such increasing speed if R
-
E. Discussion
The density of vehicles on a selected lane with all assumptions allows us to form a mathematical model. To calculate the total risk, this model focuses on some conditions and random index values obtained from the parameters used in the proposed research. Risks depend on a combination of multiple situations, drivers’ behavior, etc., and they need solutions which use the following assumptions.
-
• Traffic conditions created by risks, reduce the speeds of the vehicles and stop for a while or keep a constant speed. In this case, average speed must be used.
-
• Slow moving traffic (speed) which is less than 30km/h needs to be considered in our mathematical model.
-
• The road situations not only dePend on the weather conditions but also, they create the traffic when vehicles are approaching the residential areas, schools, industries, etc. For example, residential areas should have more sedans and many speed brakes which fix the different average speed.
We studied the gap between the neighboring vehicles and analyzed with the probabilities which depend on the situations, environmental conditions, and drivers’ attitude. The best and safest time keeping between the two vehicles is about 2 to 5 seconds, which directly depend on the speed and length of the vehicle. When drivers maintain the 2 seconds, the gap should be increased with the speed of the vehicle.
-
IV. Results and Analysis
In this analysis, figure 4 shows the risk values calculated from Eq. 9. Although we considered many assumptions, basic results from the mathematical model helps us to analyze the risk values which determine the decisions. To calculate the total risk value, overall and individual likelihood analyzes based on the parameters used in the vehicle context are shown in figures 6 and 7.
Analysis of the results (figure 4, 6 and 7) depends on the input data and assumptions. As an input data, we have selected 100 random samples which correspond to the indexes used in table 1 and 2. In these samples, we assume that at least five vehicles involve in the risk calculations.
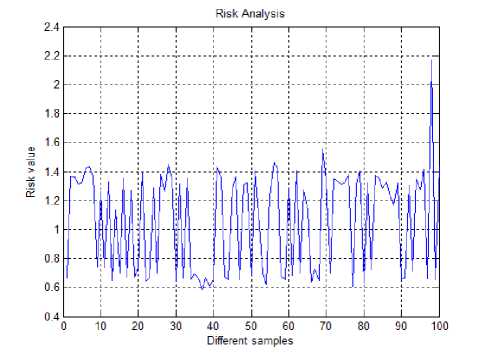
Fig.4. Risk Analysis of Vehicle Context
The risk value calculated in figure 4 is essential to analyze following scenario of the practical problems based on the weather conditions.
Clear: Choosing the correct lane of the road during the clear weather condition depends on the risk value based on the seriousness of the risk as in table 2. In spite of warning messages influenced with the braking distances display in the dashboard through safety application, the risk value helps drivers to take the correct decision. For instance, when 3 vehicles (A, B, and C) are moving in 3 lanes (X, Y, and Z) within the maximum speed limit of lanes x, y and z respectively, all 3 vehicles should be able to manage the braking distances based on the risk values. Here, we should assume that all vehicles are the same type and the gap between two vehicles must be same. Although risk value of the each lane considered as 0.25, 0.45 and 0.75, the correct braking distance of each lane not only depends on the pure risk values but also it depends on the actual speed of the vehicles at the level of clear weather such as direction or angle of sunlight . If each speed of the vehicle is less than the maximum speed of the lane, the lane X will be decided as best and secure lane for all three vehicles. When both speed limit and speed of the vehicle are same, lane X or Y will be chosen. Whatever risk values, the gap between the vehicles should be maintained within the lanes. Decision-making based on the gap which avoids the accidents depends on the braking distance.
Raining or Snowing: Choosing the correct lane of the road during the raining depends on the risk value focusing on the braking distance. Here, the seriousness of the risk is slightly higher than the clear weather. In spite of warning messages influenced with the braking distances during the persistent raining or heavy snowing, final decision making depends on the risk value displayed in the dashboard through safety application. For instance, when three vehicles (A, B, and C) are moving in three different lanes
(X, Y, and Z) within the maximum speed limit of lanes x , y and z respectively, all three vehicles should be able to manage the braking distances based on the seriousness of the risk. Here, the probability of risk values always depends on the level of the weather conditions (min 1 to max 10). When the level of the weather condition increases the braking distances must be increased. Here, we should assume that all vehicles are the same type and the level of the weather condition is fixed. When risk value of the each lane considered as 0.35, 0.5 and 0.85, the focusing correct braking distances depends on the speed of the vehicles. If each speed of the vehicle is less than the maximum speed of the lane, the lane X will be decided as chosen lane for all three vehicles. If the level of the weather condition is different respect to the time and location of the each lane, the probability of risk value will be changing dynamically. Here, dynamic decision making which could be calculated from our proposed model will be useful.
Foggy or Windy: Choosing the correct decision on the lane during these weather conditions depend on the risk value. In spite of warning messages influenced with the braking distances display in the dash through safety application, the risk value helps drivers to correct decision. For instance, when three vehicles (A, B, and C) are moving in three lanes (X, Y and Z) within the maximum speed limit of the lane x, y and z respectively, all three vehicles should be able to manage the braking distances based on these extreme weather conditions which increase the risk values. Here, we should assume that all vehicles are the same type and the level of the weather condition is fixed. When risk value of the each lane considered as 0.71, 0.84 and 0.92, the decision making of changing lanes is not advisable.
-
A. Analysis of gaps with different speeds
As shown in figure 5, we can analyze the recommended gaps for different vehicle contexts proposed in this paper. Here, we focus on different speeds which determine the gap between the two vehicles. Recommended gaps are within 2 to 3 seconds which are the secure time limitations to take the proper decisions.
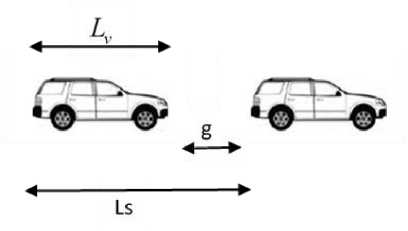
Fig.5. Gap Analysis for Different Vehicle Speeds
Using these time limitations, the driver can take a decision but our proposed model collects all necessary information based on the vehicle context and calculates the secure gaps. In spite of its gaps, decision making within the time frame is very important because most of the functions used in the vehicles should be secured. In table 5, we have calculated the gaps for minimum and maximum time limitations which depend on the types and speeds of the vehicles. In practical, 2 seconds time gap is the best and it increases the probability of security and safety.
Ls = Lv + g (9)
In our proposed model, we can analyze following speeds with minimum (2 Seconds) and maximum (3 seconds) time limitations. Using (9), lane space (Ls) for 2 and 3 seconds can be calculated.
Table 5. Required Lane Space at Different Speeds
|
Speed |
Vehicle types |
Lane space For 2s |
Secure gaps for 2s |
Secure gaps for 3s |
|
15 km/h (4.2m/s) |
Small (3.5m) |
11.9m |
8.4m |
12.6m |
|
50km/h (13.9m/s) |
small |
31.3m |
27.8m |
41.7m |
|
120km/h (33.6m/s) |
small |
70.7m |
67.2m |
100.8m |
|
10km/h (2.8m/s) |
Medium (5m) |
10.6m |
5.6m |
8.4m |
|
40km/h (11.2m/s) |
medium |
27.4m |
22.4m |
33.6m |
|
110km/h (30.8m/s) |
medium |
66.6m |
61.6m |
92.4m |
|
5km/h (1.4m/s) |
Large (8.5m) |
11.3m |
2.8m |
4.2m |
|
30km/h (8.4m/s) |
large |
25.3m |
16.8m |
25.2m |
|
100km/h (28m/s) |
large |
64.5m |
56m |
84m |
-
B. Analysis of gaps with different risk values
The risk values obtained from different vehicle contexts can be used to determine the required gaps for different situations. The gap between the vehicles and braking distances increase when the risk value increases. Based on the parameters used in vehicle context, conditions of the road are important in this analysis. In spite of its icy condition, some vehicles move safely and handle the secure communication when risk value is very low. In this analysis, risk values influenced with road conditions should have following assumptions.
Dry: In order to determine the risk value, the temperature of the road should be fixed.
Wet: The liquid type such as water and oil might be spilled on the road. Here, the liquid type should be fixed as well, otherwise, friction between the wheel and road affect the speed and risk value.
Icy: It depends on the decreasing temperatures and the thickness level of the snow. In spite of road’s wet and icy condition, temperatures and the thickness should be fixed.
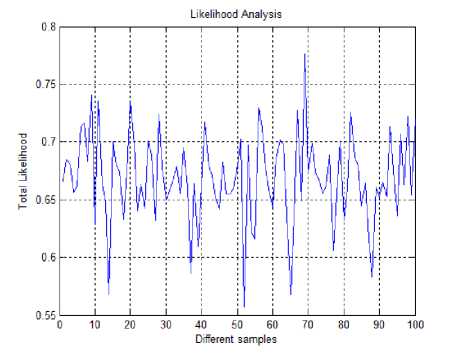
Fig.6. Overall Likelihood of Vehicle Context
In order to determine the total likelihood shown in figure 6, calculating g in the various situation is important in this analysis. When gap increases, the risk should be decreased but the levels of risk depended on the needed capabilities and motivation of the attacker are increased. So, g must be within the limit which provides the maximum security and safety. Each parameter mentioned in table 1 and 2 can be elaborated with the practical scenarios. The probability of the risk not only depends on the given parameters but it also influences with the seriousness of the risk.
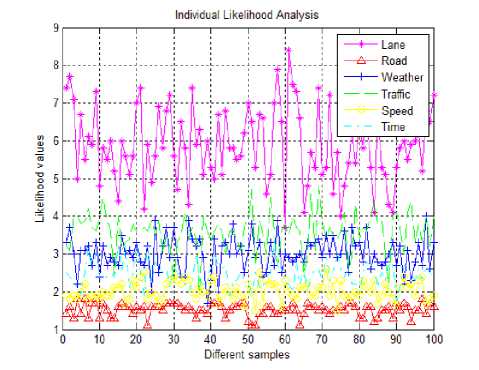
Fig.7. Likelihood Analysis used in Vehicle Context
-
V. Recommendations And Future Work
Driverless vehicles need some form of standard automation programs which not only provide the security but also they prevent the unnecessary accidents. To improve the accuracy of the proposed risk model, we need to optimize the risk values using improved algorithms such as stochastic and regression.
-
A. Stochastic approach
According to our proposal, a lane can be improved using a Stochastic model which provides the accuracy of the risk calculation. In our model, road, weather and time [6] (day periods) are parts of the environmental conditions. They can be analyzed using a Stochastic model which depends on the random values and relative distributions of the environmental conditions. Parameters used in the [ ] vehicle context are time dependent with the relevant distributions which deal with actual limitation and conditions of real situations. [8]
B. Nonlinear regression approach
We can assume that connectivity probability (Eq. 10) is proportional to risk based on traffic or congestion C formed as (Eq. 2). Here, γ is depending all other parameters used in the vehicle context. The speed of the vehicle v depends on many factors, such as drivers’ decisions and conditional based road regulations, environmental behaviors, etc.
C = Y f ( n , I, v ) (10) [11]
The accuracy of the total risk depends on n , l , v and γ. When C is calculated in a real environment, weather conditions are very important because number of vehicles and distance between the two vehicles are different.
-
VI. Conclusion
Analysis of risk based on the vehicle context provides some solutions to potential problems, e.g., an improvement of security, safety, and protection against road accidents. We have derived the mathematical model which allows the vehicle to take the correct decision when the prediction of risks is approaching. Before initiate the [16] driving or while driving, our proposed model provides the prediction of the risks calculated from vehicle context which includes road and lane type, congestion, weather, [17] speed and time. In this paper, we have provided a theoretical analysis of the proposed solution and also suggested future work.
[18] REFERENCES
Wei, Y. C., and Chen, Y. M., “Adaptive Decision Making for Improving Trust Establishment in VANET”, in Proc. 16th Asia-Pacific Network Operation and Management Symposium, Taiwan, Sep 2014, pp. 1-4.
Shaikh, R. A., and Alzahrani, A. S., “Intrusion-aware trust model for vehicular ad hoc networks”, Security and Communication Networks, vol. 7 (11), pp. 1652–1669, 2014.
Cohen, R., Zhang, J., Finnson, J., Tran, T., and Minhas, U. F., “A Trust-Based Framework for Vehicular Travel with Non-Binary Reports and Its Validation via an Extensive Simulation Testbed”, Journal of Trust Management, vol. 1(1), pp. 1-31, 2014.
De Fuentes, J. M., González-Manzano, L., González-Tablas, A. I., and Blasco, J., “Security models in Vehicular ad-hoc networks: A survey”, IETE Technical Review, 31(1), pp. 47-64, 2014.
Stoneburner G, Goguen A, Feringa A., “Risk management guide for information technology systems”, Tech. Rep. SP 800e30. NIST; July 2002.
Fitzgerald, E., and Landfeldt, B., “On Road Network Utility Based on Risk-Aware Link Choice”, in proc. 16th Int. IEEE Conf. on Intelligent Transportation Systems-(ITSC), pp. 991-997, 2013.
Fitzgerald, E., and Landfeldt, B., “Increasing Road Traffic Throughput through Dynamic Traffic Accident Risk Mitigation”, Journal of Transportation Technologies, vol. 5, pp. 223-239, 2015.
Boban, M., and Vinhoza, T. T.V., “Modeling and simulation of vehicular networks: Towards realistic and efficient models”, INTECH Open Access Publisher, 2011. García-Costa, C., Tomás-Gabarrón, J.B., Egea-López, E. and García-Haro, J., "Speeding Up the Evaluation of a Mathematical Model for VANETs Using OpenMP", Simulation and Modeling Methodologies, Technologies and Applications. Springer Berlin Heidelberg, pp. 23-37, 2013.
Boban, M., Vinhoza, T. T. V., Barros, J., Ferreira, M. and Tonguz, O. K., “The impact of Vehicles as Obstacles in Vehicular Ad Hoc Networks”, IEEE Journal on Selected Areas in Communications 29(1), pp. 15–28, 2011.
Moalla, R., Labiod, H., Lonc, B., and Simoni, N., “Risk Analysis Study of ITS Communication Architecture”, in proc. 3rd Int. Conf. on the Network of the Future, 2012.
Vijey T., Alzahrani, A., and Qureshi, M. S., "Risk prediction system based on MIMO system for vehicle users", Life Science Journal, Vol. 10(4), pp. 3055-3061, 2013.
Kristie, Y., Lee, J.D., and Regan, M.A., eds. Driver Distraction: Theory, Effects, and Mitigation. CRC Press, 2008.
McKnight, A. James, and A. Scott McKnight. "The effect of cellular phone use upon driver attention." Accident Analysis and Prevention 25(3), pp. 259-265, 1993.
Minhas U, Zhang J, Tran T, and Cohen R., “Towards expanded trust management for agents in vehicular ad-hoc networks”, Int. Journal of Computational Intelligence: Theory and Practice, 5(1), pp. 3–15, 2010.
Moharrum M.A, and Al-Daraiseh A. A., “Toward Secure Vehicular Ad-hoc Networks: A Survey”, IETE Technical Review, vol. 29(1), pp. 80-89, 2012.
Huang, Z., Ruj, S., Cavenaghi, M., and Nayak, A.,
"Limitations of Trust Management Schemes in VANET and Countermeasures", in proc. IEEE 22nd Int. Sym. on personal, indoor and mobile radio communications, pp. 1228-1232, 2011.
Liu, H., Yang, L., Ding, S., and Shi, Y. “Logical Connectivity Prediction Models for VANET based on Nonlinear Regression and ELM: An Example of the AODV Protocol”, International Journal of Future Generation Communication and Networking, vol. 7(6), pp. 217-230, 2014.
Ho, I. W. H., Leung, K. K., and Polak, J. W. “Stochastic Model and Connectivity Dynamics for VANETs in Signalized Road Systems”, IEEE/ACM Trans. on Networking, vol. 19(1), pp. 195-208, 2011.
Dang, V. C., Kubo, M., Sato, H., Yamaguchi, A., and Namatame, A., “A Simple Braking Model for Detecting Incidents Locations by Smartphones”, in proc. 2014 Seventh IEEE Symposium on Computational Intelligence for Security and Defense Applications (CISDA), pp. 1-5, 2014.
Dhar, S., Datta, S., Bera, R.N. and Ray, A. “Fast Vertical Handover Algorithm for Vehicular Communication: A
Holistic Approach”, International Journal of Computer Network and Information Security, 4(3), pp.8-15, 2012.
-
[23] Darus, M.Y. and Bakar, K.A. “Formal verification of congestion control algorithm in VANETs”, International Journal of Computer Network and Information Security, 5(4), pp.1-7, 2013.
-
[24] Joe, M.M., Shaji, R.S. and Kumar, K.A.”Establishing inter vehicle wireless communication in vanet and preventing it from hackers”, International Journal of Computer Network and Information Security, 5(8), pp.55-61, 2013.

vehicular networks.
Riaz Ahmed Shaikh is an Assistant Professor at Computer Science Dept. in the King Abdulaziz University, Jeddah, Saudi Arabia. He obtained his Ph.D. from Computer Engineering Dept., of Kyung Hee University, Korea, 2009. His research interest includes privacy, security, trust management, wireless sensor networks, risk management, & For more information please visit
References Contextual Risk-based Decision Modeling for Vehicular Networks
- Wei, Y. C., and Chen, Y. M., "Adaptive Decision Making for Improving Trust Establishment in VANET", in Proc. 16th Asia-Pacific Network Operation and Management Symposium, Taiwan, Sep 2014, pp. 1-4.
- Shaikh, R. A., and Alzahrani, A. S., "Intrusion-aware trust model for vehicular ad hoc networks", Security and Communication Networks, vol. 7 (11), pp. 1652–1669, 2014.
- Cohen, R., Zhang, J., Finnson, J., Tran, T., and Minhas, U. F., "A Trust-Based Framework for Vehicular Travel with Non-Binary Reports and Its Validation via an Extensive Simulation Testbed", Journal of Trust Management, vol. 1(1), pp. 1-31, 2014.
- De Fuentes, J. M., González-Manzano, L., González-Tablas, A. I., and Blasco, J., "Security models in Vehicular ad-hoc networks: A survey", IETE Technical Review, 31(1), pp. 47-64, 2014.
- Stoneburner G, Goguen A, Feringa A., "Risk management guide for information technology systems", Tech. Rep. SP 800e30. NIST; July 2002.
- Fitzgerald, E., and Landfeldt, B., "On Road Network Utility Based on Risk-Aware Link Choice", in proc. 16th Int. IEEE Conf. on Intelligent Transportation Systems-(ITSC), pp. 991-997, 2013.
- Fitzgerald, E., and Landfeldt, B., "Increasing Road Traffic Throughput through Dynamic Traffic Accident Risk Mitigation", Journal of Transportation Technologies, vol. 5, pp. 223-239, 2015.
- Boban, M., and Vinhoza, T. T.V., "Modeling and simulation of vehicular networks: Towards realistic and efficient models", INTECH Open Access Publisher, 2011.
- García-Costa, C., Tomás-Gabarrón, J.B., Egea-López, E. and García-Haro, J., "Speeding Up the Evaluation of a Mathematical Model for VANETs Using OpenMP", Simulation and Modeling Methodologies, Technologies and Applications. Springer Berlin Heidelberg, pp. 23-37, 2013.
- Boban, M., Vinhoza, T. T. V., Barros, J., Ferreira, M. and Tonguz, O. K., "The impact of Vehicles as Obstacles in Vehicular Ad Hoc Networks", IEEE Journal on Selected Areas in Communications 29(1), pp. 15–28, 2011.
- Moalla, R., Labiod, H., Lonc, B., and Simoni, N., "Risk Analysis Study of ITS Communication Architecture", in proc. 3rd Int. Conf. on the Network of the Future, 2012.
- Vijey T., Alzahrani, A., and Qureshi, M. S., "Risk prediction system based on MIMO system for vehicle users", Life Science Journal, Vol. 10(4), pp. 3055-3061, 2013.
- Kristie, Y., Lee, J.D., and Regan, M.A., eds. Driver Distraction: Theory, Effects, and Mitigation. CRC Press, 2008.
- McKnight, A. James, and A. Scott McKnight. "The effect of cellular phone use upon driver attention." Accident Analysis and Prevention 25(3), pp. 259-265, 1993.
- Minhas U, Zhang J, Tran T, and Cohen R., "Towards expanded trust management for agents in vehicular ad-hoc networks", Int. Journal of Computational Intelligence: Theory and Practice, 5(1), pp. 3–15, 2010.
- Moharrum M.A, and Al-Daraiseh A. A., "Toward Secure Vehicular Ad-hoc Networks: A Survey", IETE Technical Review, vol. 29(1), pp. 80-89, 2012.
- Huang, Z., Ruj, S., Cavenaghi, M., and Nayak, A., "Limitations of Trust Management Schemes in VANET and Countermeasures", in proc. IEEE 22nd Int. Sym. on personal, indoor and mobile radio communications, pp. 1228-1232, 2011.
- Liu, H., Yang, L., Ding, S., and Shi, Y. "Logical Connectivity Prediction Models for VANET based on Nonlinear Regression and ELM: An Example of the AODV Protocol", International Journal of Future Generation Communication and Networking, vol. 7(6), pp. 217-230, 2014.
- Ho, I. W. H., Leung, K. K., and Polak, J. W. "Stochastic Model and Connectivity Dynamics for VANETs in Signalized Road Systems", IEEE/ACM Trans. on Networking, vol. 19(1), pp. 195-208, 2011.
- Dang, V. C., Kubo, M., Sato, H., Yamaguchi, A., and Namatame, A., "A Simple Braking Model for Detecting Incidents Locations by Smartphones", in proc. 2014 Seventh IEEE Symposium on Computational Intelligence for Security and Defense Applications (CISDA), pp. 1-5, 2014.
- Zhao, G., and Wu, C. "Mathematical Modeling of Driver Speed Control With Individual Differences", IEEE Trans. on Systems, Man., & Cybernetics: Systems, vol. 43(5), pp. 1091-1104, 2013.
- Dhar, S., Datta, S., Bera, R.N. and Ray, A. "Fast Vertical Handover Algorithm for Vehicular Communication: A Holistic Approach", International Journal of Computer Network and Information Security, 4(3), pp.8-15, 2012.
- Darus, M.Y. and Bakar, K.A. "Formal verification of congestion control algorithm in VANETs", International Journal of Computer Network and Information Security, 5(4), pp.1-7, 2013.
- Joe, M.M., Shaji, R.S. and Kumar, K.A."Establishing inter vehicle wireless communication in vanet and preventing it from hackers", International Journal of Computer Network and Information Security, 5(8), pp.55-61, 2013.
