Convergence regions in European Union: features and the evaluation

Author: Voronov Viktor Vasilevich
Journal: Economic and Social Changes: Facts, Trends, Forecast @volnc-esc-en
Section: Theoretical issues
Article in issue: 6 (36) т.7, 2014.
Free access
The process of alignment of socio-economic development of countries and regions in the European Union (EU) - is an important aspect of European integration, which is ambiguous. Common Market Act, which is aimed at improving the economic efficiency of the entire EU, became the subject of many discussions of European researchers, which claimed that its viability on the political and socio-economic levels depends on the ability to fairly distribute the resulting gains between countries and regions in the EU. As the result of these discussions there was a significant increase in funds allocated for the development of the regions of the EU Structural Funds, the Cohesion Fund and consolidation goals to equalize levels of development of the regions in the first section of the Single European Act. How effective are these efforts shows the presented analysis and assessment of regional convergence (by GDP per capita at purchasing power parity) during the economic boom of the EU (1995-2004) and in the period 2004-2011, when 12 countries in Central and Eastern Europe joined the EU at the same time.
Alignment, development, convergence, divergence, region, european union
Short address: https://sciup.org/147223684
IDR: 147223684 | UDC: 330.341.44 | DOI: 10.15838/esc/2014.6.36.7
Text of the scientific article Convergence regions in European Union: features and the evaluation
Introduction. To increase the degree of the EU member states cohesion is an important aspect of the European integration and consolidation process. At the same time, the effectiveness of this policy for regions of different levels is still doubtful. Is there the regions’ convergence at all levels in the EU? Does it have a selective character and its own features in regions of different levels? Therefore, the analysis is aimed at evaluating the regions of NUTS level 1, 2 and 3 in 1995–2011.
The European scientists’ studies have argued that the viability of the European Union at the political and social levels depends on the ability to fairly divide the realized gain between the countries and the regions. These discussions resulted in the significant increase in the EU budget funds allocated to regional policy, as well as in the elaboration of the goal to equalize the level of regions’ development in the first section of the Single European Act (1989). The European Union provides over a one third of the budget expenses on regional development from the structural funds and the Cohesion Fund. After the 2008 crisis the policy to align the imbalances in the EU regions development has been mainly focused on the support of the new EU members that can ambiguously affect the differentiation of the development of “new” and “old” EU countries.
Uneven economic development is a fundamental principle of the modern market society. The inequality follows from a different scale of production and funding, belonging to different economy sectors. It also has historical roots. The EU has been implementing an active regional policy for decades, resulting in the adjustment of all existing EU regions. In 2003 in order to perform statistical accounting on the basis of a legal act (regulation) of the European Parliament the union introduced a Nomenclature of Units for Territorial Statistics, i.e. NUTS (for French nomenclature des unites territoriales statistiques , NUTS – a standard of territorial division in the countries and within the countries of the European Union for statistical purposes) [1]. The author considers a “region” as statistical regions of the EU, selected on the basis of the specified regulation. There are three levels of NUTS regions and two levels of local administrative units. There are regions of the 1st level (NUTS 1) in Germany (16
L a nder (Federal States) and several other large countries, while several smaller EU countries (Denmark, Luxembourg, Ireland, Cyprus, Malta, Slovenia, Slovakia, the Czech Republic and three Baltic States) are divided only into the regions of the 2nd level (NUTS 2) or of a lower level. While implementing regional policy in the EU the authorities pay more attention to the 1st and 2nd levels than to the 3rd. The main criterion to identify the region’s levels is a number of the population. So, there is the following division: NUTS level 1 – the population amounts to 3–7 million people (reflects the national level for all EU member states), NUTS level 2 – from 800 thousand to 3 million people (reflects the level of sub-regions included in each EU country, except for Lithuania, Latvia, Estonia, where the NUTS level 1 coincides with NUTS level 2), NUTS level 3 – from 150 thousand to 800 thousand people (this is a level of small regions included in the subregions). In the EU as of December 31, 2011 there were 97 regions of NUTS level 1, 271 regions of NUTS level 2 and 1303 of NUTS level 3.
The main provisions of the convergence theory. Social sciences consider convergence (“converge” – lat.) as contingence, concurrence of similar but not identical objects. In the second half of the 20th century the Western scientists understood convergence as contingence of capitalism and socialism as two types of industrial society on the similar technological basis, for example, D. Bell [2], J. Galbraith [3] and others. To date the theoretical content and practical meaning of the notion “convergence” in social science has lost its political aspect and expanded due to the deepening differentiation of the branches of sociological and economic sciences. Social scientists (experts in economic and regional sociology), economists (experts in econometrics, regional economics) actively use this notion in the studies of uneven socio-economic development of territories, territorial differentiation and regional integration for their cohesion and consolidation. Consolidation of territories is analyzed on the basis of different convergence concepts. There are the following types of convergence: interregional and inter-country, convergence in terms of growth rates or income levels, absolute and conditional, club, β-convergence and σ-convergence [4]. The Russian science usually interchangeably uses terms “contingence”, “concurrence” “reducing disparities”, “alignment” and “convergence”, views “discrepancy”, “differentiation”, “polarization”, ‘split”, “divergence” as their antonyms. The studies of European sociologists and economists have adopted the terms “convergence” and “divergence”. The author follows this tradition, using Russian terms, where it is justified. In the work the term is interpreted in the following way: convergence is a process of contingence of the regions’ economic parameters to a certain level.
Convergence from the point of view of growth is defined as alignment of various regional economies to a single trajectory of growth. This approach stems from the assumptions of the neoclassical growth theory [5]. Conditional convergence implies the existence of fundamental differences and the overwhelming heterogeneity of the studied objects, which leads to different economic growth trends. Absolute convergence assumes the homogeneity of the objects and the presence of a single growth trend for all economies. Club convergence as opposed to absolute one suggests that there is no growth trend common for all economies but one for a group of similar economies according to the initial level of development and other characteristics.
β -convergence determines the presence of a negative correlation between the growth rate and the initial level of economic development. It is conceptualized as a process of “replacement” when poor countries or regions have higher rates of economic growth. And σ-convergence is a more general case; it implies reduced time for the spread of the studied objects characteristics in the sample of countries or regions.
The studies of β -convergence and σ-convergence are more widely spread in the scientific literature [6, pp. 50-51; 7, pp. 715-756]. In the term “ β -convergence” the first letter indicates the coefficient given initial GDP per capita in the estimated equation [8; 9]. The hypotheses of β -convergence and σ-convergence are interrelated but not equivalent. Absolute β -convergence is not a consequence of σ-convergence [10, pp. 50-51]. Therefore, the researchers have proposed the interpretation of the relations between absolute β -convergence and σ-convergence [11]. The first indicates the trend to narrow the gap in GDP per capita. At the same time, random shocks affecting regional economy can counteract this trend and temporarily increase the distribution of GDP per person.
Methods of research. In the mid 1960s English economist J. Williamson stated that the national development creates increasing regional differences at the early stages, while at the later stages of economic development that creates convergence regional levels, i.e. regional convergence, which leads to an inverted U-shaped curve [12, pp. 1-84]. At the early stages the region has multiple poles of growth that concentrate capital and skilled workers. The more rapid productivity growth accelerates economic growth in these poles and results in the increase in regional disparities (divergence). At the later development stages the costs are raising in the growth pole, that is why the funds can be transferred to other regions with lower labor costs. This, together with the uniform knowledge distribution outcomes, can increase the productive factors reallocation in the sectors and regions, which leads to the convergence of their regional development. The model “β-convergence”, based on the neoclassical growth theory developed by R. Solow, is a starting point for the analysis of alignment [13, pp. 312-320].
According to this theory, the economic growth rates are positively correlated with the GDP gap per capita of this region and GRP per capita of the region characterized by constant growth rates. Therefore, weaker regions should grow faster than stronger ones, and in the long term the regional levels of economic development will align [14]. Thus, the β -convergence theory shows that relatively weak regions in the initial period of development are usually characterized by higher growth rates.
The assessment of β-convergence requires models of “regression of growth to its initial level” (“growth-initial level regressions”), with the growth rate being a dependent variable and the initial index – independent. The simple regression of this type is the following: y. = a+ в ln(x1lT)+e, where xtlTis an indicator at the moment preceding the current time t by T periods (as usual, the initial period of integration or the other moment significant for the integration grouping development), β is an estimated coefficient, yi is an average growth rate in the i-th country for T periods, calculated as ln(yit)/ln(yit-T) , e is a random deviation [15, pp. 58-73]. The convergence indicator is a sign of the β-coefficient. If β < 0 is less than 0, the high level of the indicator in the initial moment of time correlates with the lower growth rates.
Unlike β -convergence, σ-convergence reveals a decrease in the number of indicators characterizing smoothing divergence between regions over time. Not always β -convergence implies σ-convergence. When the group of stronger and weaker regions is constantly changing (due to the worsening economic situation in stronger regions and the improving situation in weaker ones), but the overall gap between stronger and weaker regions is constant, then σ-convergence is missing [16; 17, pp. 1325-1352; 18, pp. 1019-1036].
To identify σ-convergence in the presence of the trend in the time series it is possible to use such indicator as dispersion or relative indicators of variation: a range coefficient ( K R ) and a variation coefficient ( V a ) . The increased range and variation coefficients directly testify the intensification of the factor variations in the studied population. Thus, analyzing these factors dynamics in terms of the key parameters, we can give a qualitative and quantitative characterization of the growing differences by GRP per capita in the EU regions.
The Theil index is another indicator to i n dentify σ - convergence [ 1 9] : T = ^ y, ln( y t / p t ) , , where y is a share of the coun = ry’s GDP in the GDP of the entire EU, p is a share of the population in the EU population as a whole. The index value amounts to zero in the case of full equality and increasing with the inequality growth. Thus, the decrease in the value of this index over time indicates convergence, the increase in the index – divergence, i.e., the differences growth.
Discussion on the processes of convergence in the EU. The EU territory is divided in the “periphery” and “core” on the basis of the study of 12 countries (EU–15, except for Austria, France and the UK), carried out by S. Dall’erba, J. Le Gallo in 1989–1999. The core includes the EU most developed countries. The significant convergence among the periphery countries is established, but they do not receive the same development effort, as the core. According to these scientists, the investment projects of the EU structural funds undoubtedly yield benefit to those regions that get it, but mostly the main regions (the core) profit due to the EU structural funds. The possible reason for this is that the core regions are less in size, and better connected to each other through the transport network and trade. The researchers consider two groups of countries: four countries – Greece, Portugal, Spain and Ireland – as less developed and three – Germany, the UK and Italy – as more developed. There are multiple poles of growth, while other regions are lagging behind. It results in increasing inequality [20].
The Italian scientists C. Brazili and L. Gutierrez have investigated 15 EU countries, representing 140 regions of NUTS level 2 in 1980–1999 and found out significant convergence. According to the distribution analysis, the level of income per capita in poorer countries tends to converge, i.e., the convergence process is more intense among the regions of the low-income population [21]. The income analysis (LIS) for the Czech Republic (1992, 1996), Hungary (1991, 1994), Poland (1992, 1995, 1999) and Russia (1992, 1996) shows that the regional income inequality within countries of the CEE region increases, especially in the capitals and main urban areas. Probably, the inter-regional differences within EU countries will even aggravate in the future, especially between the major urban agglomerations and the economic periphery with the “old” economic specialization. Even good economic dynamics of some major peripheral regions will be ensured mainly due to the local growth points [22].
The study of the EU-25 and their 1214 regions of NUTS level 3 in the 1995–2002 period indicates that the regions with lower GDP per capita developed faster in 1995– 2002. The convergence speed was higher for regions of NUTS level 3 in the EU-15 than for regions of NUTS level 3 in the new EU countries. Convergence was observed within the regions of the EU-15, and was not in the new EU [23]. These findings reveal a more serious problem: when aligning regional differences at the level of large regions the disparities in smaller regions tend to remain outside the mechanisms of territorial development regulation. Even wealthy countries can have poor regions. The EU regions of NUTS level 3 can be objects of regional policy aimed at boosting competitiveness and employment if they meet a number of indicators. The EU regional programs do not cover local administrative units.
Based on the analysis of 19 out of 27 EU member states in 1995–2004 (both at the national level and within each country at the NUTS level 2) B. Sz о rfi states that the date of entry into the EU influences the degree of regional differences. The new member states have a higher level of regional variation [24, pp. 100-121]. The study of 10 new EU countries over the 1995–2005 period identifying economic systems convergence by GDP (on the basis of quarterly data on real GDP per capita in this period) reveals the trend to align these countries to the EU average level of GDP [25, pp. 157-166]. In the last 15 years scientists pay more attention to the study of differences in the development of EU regions using different econometric methods. Most studies of convergence are focused on the analysis of β -convergence and σ-convergence (spatial convergence).
The comparative analysis shows that the research results depend on methods, a period and studied regions. However, despite the fact that the authors of the considered studies use different methods to assess convergence the obtained results are comparable and allow us to draw the following preliminary conclusions. For a quarter of a century there has been convergence of the development between relatively rich and poor countries of the EU. This convergence occurred when the countries of Southern Europe and Ireland (1980–1999) and the countries of Central and Eastern Europe (1995–2005) were the poorest EU countries. The convergence process at the level of individual regions (NUTS 2 and NUTS 3) was complex.
If the Scandinavian countries and Italy were, in general, characterized by convergence and the differences in the economic development level between different regions was reducing, in other EU countries the process was controversial and the convergence periods were followed by divergence periods. The last EU countries of Central and Eastern Europe have a higher level of regional differences in comparison with “old” EU countries. At the same time, inequality between large and small regions in many “new” EU countries is growing due to more rapid development of metropolitan areas and large cities compared to other, especially small regions. Let us consider this in more detail.
Assessment of regions’ convergence processes at NUTS level 1. We used Eurostat 1995–2011 data for the empirical analysis. In 2009 in the EU countries GDP per capita based on purchasing power parity for the regions of NUTS level 1 ranged from 44% of the average EU-27 (10300 US dollars by PPP per capita) in Bulgaria up to 266% (62500 US dollars by PPP per capita) in Luxembourg. The disparities of the EU regions of NUTS level 2 are even sharper: GDP per capita by PPP in 2009 ranged from 27% (6400 US dollars by PPP) in the Northwestern region of Bulgaria to 332% (78000 US dollars by PPP) in the metropolitan area (Greater London) of Great Britain. Among “new” countries, the leader is Prague (the Czech Republic) – 175% (41200 US dollars by PPP) and the region of Bratislava (Slovakia) – 178% (41800 US dollars by PPP) of the average for the EU-27. However, these two regions should be considered as an exception among the new states that joined in 2004. The most prosperous regions in the new countries follow then: Bucharest in Romania – 111% of the average level for the EU-27 (26100 US dollars by PPP), Central Hungary (Hungary) – 109% (25500 US dollars by PPP), Western Slovenia (Slovenia) – 105% (24600 US dollars by PPP), Cyprus – 100% (23500 US dollars by PPP) of the average for the EU-27. Except for Masovian Voivodeship in Poland – 97%, Malta – 82%; in all other regions of the new member states GDP per capita by PPP amounted to 75% or less of the EU-27 average level.
The increase in GDP per capita in poor areas is a primary objective of the EU regional policy – convergence. To get assistance the country’s development should be below 75% of GDP at PPP from the average in the EU. Accession of Central and Eastern European countries (CEE) to the EC has immediately reduced the EU average value; therefore, less developed regions of the “old” countries (East Germany and middle-income regions of Greece) can not get this assistance. The increase in GDP per capita according to NUTS 1 indicator in the poorest EU regions leads to the reduction of disparities in GDP [26]. G. Petrakos, A. Rodr i guez-Pose and A. Rovolis, having analyzed this process in France, Great Britain, Italy, Portugal, Spain, Belgium, Greece and the Netherlands in 1981–1997, state that the long-term development processes tend to align in the resources allocation. Although the more rapid GDP growth leads to a greater increase in regional inequality. The regional differences at the national level in the European Union are cyclical: they rise in the periods of rapid GDP growth and reduce in the periods of slow [27, pp. 1837-1855].
The analysis of the GDP per capita indicator shows that the differentiation level of the NUTS level 1 regions that are EU member states had declined steadily throughout the period. The slow reduction of differentiation, characteristic of 1995– 1999, was followed by rapid convergence in 2000–2009 The accession of 10 new countries to the European Union in 2004 and two countries (Bulgaria and Romania) in 2007, most likely had a positive impact on the convergence process, but the impact was relatively small and the convergence rates were approximately the same in the first decade of the 21st century. However, the 2008–2009 economic crisis still exerted some influence on the convergence processes within the EU. The rate declined slightly in 2010, there was slight divergence, but then again the convergence processes began and in 2011 the Theil index almost returned to the 2009 level (tab. 1) .
This rapid convergence process in 1995–2009 was caused primarily by the reduced differentiation between “old” (EU-15) and “new” countries due to higher rates of GDP growth in “new” countries and lower rates of population growth there. The GDP growth and the convergence process were the following in the EU. The GDP growth rates in the poorer new EU countries significantly had exceeded the economic growth rates in the EU-15 up to 2008. In some “new” countries (for example, in Latvia in 2005–2007) the GDP growth rate reached 10% per year, while in most EU-15 countries this indicator amounted only to 2–3% (tab. 2) .
Such high differentiation in the economic growth rates, of course, resulted in the reduced differentiation between “rich” and “poor” countries of the EU.
Table 1. Dynamics of the Theil index in the European Union countries (EU-27) in 1995–2011
|
1995 |
1996 |
1997 |
1998 |
1999 |
2000 |
2001 |
2002 |
2003 |
2004 |
2005 |
2006 |
2007 |
2008 |
2009 |
2010 |
2011 |
|
|
Theil index |
6.44 |
6.21 |
6.18 |
6.16 |
6.12 |
6.05 |
5.68 |
5.31 |
4.97 |
4.64 |
4.41 |
4.09 |
3.65 |
3.21 |
2.96 |
3.00 |
2.95 |
|
Source: the estimates are based on the 1995–2011 Eurostat (the data on Slovenia, the Czech Republic, Slovakia, Hungary, Poland, Lithuania, Latvia, Estonia, Bulgaria, Romania, Cyprus and Malta were taken into account during the entire period, regardless of whether these countries were the EU members or not during that period). |
|||||||||||||||||
Table 2. Real GDP growth rates in the EU (1996–2011),%
|
Country |
1996 |
2000 |
2004 |
2008 |
2009 |
2010 |
2011 |
|
EU-27 |
1.8 |
3.9 |
2.5 |
0.3 |
-4.3 |
2.1 |
1.6 |
|
EU-15 |
1.5 |
3.8 |
2.2 |
0.4 |
-4.4 |
2.0 |
1.4 |
|
Bulgaria |
-9.0 |
5.7 |
6.7 |
6.2 |
-5.5 |
0.4 |
1.8 |
|
Czech Republic |
4.5 |
4.2 |
4.7 |
3.1 |
-4.5 |
2.5 |
1.9 |
|
Estonia |
5.9 |
9.7 |
6.3 |
-4.2 |
-14.1 |
3.3 |
8.3 |
|
Cyprus |
1.8 |
5.0 |
4.2 |
3.6 |
-1.9 |
1.3 |
0.5 |
|
Latvia |
4.3 |
5.7 |
8.9 |
-3.3 |
-17.7 |
-0.9 |
5.5 |
|
Lithuania |
5.2 |
3.6 |
7.4 |
2.9 |
-14.8 |
1.5 |
5.9 |
|
Hungary |
0.2 |
4.2 |
4.8 |
0.9 |
-6.8 |
1.3 |
1.6 |
|
Malta |
-0.3 |
3.9 |
-2.6 |
2.9 |
1.7 |
||
|
Poland |
6.2 |
4.3 |
5.3 |
5.1 |
1.6 |
3.9 |
4.5 |
|
Romania |
3.2 |
2.4 |
8.5 |
7.3 |
-6.6 |
-1.1 |
2.2 |
|
Slovenia |
3.6 |
4.3 |
4.4 |
3.4 |
-7.8 |
1.2 |
0.6 |
|
Slovakia |
6.9 |
1.4 |
5.1 |
5.8 |
-4.9 |
4.4 |
3.2 |
|
Source: the 1996-2011 Eurostat data. |
|||||||
Let us consider the hypothesis of the EU regions σ-convergence at NUTS level 1 according to GDP per capita based on purchasing power parity. The existence of σ-convergence is believed to a precondition for the existence of β -alignment [28, pp. 1325–1352; 29, pp. 1019-1036; 30]. The calculation of range and variation coefficients reveal that in 1995–2009 “polarization” of the EU regions at NUTS level 1 according to GDP per capita decreased. It is testified by the reduction of the variation coefficient by 9%. In this period the growth of standard deviation ( о ) was not ahead of the growth of average GDP per capita.
Therefore, the differences in GDP decreased and the differences in GDP per capita in PPP terms were aligning, which proves σ-convergence of EU regions according to GDP per capita. The confirmation of the β- convergence hypothesis according to GDP per capita at purchaser’s prices should follow the considered spatial convergence (σ-alignment follows β -convergence) [31, pp. 50-51]. When constructing regression of GDP growth in 1995–2004 to its original level in 1995 the growth rate is considered as a dependent variable and the initial index level as independent (y = a + β x, where y = ln (GDP 2004/ GDP 1995), x = ln (GDP 1995)).
The coefficient of initial GDP per capita in PPP terms is negative ( β = -0.0000017<0, Beta = 0.588<0) and statistically significant (p=0.001). Therefore, the assumption of β -convergence in the period 1995–2004 GDP at PPP is correct.
While constructing regression of GDP growth in 2004–2009 to its original level in 2004 (y = a + β x, where y = ln (GDP 2009/ GDP 2004), x = ln (GDP 2004)), we get a negative ( β = -0.00000078<0, Beta= -0.627<0) and statistically significant (p=0.000) coefficient. Therefore, the assumption of β -convergence in 1995–2004 according to PPP GDP is also true. So, in the 1995–2009period there were both σ- and β -convergence of the EU regions at NUTS level 1. Thus, the EU regions with weaker values of economic development increase it faster than stronger ones.
In 2010–2011 in the EU regions of NUTS level 1 there were both σ-and β -convergence. Spatial convergence was recorded in the 2010–2011 period, the variation coefficient decreased by more than 4% (tab. 3) 1 .
Table 3. Dynamics of variation and range coefficients according to GDP per capita based on purchasing power parity by NUTS 1 regions in 2010–2011
|
Variation indicators |
2010 |
2011 |
|
Range coefficient, ( kr ) |
2.26 |
2.17 |
|
2010 = 100% |
100% |
95.96% |
|
Variation coefficient, ( y ) |
0.44 |
0.42 |
|
2010 = 100% |
100% |
96.49% |
|
Source: calculations in SPSS. |
||
1 The author expresses appreciation to O.Ya. Lavrinenko, Doctor of Economics, Senior Research Associate at the Institute for Social Research of the Daugavpils University for processing data and conducting calculations in SPSS (see tab. 3).
The EU regions with weaker values of economic development continue to increase is faster than stronger regions: β -convergence ( β = -0.004<0, Beta = -0.491<0, p=0.009).
According to the author, it is important to take into consideration the issue on the role of the EU structural funds (Social Fund, Regional Development Fund and others) in the process of convergence. The scientists agree that the level of income in poorer regions should be raised, where its level is less than 75% of the EU average.
In terms of the endogenous theory public policy plays an important role in determining long-term growth: public infrastructure is a factor of the production function, and its growth increases the marginal product of private capital, which leads to a rise in capital accumulation and growth. In the framework of the neoclassical theory, such policy is also aimed at accelerating the convergence process, since the marginal product of private capital increases when public capital is provided. To consider the role of EU funds the right part of the regression equation should include an additional factor – a share of the EU structural funds’ investments and the states’ co-financing in GDP (tab. 4) .
The coefficient at initial GDP per capita is negative and statistically significant (-0.027). At the same time, the coefficient at the variable characterizing the impact of public investment is though positive, but statistically insignificant. The results can be interpreted as evidence that the EU experienced the convergence processes in 2000–2010; however, the impact of the financial support of the European structural funds on the integration processes cannot be evaluated unambiguously. Public investment
Table 4. Evaluation of β -convergence of regions of the EU member states with the inclusion of the public investment share in GDP, 2000–2010, [32, pp. 289-290]
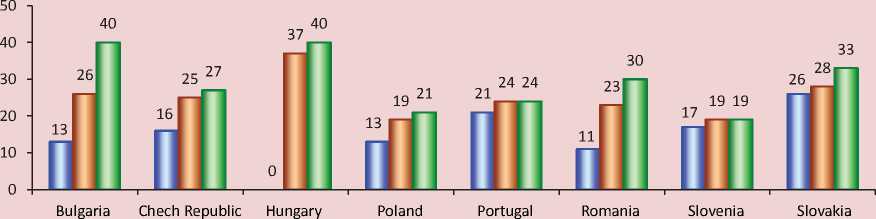
Assessment of the convergence processes of the EU regions at NUTS level 2 and NUTS level 3. Let us consider the problem of regions’ development imbalance in the “old” and “new” EU member states at NUTS level 3 compared with the NUTS 2 level (fig.) .
Disparities in development of the EU regions at NUTS level 3 by PPP GDP per capita in 2009 are very sharp and range from 22% in the regions of Silistra and Sliven (Bulgaria) and Vaslui (Romania) (664 US dollars by PPP and 1087 US dollars by PPP, respectively) to 596% in the city of London City-West in the UK (156661 US dollars by PPP). In the “new” EU countries the significant gap in the development of the NUTS level 3 region is not associated with politics but with the hypertrophic development of capitals, especially in small countries.
The differences within the regions of the “new” EU countries at NUTS level 3 are even sharper. For example, in Bulgaria GDP per capita in the capital exceeded
Silistra and Sliven almost fivefold (105 to 22%). In 2009 in small Latvia this indicator in Riga exceeded Latgale, a peripheral region, threefold: 86% to 28% of the EU average, in Hungary the gap between Budapest and Novgrad was almost 5 times (147 to 30%).
In some states, such as Romania and Poland, the differentiation is also significant. In Ilfov County, which surrounds Bucharest, GDP per capita amounted to 115% of the EU-27 average, while in Vaslui, which is located on the border with Moldova, – only 22% (by 5.2 times); in Poznan the same indicator reached 121% to 35% in Bia l a Podlaska County, a unit on the border with Belarus (by four times). It is important to consider significant historical and economic differences when channeling funds from the EU structural funds for regional alignment, solving a tough dilemma of market “efficiency – equity”.
For example, in Latvia it would be fairer to allocate EU structural funds resources to Latgale, but the return would be only 100 lats per unit of input. So, it would be better to invest in the Riga Central region, where the return would be 200–300 lats per unit of input, i.e. by 2–3 times higher [33, pp. 4753]. In the market environment the priority is to develop efficiency, but not justice.
Dispersion in the “new” EU countries at NUTS level 2 (top) and NUTS level 3 (bottom) in 1995–2009, in %
□ 1995 □ 2004 □ 2009
42 44
32 32 34
28 29 28 29 28 29
17 19 21 23
❖°'
❖°'
□ 1995 □ 2004 □ 2009
Source: Eurostat data for 1995–2009.
The differentiation of large regions (NUTS level 1 and 2) in the “new” EU countries is not so significant: according to GDP per capita most developed Masovian Voivodeship in Poland surpassed Lublin Voivodeship only by 2.4 times (97 to 41%), and the Metropolitan area in Romania was by 3.8 times ahead of the Northwestern region of the country (111 to 29%). In Bulgaria the gap between the Southwestern and Northwestern regions was 2.7 times (75
to 27%). There was a greater gap in some Western European countries, such as the UK and France.
Let us make some conclusions. The study has revealed the presence of the β-and σ-convergence processes in the EU regions according to GDP per capita on the basis of purchasing power parity at NUTS level 1. During the past 15 years the convergence process in the EU has been fast enough, especially at the level of certain countries, due to both the higher GDP growth in the “new” EU countries and the lower population growth rates there. In the “new” EU countries the gap in the development of individual regions at NUTS levels 2 and 3 is associated with hypertrophied development of the capitals, especially in small states. The accession of new countries to EU significantly promoted β- and σ-convergence there. Therefore, the identified reduction of differences according to GDP per capita in terms of PPP meets the interests of both “new” and “old” EU countries and indicates the fairly positive EU policy towards the development of the regions of NUTS level 1.
The convergence processes in the EU regions at NUTS levels 1, 2 and 3 are of complex character and suggest that the goals to achieve regional convergence, parity (“equality”) and maximize total product output (“efficiency”) are not always compatible in the market environment.
Under these conditions the negative impact of the reduced growth rate in the regions of the EU “core” will exceed the positive effect of the growth rate in the “periphery”. Therefore, the GDP growth of the EU regions at NUTS levels 1 and 2 can be also ensured by the cost of deepening regional disparities (divergence) at NUTS level 3.
The analysis has showed that the larger the EU regions (NUTS levels 1 and 2) are, the shorter the period of time to align their differences is. On the contrary, the smaller the EU regions (NUTS level 3) are, the longer the period of time to align their differences is. Therefore, when selecting alignment objects we should focus on the regions of NUTS level 3 and the integration of regions. The last remark is very important for many regions of the European part of such a country as Russia, which requires necessary multidisciplinary production and economy’s clustering to align the level of development.
References Convergence regions in European Union: features and the evaluation
- Regulation (EC) No 1059/2003 of the European Parliament and of the Council of 26 May 2003, on the establishment of a common classification of territorial units for statistics (NUTS). Available at: http://ec.europa.eu/eurostat/ramon/nomenclatures/index.cfm?/
- Bell D. The Coming of Post-Industrial Society: A Venture in Social Forecasting. New York: Basic Books, 1973.
- Galbraith J. The New Industrial State. Harmondsworth, Middlesex: Penguin Books, 1969.
- Zverev D.V., Kolomak E.A. Subfederal'naya fiskal'naya politika v Rossii: mezhregional'nye razlichiya i svyazi. Seriya “Nauchnye doklady: nezavisimyi ekonomicheskii analiz”, № 209 . Moscow: Moskovskii obshchestvennyi nauchnyi fond; Sibirskii tsentr prikladnykh ekonomicheskikh issledovanii, 2010.
- Solow R.M. Growth Theory: an Exposition. New York Oxford. Oxford University Press, 2000.
- Barro R., Sala-i-Martin X. Economic Growth. 2nd ed. Cambridge, MA, London: MIT Press, 2004.
- Le Pen Y. Convergence Internationale des Revenus par Tête: Un tour d'horizon. Revue d'Économie Politique, 1997, vol. 107.
- Barro R., Sala-i-Martin X. Economic Growth. Chicago: The MIT Press, 1995.
- Barro R. Determinants of Economic Growth (The Lionel Robbins Lectures). Cambridge: The MIT Press Second Printing, 1997.
- Barro R., Sala-i-Martin X. Economic Growth. 2nd ed. Cambridge, MA, London: MIT Press, 2004.
- Henin P., Le Pen Y. Les Épisodes de la Convergence Européene. Revue Économique, 1995, Vol.46(3), pp. 667-677.
- Williamson J.G. Regional Inequality and the Process of National Development: a Description of the Patters. Economic and Cultural Change, 1965, no.13, pp. 1-84.
- Solow R.M. Technical Change and the Aggregate Production Function. The Review of Economics and Statistics, 1957, vol.39, no.3, August, pp. 312-320.
- Gadzhiev Yu.A. Neoklassicheskie i kumulyativnye teorii regional'nogo ekonomicheskogo rosta i razvitiya . Korporativnoe upravlenie i innovatsionnoe razvitie Severa: Vestnik Nauchno-issledovatel'skogo tsentra korporativnogo prava, upravleniya i venchurnogo investirovaniya Syktyvkarskogo gosudarstvennogo universiteta. Elektronnyi zhurnal . Available at: http://koet.syktsu.ru/vestnik/2008/2008-1/1/1.htm/
- Libman A. Rol' ekonomicheskoi integratsii i dezintegratsii na postsovetskom prostranstve: kolichestvennyi analiz . Problemy prognozirovaniya , 2006, no.5, pp. 58-73.
- Barro R., Sala-i-Martin X. Economic Growth. Chicago: The MIT Press, 1995.
- Sala-i-Martin X. Regional Cohesion: Evidence and Theories of Regional Growth and Convergence. European Economic Review, 1996, vol. 40, no.6, June, pp. 1325-1352.
- Sala-i-Martin X. The Classical Approach to Convergence Analysis. The Economic Journal, 1996, Vol.106, no.437, July, pp. 1019-1036.
- Theil H. Economics and Information Theory. North-Holland, 1967.
- Dall'erba S., Le Gallo J. Regional Convergence and the Impact of the European Structural Funds Over 1989-1999: A Spatial Econometric Analysis. REAL Discussion Papers, 2003.
- Brasili C., Gutierrez L. Regional Convergence Across European Union, 2004. Econ WPA, Development and Comp. Systems 0402002.
- Förster M., Jesuit D., Smeeding T. Regional Poverty and Income Inequality in Central and Eastern Europe: Evidence from the Luxembourg Income Study. Spatial Inequality and Development. Oxford University Press, 2005.
- Paas T., Kuusk A., Schlitte F. Modelling Regional Income Convergence in EU-25. University of Tartu, 2004. Available at: http://www.ecomod.org/files/papers/1388.pdf/
- Szörfi B. Development and Regional Disparities -Testing the Williamson Curve Hypothesis in the European Union. Focus on European Economic Integration 2007. P. 100-121. Available at: http://www.oenb.at/de/img/feei_2007_2_szoerfi_tcm14-79074.pdf/
- Ranjpour R., Karimi T.Z. Evaluation of the Income Convergence Hypothesis in Ten New Members of the European Union. A Panel Unit Root Approach. Panoeconomicus, 2008, no.2, pp. 157-166.
- Regional'naya politika stran ES . Tsentr evropeiskikh issledovanii IMEMO RAN . Executive Editor A.V. Kuznetsov, Doctor of Economics. Moscow: IMEMO RAN, 2009.
- Petrakos G, Rodríguez-Pose A., Rovolis A. Growth, integration, and regional disparities in the European Union. Environment and Planning A, 2005, no.37(10), pp. 1837-1855.
- Sala-i-Martin X. Regional Cohesion: Evidence and Theories of Regional Growth and Convergence. European Economic Review, 1996, vol.40, no.6, June, pp. 1325-1352.
- Sala-i-Martin X. The Classical Approach to Convergence Analysis. The Economic Journal, 1996, vol.106, no.437, July, pp. 1019-1036.
- Arbia G., Piras G. Convergence in Per-capita GDP Across European Regions Using Panel Data Models Extended to Spatial Autocorrelation Effects, 2005. Available at: http://www.isae.it/Working_Papers/WP_Arbia_Piras_ n51_2005.pdf/
- Barro R., Sala-i-Martin X. Economic Growth. 2nd ed. Cambridge, MA, London: MIT Press, 2004.
- Khotulev A. Vliyanie regional'nogo investirovaniya na protsessy sotsial'no-ekonomicheskoi integratsii v ramkakh ES. Starptautiskās zinātniskās konferences „Eiropas integrācijas sociālā un ekonomiskā dimensija: problēmas, risinājumi, perspektīvas” materiali. 2011. gada 3.-5. novembris). III dala. Ekonomiskais aspekts. Daugavpils: Daugavpils Universitātes Akadēmiskais apgāds «Saule», 2012.
- Voronov V.V., Lavrinenko O.Ya. Dokhody naseleniya Latvii: uroven', differentsiatsiya, dinamika . Sotsiologicheskie issledovaniya , 2011, no.3, pp. 47-53.
