Correlation analysis between DJIA and Google, apple shares' quotations
Автор: Bagdasaryan A.
Журнал: Экономика и социум @ekonomika-socium
Статья в выпуске: 4-1 (13), 2014 года.
Бесплатный доступ
This work is dedicated to the investigation of financial market indicators in the USA namely Dow-Jones Industrial average and share prices of two giant companies Google and Apple companies. As they are not included in the list of companies of DJIA, the aim of the work is to determine how these indexes correlate in other words the question is whether it is appropriate to say that DJIA showing the general situation in the market of stock exchange in the USA can be determined with two companies, leaders of the industries. The work considers empirical investigation in term of construction of econometric model and analysis of data within this model.
Correlation analysis, regression analysis, econometric model, initial form of model, estimated form, interpreting the coefficients, the us stock market, share price, google, apple
Короткий адрес: https://sciup.org/140124517
IDR: 140124517
Текст научной статьи Correlation analysis between DJIA and Google, apple shares' quotations
The problem raised is if these companies should be covered with the average which is actually supposed to reflect the conditions of the most stable and reliable companies?
That is why the aim of this work is to determine whether Apple and Google companies’ shares quotation correlates with the value of DJIA, in other words, whether Apple and Google quotes can determine the value of average in the US stock exchange.
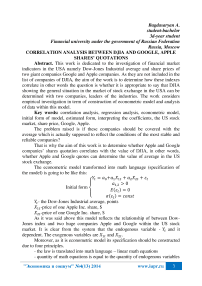
The econometric model transformed into math language (specification of the model) is going to be like this:
Initial form
Yt = ^ O +^ l- ^ lt + a2 ^ 2t + £t a 1,2 > 0 Ж) = 0 ^(ct) = const
Yt- the Dow-Jones Industrial average, points
X1t-price of one Apple Inc. share, $
X2t-price of one Google Inc. share, $
As it was said above this model reflects the relationship of between Dow-Jones index and two huge companies Apple and Google within the US stock market. It is clear from the system that the endogenous variable - Yt and it dependent. The exogenous variables are X1t and X2t.
Moreover, as it is econometric model its specification should be constructed due to four principles.
-
- the law is translated into math language – linear math equations
-
- quantity of math equations is equal to the quantity of endogenous variables
-
- all variables are dated and denoted as index t
-
- each equation of the model includes disturbance terms (disturbance terms include in the model variety of other factors on which endogenous variable depends)
The next step is two collect the data. To get stock market data of US stock market and not necessarily the US I visited website which is:
Having joined this website, you may just download the necessary data and export it into Excel File. While working over It, I chose the daily values of these three indicators for the September. The entire data is represented in Excel File attached to this one.
Now using the data collected it is possible to conduct an investigation dedicated to figuring out the degree of dependence of these indicators with the help of the Microsoft Excel tools and functions.
Having constructed the correlation matrix (Excel special function) and Scatter diagrams, the results were obtained (see table 1) and they let us conclude that there is weak positive linear relationship between Dow-jones industrial average index and Apple shares quotations because correlation coefficient is near to 0 and is equal to 0,33. On the other hand, according to correlation matrix there is the strong positive relationship between Dow-jones industrial average index and Google shares quotations. The correlation coefficient tends to 1 and equals to 0,86.
Pair correlation matrix Table 1
|
Matrix of pair correlation |
||
|
DJIA, points Apple Inc. $ per shore |
Google Inc. $ per share |
|
|
DJIA, points |
1 |
|
|
ApoIe Inc. $ per share |
0,33 1 |
|
|
Google Inc. $ per share |
0,86 0,09 |
1 |
Below, you can see the estimated form obtained during regression analysis.
( Yt = 8670,58 + 14,34X1t + 11,85X 2 t + £t
(1148,42) (6,23) (1,67) (44,01)
< tstat [7,63] [2,30] [7,11]
R2 = 0,758
V F = 28,12
Interpreting the coefficients of model
Coefficients of regression show how the dependent variable (regressand) of the model will change if the independent variables (regressors) change within the certain model.
Coefficient a1 before X1 (apple shares quotes) means that if Apple Shares quotes for example increase by 1 $ Dow-Jones industrial average (Y) will increase by 14,34 points. This coefficient shows the certain dependence of Y from X1 in point of view math. So does the coefficient a2 but concerning Google shares quotes (X2) and Dow-Jones industrial average. If X2 increases by 1$ Y will increase by 11,85 points.
Coefficient a0 is the value of Dow-jones industrial average (Y) in case if a1 and a2 are both equal to 0.
Conclusion . The investigation shows that there is a correlation between Dow-Jones Industrial Average and Google and Apple share quotations though as far as matrix of pair correlation is concerned Apple company weakly correlates with DJIA. And it should not come as surprise because concerning the period the data reflects the DJIA reflecting the general situation in the US stock market may show growth and Google company is one the companies that showed positive dynamic whereas Apple company performed growth slower than the whole stock exchange.
^ t — a0+a1 X 1t + a2 % 2t + £t a1,2 > 0 E(s t ) — 0 ^(et) — const
"Экономика и социум" №4(13) 2014


