Correlation Power Analysis using Measured and Simulated Power Traces based on Hamming Distance Power Model – Attacking 16-bit Integer Multiplier in FPGA

Author: Marek Repka, Michal Varchola
Journal: International Journal of Computer Network and Information Security(IJCNIS) @ijcnis
Article in issue: 6 vol.7, 2015.
Free access
In many cases side channel attacks complexity are estimated by considering attack simulations only. Regarding this estimations, parameters of cryptographic devices are set so the attack is infeasible. This work shows that this approach to secure cryptographic equipment can be dangerous because real attacks can be much better than expected according to simulations. This observation is presented on very generic Correlation Power Attack using Hamming Distance Power Model. This attack is aimed against integer multiplier implemented in FPGA. In cryptography, an integer multiplier power consumption can sometimes be exploited to reveal a secret. Very often it is in asymmetric cryptography that is used in PKI as a fundamental building block. As an example, there are DSA and its various derivations.
Side Channel Attack, Side Channel Attack Simulations, Correlation Power Analysis, Hamming Distance Power Model, Digital Signature Algorithm, Elliptic Curve Digital Signature Algorithm
Short address: https://sciup.org/15011417
IDR: 15011417
Text of the scientific article Correlation Power Analysis using Measured and Simulated Power Traces based on Hamming Distance Power Model – Attacking 16-bit Integer Multiplier in FPGA
Published Online May 2015 in MECS
Many techniques exploit dependency of the power consumption or electromagnetic emanation on data processing operations performed within a cryptographic hardware. For example, attacks like Differential Power Analysis (DPA) [1], Correlation Power Analysis (CPA) [2], Differential Electromagnetic Emanation Analysis (DEMA) [3], or Correlation Electromagnetic Emanation Analysis (CEMA) [4] are common, and not so difficult to perform, side channel attacks (SCA). All these attacks require an appropriate description of the data-dependent power consumption or electromagnetic emanation using information leakage models, such as the Hamming Weight (HW) or Hamming Distance (HD) power model.
Construction of the HW power model (HWPM) is less complex than the construction of the HD power model (HDPM) but also less efficient. Power models are usually made considering the architecture of the cryptographic algorithm, or rather Register Transfer Level (RTL) description of the algorithm that is implemented in the attacked device.
Side-channel-leakage arises during processing sensitive intermediate values by data-dependent operations causing data-dependent power consumption or another physical behavior. We can further distinguish between data and operation dependences. Examples of these operations are data registering, multiplexing and addressing, but also data transferring, and any combinational logic operations on data (e.g. AND, OR, XOR). Note that any high level functions can be decomposed to these basic operations. The side-channelleakage depends on the technical realization of these basic elements. For example, registers created in programmable logic blocks in FPGA cause higher sidechannel-leakage than registers in embedded memories because the programmable logic blocks are more complex due to their programmability features.
The Correlation or Differential family of attacks is very generic method to attacks implementation when only limited information is known about the implementation. They are dangerous and can reveal the secret in many cases, but there are more power full attacks called Template or Profiling attacks [5]. Such attacks uses more sophisticated description of the sensitive leakage [6]. Very often those are stochastics methods [7], multivariate Gaussian distribution [8], multivariate regression, and conditional entropy (Mutual Information Analysis – MIA [9]). These attacks, however, need to have access to the same device such as the one to attack before the attacks is performed, in other to make the statistical profile of the leakage (templates). There are also some works using evolution and genetic algorithms [10].
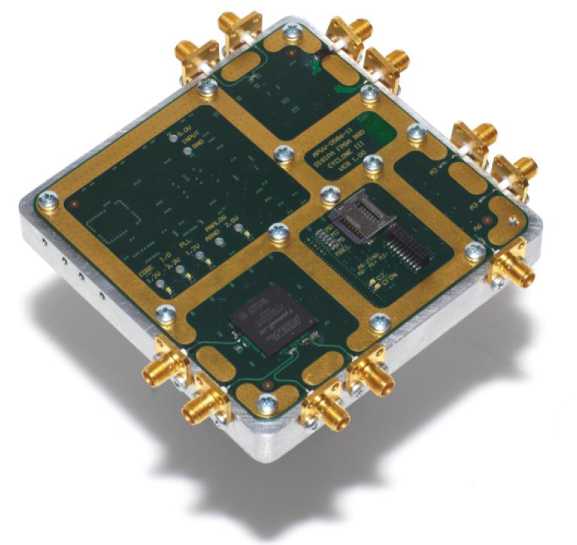
Fig. 1. Digital Signature Power Analysis Attacks (DISIPA) FPGA board implementing various measurement points.
-
II. Realted Work
III. Preliminaries
To our best knowledge the only work dealings with CPA against integer multiplication is the work [11]. In that work, attack against ECDSA implementation in RFID is performed. The ECDSA implementation is based on 256 Elliptic Curves, and the sensitive multiplication is performed using a 16-bit integer multiplier. The secret constant operand (denoted as key or k in our work) has thus N = 16 16-bit blocks. Hence, the attack is aimed against Step 5 in the Algorithm 1 (Signature-generation scheme using ECDSA) listed in their work. The attacks is especially aimed against the integer multiplication dr , where r is known to an adversary (it is public) and d is private key. However, in their work only one chosen private key is revealed.
-
A. Our contribution
In many works dealing with SCA, often one key is chosen and revealed, such as in the work [11] attacking ECDSA in RFID.
In this work, we randomly and uniformly generated 665 16-bit keys and tried to reveal them. We used measured as well as simulated power traces using Hamming Distance Power Model. Based on this results we estimated success rate and complexity attack represented by remaining key hypotheses after the CPA attack in both cases (measured and simulated power traces). Based on the success rates we estimated complexity and success of CPA attack revealing 1 ≤ N ≤ 21 16-bit key.
This section briefly discuss the most common power models, namely Hamming Weight and Hamming Distance Power Models, which are used in CPA attacks. Also the CPA attack is recalled. A comparison of HWPM, HDPW, and Switching Distance power models, using CPA can be found in.
-
A. Hamming Weight Power Model
The HW Power Model is very simple. It neglects many factors, which have influence on the power consumption like parasitic capacities, glitches, and transitional events. When HWPM is used, the power consumption is assumed to be proportional to the number of bits set to logic '1' of the processed sensitive variable. However, the HWPM is not sufficiently accurate, because, in reality, the power consumption depends rather on the occurrence of bit transitions. Therefore, the adversary will probably use the HWPM only if one of the two consecutive states of the sensitive variable is not known. However, if he is able to obtain two consecutive states of the variable containing sensitive information, he will probably not hesitate to use the HDPM.
x = [ x„ x 2 , ^ , X n ] 2 , (1)
n
HW ( x ) = ^ xz . (2)
i = 1
The HW of the sensitive intermediate value is the number of bits that are set to '1'. However, some possibilities how to make the HWPM more efficient exist. For instance, the logic gates are sometimes initialized to '0' before they process the sensitive intermediate value. In this case the HW is equivalent to HD because HW(x) = HW(x © 0) = HD(x,0) . The same effect can be achieved by initializing the logic to '1' because the adversary can equally exploit this inverse effect. In case of some other constant value, it is better for the adversary to consider HW hypotheses just for one bit rather than for the whole word of the sensitive intermediate value. When creating HWPM hypotheses for the whole word, it is clear that the more bits are set to the same value, the more the HW will be related to the number of transitions.
-
B. Hamming Distance Power Model
Since the power consumption depends mostly on occurrence of transitions at the output of the logical gates, the HDPM model is more accurate than the HWPM. For this reason, the adversary will select the HDPM each case the two consecutive states of the variable, containing sensitive intermediate values, can be determined. For clarity, we recall that HD is defined as follows:
HD ( x , y ) = HW ( x © y ) (3)
or
HD ( x , y ) = HW ( x ) + HW ( y ) - 2 HW ( x л y ) (4)
where © is bitwise exclusive OR operation, and л is bitwise AND operation.
Table 1 provides a very simple comparison of the HW and HD power models, which can be used by an adversary. Note, that many recent works claim that 1 ^ 0 transition can be neglected, since the corresponding dynamic power consumption is less significant than in the case of 0 ^ 1 .
Table 1. Dynamic Power Consumption for Hamming Weight and Hamming Distance Power Models which are commonly used
|
HD = 0 |
HD = 1 |
||
|
HW = 0 |
0→0 |
1→0 |
No |
|
HW = 1 |
1→1 |
0→1 |
Yes |
|
No |
Yes |
Dynamic Power Consumption |
Note also, that power consumption can be inversely proportional to the HW, i.e. if HW is 0 than power consumption can be more significant. This is our case and thus we have negative correlation in our case of FPGA.
-
C. Correlation Power Analysis
In our correlation power analysis, we are attacking only one 16-bit multiplier. Further in this paper, we will approximate the attacks complexity and success rate based on results of this attack.
Let x M denotes a vector of M known different second operands. Hence, we have M second operands known and we know the order they were processed by the multiplier implemented in the FPGA (Fig. 1). By x m , we will denote the m -th 16-bit second operand.
By L M,T , we will denote matrix of power traces, where m -th power trace l m ,* consisting of T samples corresponds to processing of the m -th second operand.
While the device is being processing data, the device is emitting some extra information (the leakage) through its physical behavior dependent on the data it is processing and operation it is performing. The leakage-information can be, for an example: sound, light (photon emission), computation time, not only the power consumption of the device. Therefore, the multiplication process is not only y m = MULT ( x m , k ), but rather
( l m ,* , y m ) = MULT ( Y . , k ) , (5)
where l is a leakage that is the power consumption in our case.
The first step of our CPA attack is to choose the leakage point of the implementation, to which a hypothetical power consumption will be made. Essentially, we are focused at the power consumption of y m registration.
The second step of our CPA attack is to collect data important to reveal the key. Hence, we must measure the power consumption of the cryptographic device while it process the different second operands x M . Since we are using HDPM, it is important to know order in which the second operands was processed. Next, CPA attack needs to have the power traces aligned. We used a trigger signal that starts power traces recording at the start of the multiplication (see Fig. 2). Power traces are then aligned according to the trigger signal.
The next step of the attack is to calculate hypothetical multiplication results for every possible choice of key (the constant operand). Therefore, we obtain matrix HM,K, where K is the number of possible values for key. Thus, in the matrix, each row is for each second operand, and each column is for each possible value of key.
h m , k ' = MULT ( x m , k ') (6)
where k ' is a hypothesis to the real k , and h m,k ' is thus hypothesis to the real result y of the multiplication. The number of possible hypotheses k ' is K , all the possible values for k. In our keys it is 216-1 because we consider that 0 is not possible, such as it is in the ECDSA.
The next step of our CPA attack is to compute hypothetical power consumption P M-1,K according the hypotheses H M,K , where
P m , k,= HD ( h m , k , h m + i, r) (7)
The matrix P M-1,K contains one less row because of the power model used (7). There are many possibilities of power models (HWPM, HDPM, bit power model, zero value power model, and at the lower level – at the transistor level, one can use differential equations). The lower level of the power model, the precision of the power model is better, but the greater computational power is needed. In our case, we used HDPM, see Eq. (7). Note that we desire to approximate complexity of this kind of attacks in generic sense. For the approximation we used only one 16-bit multiplier, and according the results, we approximate complexity of attack against key consisting of N ≥ 1 16-bit blocks.
Now the leakage signal must be compared to the hypothetical power consumption. In our case, we used a compression method to compress the matrix L M,T vector l M . We simply computed average value for each row l m ,* of the matrix L M,T . Therefore each row l m ,* is represented by average value l m = avg ( l m ,1 , …, l m,T ). The vector l m ,* contains only samples measured during the multiplication measurement clock. Therefore, this also improves the success rate of the attack, since neighborhood samples in the power traces are correlated at some moments. In order to find which of the key hypotheses is correct, we must compare the hypothetical power consumption to the measured one. As the comparison method, we used the Pearson s Correlation Coefficient. Note that according to the power model used (7), the matrix P M-1,K contains one less row, and one m -th row of that matrix corresponds to the ( m +1)-th element of the vector l M . Hence, the correlation is computed as:
-
r k = P ( P *k ,(. l 2 ,-, l M ) ) (8)
After the comparison, we obtain a correlation vector rK. According to this correlation coefficient, we will order the key hypotheses in our attacks. Therefore, the key hypothesis with the maximal correlation coefficient we assume to be the most probable and thus it has the first position. In our case, we have correlation vector since the compression of the power traces, but in a case a correlation matrix would have more than one column, for each key hypothesis only the maximal one is considered.
-
IV. Problem Formulation
A 16-bit integer multiplier is implemented in FPGA. The FPGA has further implemented only the necessary functionality for our experiments.
Goal of this work is to look at possibility of guessing a constant operand of a 16-bit multiplier from generic point of view. This constant operand (noted as key or k ) has been multiplied by known ordered set X of second operands. In order to distinguish between possible hypotheses about value of the constant operand, correlation coefficient r is used. That means there are not special analyses or preprocessing techniques, nor special side-channel-leakage models used. There is only the classical correlation power analysis [13] employed.
Our goal is not to adjust the analysis of the multiplier implementation to gain the best success rate and make it appropriate for the one implementation instance, but rather see such generic attack possibilities.
The aim of this analysis is to reveal a secret, but constant, operand k of the multiplier using side-channelleakage-information reached from power consumption L .
The power consumption has been measured during multiplication of k by known ordered set X of second operands. The CPA analysis aim is to target power consumption caused by registers that register results of multiplications. It is generally accepted that the power consumption of registers is linearly dependent on number of 0 ^ 1 and 1 ^ 0 transitions. Thus, the power consumption can be simulated by Hamming Distance (HD) which is better fitting than a Hamming Weight Power Model. However, measured power consumption will be noised by other functionality of the FPGA, which runs parallel, and also by the environment. Consider now Signal to Noise Ratio. In our case of analysis, signal consists of dynamic power consumption caused by the 32 bit registers for multiplication result. The noise signal consists of dynamic power consumption caused by LFSR (used to generate the known ordered set of first operands), state machine (used to control dataflow), UART (for communication), and signal added by environment and measurement.
We can expect more than one key hypothesis remaining after the correlation analysis. It is because multiplication by constant is linear function, while for example, if attacking AES S-Box, there is only one key hypothesis because it is nonlinear function at all.
-
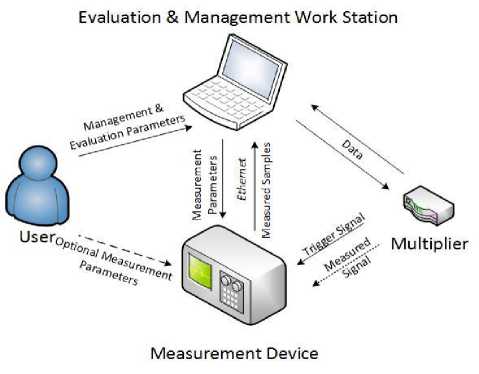
V. Measurement Setup
The measurement setup is depicted in Fig. 2. A user uses notebook as an evaluation and management work station. The workstation manages the whole attack process. It sends data to the cryptographic device, which is in our case the multiplier implementation; it also sets up the measurement device, in our case the Oscilloscope; and finally, it performs the mathematical part of the analysis, the correlation computations and success rate evaluations. The cryptographic device starts measurements by a trigger signal. Thanks to this, power traces can be easily aligned.
Power traces has been measured using coaxial cable connected to capacitor C3 such as depicted in Fig. 3. Power traces were averaged by 128 traces.
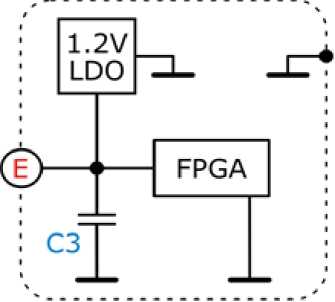
Fig. 3. Used Measurement Point in the DISPA FPGA.
We performed the analysis on 665 randomly generated keys, where the second operand was generated by the LFSR inside the device. As a power model, we used HD power model of registers for multiplication result.
-
VI. Experimental Results
CPA Attacks are aimed against registers for result (four 8-bit registers). 4096 LFSR states has been multiplied by the k . We know order of results, thus we can compute HDs of previous and actual results giving us number of 0→1 and 1→0 transitions in the result register in time. Hypothetical power consumption for all possible key hypotheses are made by computing HDs of subsequent hypothetical results of multiplications of all the 4096 LFSR states by possible keys. These hypothetical power consumptions are correlated to both measured power-consumption and simulated power traces (just the HDs) afterwards. As an outcome, correlation matrix is obtained. Then next step is to order the key hypotheses according to the correlation coefficients.
The question is how many key hypotheses take at least to account to reveal key after CPA. We will denote this number as D . Recall, we want to show how it can be dangerous to estimate this number by considering simulation only. The correct key hypothesis has thus index 0 ≤ i ≤ D after the CPA attack using HDPM simulated traces, and , let j be the index of the correct key hypothesis in reality (using power traces). From the Fig. 4, it can be clearly seen that i ≤ D with batter probability than j ≤ D . It does mean that attack using measured power traces achieves better success rate than attack using simulated power traces only. If we took 10 first key hypotheses ordered according to correlation coefficients, the attack would success in 100%, while when simulated power traces are used, it is 99.7%. If we took 5 first key hypotheses, the attack would succeed in 92.03, and 88.42% respectively.
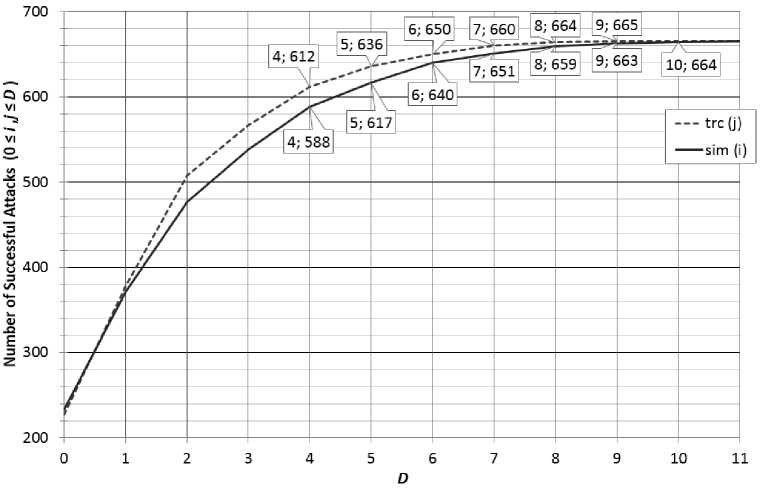
Fig. 4. Success rates of CPA 665 attacks using measured power traces, and simulated HDPM traces, regarding D max number of key hypotheses taken to account after CPA.
A. Attack Complexity Estimation P ( i i — D,•••,i N — D ) = P ( i — D ) (9)
Since we can look at revealing of N 16-bit blocks of
Therefore, also the complexity can be computed as: key as on independent trials, we can write:
Complexity = ( D + 1) N (10)
According to the results, one can try to estimate power of the attack in terms of complexity (number of key hypotheses remaining after CPA, the D ) and success probability of the attack. We will do this for both simulated power traces and measured one in order to see the difference between the estimations. Up to now, we attacked one 16-bit block of k . Based on this results, we are going to estimate attack possibilities to reveal N 16-bit blocks of k .
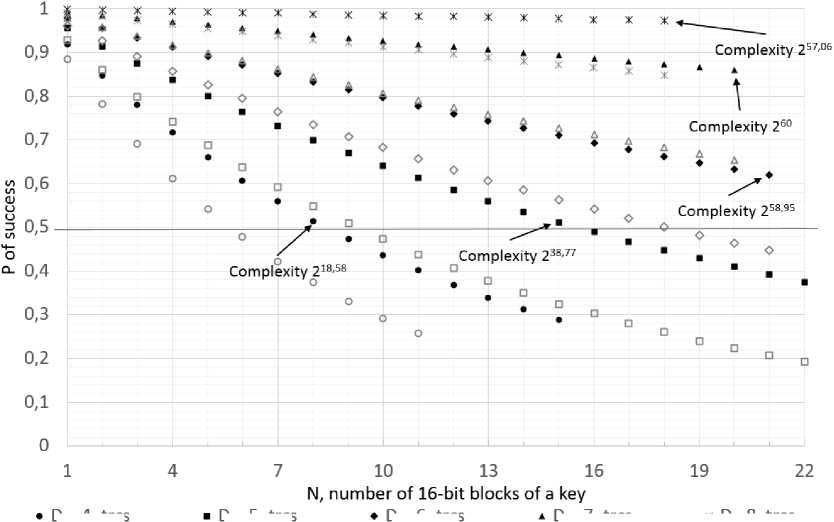
We bound these estimations. The probability of attack success must be greater than 0.5 and the complexity of the attack must be less or equal to 260.
The estimation is shown in Fig. 5. We can see that if the first 5 key hypotheses are taken after CPA against each block of key ( D = 4), the estimation using simulated power traces says that 5 blocks of key can be guessed, while estimation using measured power traces shows that
8 16-bit blocks of key can be guessed. In case of D = 5, 9 and 15 blocks of key can be revealed for simulated and measured power traces respectively. If D = 6 (number of remaining hypotheses after CPA against each block of key is 7), the estimation based on the simulation indicate that 17 blocks of key can be revealed, and based on the measured power traces, it is 21. For D = 7, the difference between estimation based on simulation and measurements can be observed in success rate. In the case of simulation the estimated probability of success is around 0.65, while in the case of measured power traces it is approximately 0.86. In both cases 20 16-bit blocks of key are predicted to be possible to reveal. If 9 first key hypotheses are considered after CPA against each block of key ( D = 8), the estimation using simulation indicates estimated probability 0.85. In case of measured power traces it is close to 1. 18 blocks of keys are indicated in both cases.
D = 4, trcs
D = 5, trcs
D = 6, trcs
D = 7, trcs
Ж D= 8, trcs о D = 4, sim
□ D = 5, sim о D = 6, sim
Fig. 5. Estimation of CPA attacks complexity and success rate of revealing N 16-blocks of key using measured and simulated power traces regarding the results of our 665 attacks using measured and simulated power traces.
-
VII. Conclusions
Generic view of CPA attack using HD power model against 16-bit multiplier that has one constant secret operand was presented. The performed CPA attacks was focused on registers registering results of the integer multiplications. We randomly and uniformly generated 665 16-bit keys and tried to reveal them. We used measured as well as simulated power traces. We have seen that using measured power traces CPA can be more successful then CPA using simulated power traces. Hence, we should be careful when estimating complexity of familiar attacks using simulated only power traces. Based on the results, we estimated success rate and complexity attack using of the knowledge of the number D of remaining key hypotheses after the CPA attack in both cases (measured and simulated power traces). The number D of key hypotheses remaining after the CPA is significantly influenced by the fact that the multiplication by constant is linear and that we used HDPM. Based on the success rates we estimated complexity and success rate of CPA attacks revealing 1 ≤ N ≤ 21 16-bit key. We showed that it is possible to reveal 21 16-bit blocks, ie. 336-bit, key with probability approximately 0.62 and complexity 258.95; and that 320-bit key can be revealed with probability approximately 0.86 with complexity 260.
Acknowledgment
Supported in part by grant APVV-0586-11 (Digital Signature Power Analysis Attacks – DISIPA Project); grant VEGA 1/0173/13; NATO’s Public Diplomacy Division in the framework of ”Science for Peace”, SPS Project 98452; National Scholarship Programme of SR – SAIA, n. o.; and the Slovak TEMPEST, a.s Company.
References Correlation Power Analysis using Measured and Simulated Power Traces based on Hamming Distance Power Model – Attacking 16-bit Integer Multiplier in FPGA
- Kocher, P. C., Jaffe, J., Jun, B. Differential Power Analysis. Proceedings of the 19th Annual International Cryptology Conference on Advances in Cryptology in CRYPTO '99, pages 388--397, London, UK, 1999. Springer-Verlag.
- E. Brier, Ch. Clavier, F. Olivier. Correlation Power Analysis with a Leakage Model. CHES, pages 16-29, 2004. Handbook. Mill Valley, CA: University Science, 1989.
- Quisquater, J.-J., Samyde, D. Electro-Magnetic Analysis (EMA): Measures and Counter-Measures for Smart Cards. Proceedings of the International Conference on Research in Smart Cards: Smart Card Programming and Security in E-SMART '01, pages 200--210, London, UK, UK, 2001. Springer-Verlag.
- Ding, G. L. – Chu, J. – Yuan, L. – Zhao, Q. Correlation Electromagnetic Analysis for Cryptographic Device. Proceedings of the 2009 Pacific-Asia Conference on Circuits, Communications and Systems, pages 388--391, Washington, DC, USA, 2009. IEEE Computer Society.
- M. Medwed, M. E. Oswald. Template Attacks on ECDSA. 9th International Workshop, WISA 2008, Jeju Island, Korea, September 23-25, 2008, Revised Selected Papers in Lecture Notes in Computer Science, pages 14 - 27, 2009. Springer.
- F.-X. Standaert, T. Malkin, and M. Yung. A unified framework for the analysis of side-channel key recovery attacks. In A. Joux, editor, Advances in Cryptology- EUROCRYPT 2009, volume 5479 of LNCS, pages 443–461. Springer Berlin.
- W. Schindler, K. Lemke, and Ch. Paar: A stochastic model for differential side channel cryptanalysis. In Cryptographic Hardware and Embedded Systems — CHES 2005, Springer, LNCS 3659, pages 30 – 46. Springer.
- M. Rivain. On the exact success rate of side channel analysis in the gaussian model. In R. Avanzi, L. Keliher, and F. Sica, editors, Selected Areas in Cryptography, volume 5381 of LNCS, pages 165 – 183. Springer Berlin.
- L. Batina, B. Gierlichs, E. Prouff, M. Rivain, F.-X. Standaert, and N. Veyrat-Charvillon. Mutual Information Analysis: a Comprehensive Study. Journal of Cryptology, 24(2):269 – 291, 2011.
- A. Heuser and M. Zohner. Intelligent machine homicide - breaking cryptographic devices using support vector machines. In Schindler and Huss Ed. Constructive Side-Channel Analysis and Secure Design – 3th International Workshop, COSADE 2012, Darmstadt, Germany, May 3-4, Proceedings, volume 7275 of LNCS. Springer, 2012, pages 249–264.
- M. Hutter, M. Medwed, D. Hein, and J. Wolkerstorfer, Attacking ECDSA-Enabled RFID Devices, ACNS 2009, LNCS 5536, pages 519–534, 2009, Springer-Verlag Berlin Heidelberg.
- P, Nath,Ch. Kumar, User's Profile Replication Tree and On Demand Replica Update in Wireless Communication. International Journal of Computer Network and Information Security (IJCNIS). Vol. 5, No. 3. 2003. MECS Publisher.
- E. Brier – Ch. Clavier – F. Olivier. Correlation Power Analysis with a Leakage Model. CHES, pages 16-29, 2004. Handbook. Mill Valley, CA: University Science, 1989.
