“Crony capitalism” - a source of social inequality in modern Russia

Author: Ilyin Vladimir Aleksandrovich
Journal: Economic and Social Changes: Facts, Trends, Forecast @volnc-esc-en
Section: From the chief editor
Article in issue: 6 (54) т.10, 2017.
Free access
Short address: https://sciup.org/147224011
IDR: 147224011 | UDC: 316.34 | DOI: 10.15838/esc.2017.6.54.1
Text of the article “Crony capitalism” - a source of social inequality in modern Russia
Region / owner Average per capita money income Owner’s fortune Tax revenues of the budget Vologda Oblast PAO Severstal 109.4 189.6 94.2 Chelyabinsk Oblast OAO MMK 87.9 281.2 101.0 Lipetsk Oblast PAO NLMK 105.2 158.5 103.9 Krasnoyarsk Krai PAO GMK Nornickel 94.4 122.8 102.6 Irkutsk Oblast PAO RUSAL Bratsk 91.5 84.5 88.0 * According to the Forbes Magazine methodology, the fortune of an entrepreneur includes the value of their assets: company shares, land, real estate, personal property, etc. Source: Forbes Magazine. Available at: bogateishie
Population of the Russian Federation over 20 years of age as of January 1, 2017, thousand people Total population (100%) 10% 40% 50% 114 566 11456.6 45826.4 57283.0 Source: Calculated by the author with the use of the data of the Federal State Statistics Service (.
The share of the income of the richest 10% of Russians in 1905–1990 decreased from 45 to 25%, but between 1990 and 2015 it sharply increased (from 25 to 45%) and returned to the level of 1905. For comparison: during the period from 1910 to 2015, the share of income of the richest 10% in France declined from 52 to 33% in the USA – increased slightly (from 43 to 47%).
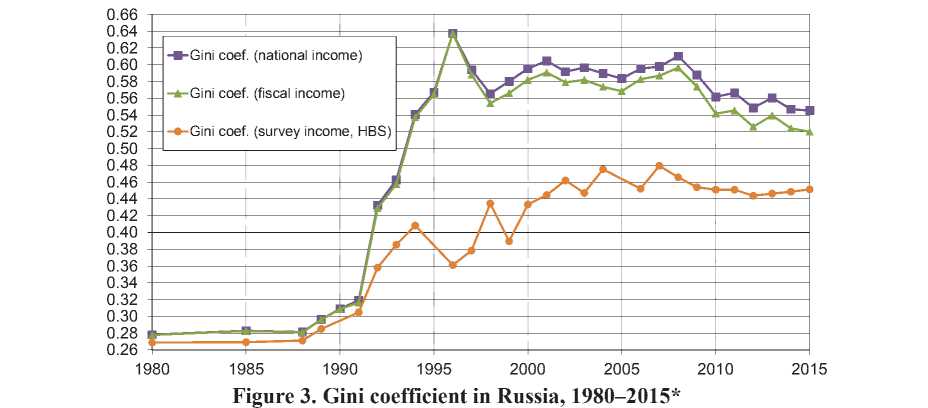
* Distribution of income (before taxes and transfers, except pensions and unemployment insurance) among equal-split adults (income of married couples divided by two). Pretax national income estimates combine survey, fiscal, wealth and national accounts data. Fiscal income estimates combine survey and income tax data (but do not use wealth data to allocate tax-exempt capital income). Survey income series solely use self-reported survey data (HBS).
The Gini coefficient, which indicates how the actual distribution of the total amount of incomes deviates from their even distribution, increased by 0.03 over the period from 1980 to 1990 (from 0.28 to 0.31; the value of the Gini coefficient can vary from 0 to 1, the higher the index value, the more unevenly the incomes are distributed). In 1990–2015, the Gini coefficient increased by 0.23 (from 0.31 to 0.54).
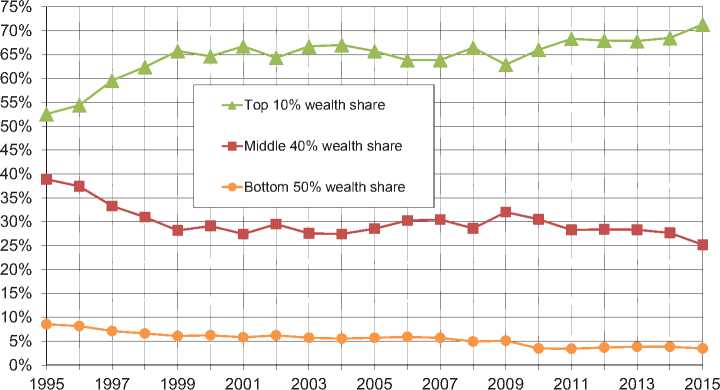
Figure 4. Wealth concentration in Russia, 1995-2015*
*Distribution of personal wealth among adults. Estimates obtained by combining Forbes billionaire data for Russia, generalized Pareto interpolation techniques and normalized WID (world wealth distributions).
Population of the Russian Federation over 20 years of age as of January 1, 2017, thousand people Total population (100%) 10% 40% 50% 114 566 11456.6 45826.4 57283 Source: Calculated by the author with the use of the data of the Federal State Statistics Service (.
An increase in inequality is evidenced by the dynamics of concentration of national wealth in different income groups. As of 2015, about 70% of Russia’s national wealth was concentrated in the hands of the wealthiest 10%, that is, approximately 11.5 million people (in 1995 they owned 50% of national wealth).
Forty percent of the population with average income (45.8 million people) own 25% of national wealth (in 1995, they owned 40% of national wealth).
The share of the 50% of those with a low income level (57.3 million people) accounts for less than 5% of national wealth (the figure was 10% in 1995).
Insert 2
Table 1. Corporate income tax burden* for major Russian companies
|
Company |
2006 |
2016 |
||
|
Billion rub. |
To the proceeds, % |
Billion rub. |
To the proceeds, % |
|
|
Tatneft |
13.7 |
3.4 |
34.8 |
6.0 |
|
NLMK |
19.2 |
11.7 |
15.5 |
3.0 |
|
Sberbank |
26.2 |
7.1 |
135.6 |
4.8 |
|
MMK |
12.7 |
7.3 |
15.2 |
4.1 |
|
Transneft |
26.0 |
12.8 |
68.5 |
8.1 |
|
Gazprom |
211.2 |
8.5 |
288.0 |
4.7 |
|
Rosneft |
125.4 |
10.0 |
116.0 |
2.3 |
|
Gazpromneft |
32.4 |
5.9 |
49.8 |
3.2 |
|
Severstal |
17.3 |
5.1 |
6.8 |
1.7 |
|
Lukoil |
75.4 |
4.1 |
64.9 |
1.2 |
|
Average by ten major companies |
56.0 |
7.6 |
79.5 |
3.9 |
* To ensure comparability, the tax burden has been calculated only for income tax. Sources: companies’ financial statements; VolRC RAS calculations.
Over the last 10 years (2006 to 2016) income tax burden on average for ten major companies in Russia declined from 7.6 to 3.9% of their proceeds.
Table 2. Dynamics of the dividends received from state corporations by the federal budget in 2008–2016
|
Indicators |
2008 |
2009 |
2010 |
2011 |
2012 |
2013 |
2014 |
2015 |
2016 |
Total for 2008– 2016 |
|
Dividends, billion rub. |
53.2 |
10.1 |
45.2 |
79.4 |
212.6 |
134.8 |
220.2 |
259.8 |
919.0 |
1934.3 |
|
To budget revenues, % |
0.6 |
0.1 |
0.5 |
0.7 |
1.7 |
1.0 |
1.5 |
1.9 |
6.8 |
1.9 |
However, the proportion of dividends received from state corporations by the budget on average over the period from 2008 to 2016 amounted to only 1.9%. A noticeable growth of the indicator is observed only in 2016 (3.5-fold: from 1.9 to 6.8% compared to 2015).
Insert 3
Table 1. Net profit and dividends to major shareholders of iron and steel corporations in 2002–2016, billion rub.
|
Indicators |
Average for 2002–2006 |
Average for 2007–2011 |
Average for 2012–2016 |
|
|
PAO Severstal (average proportion of shares is 81.5%) |
Net profit |
26.8 |
8.1 |
26.9 |
|
Dividends |
6.5 |
11.9 |
30.9 |
|
|
% of net profit |
24.3 |
146.9 |
114.9 |
|
|
PAO NLMK (average proportion of shares is 82.7%) |
Net profit |
34.6 |
40.6 |
22.9 |
|
Dividends |
8.5 |
9.0 |
20.2 |
|
|
% of net profit |
24.6 |
22.2 |
88.2 |
|
|
OAO MMK (average proportion of shares is 86.3%) |
Net profit |
24.8 |
22.4 |
9.6 |
|
Dividends |
11.7 |
3.9 |
7.2 |
|
|
% of net profit |
47.2 |
17.6 |
75.0 |
|
On average in 2012–2016, compared with 2002–2006, net profit of PAO Severstal has not changed (26.8–26.9 billion rub.); net profit of PAO NLMK and OAO MMK declined (for PAO NLMK – from 34.6 to 22.9 billion rub., for OAO MMK – from 24.8 to 7.2 billion rub.).
However, during the same period, the dividends to major shareholders of these iron and steel corporations have increased substantially : for PAO Severstal – from 24 to 115%; for PAO NLMK – from 25 to 88%; for OAO MMK – from 47 to 75%.
Table 2. Net profit and dividends to major shareholders of iron and steel corporations in 2007–2016, billion rub.
|
Indicators |
Average for 2007–2011 |
Average for 2012–2016 |
|
|
PAO GMK Nornickel (average proportion of shares is 68.9%) |
Net profit |
80.9 |
90.0 |
|
Dividends |
23.2 |
80.6 |
|
|
% of net profit |
28.7 |
89.6 |
|
|
PAO RUSAL Bratsk (average proportion of shares is 100%) |
Net profit |
3.4 |
2.1 |
|
Dividends |
0.8 |
1.6 |
|
|
% of net profit |
24.1 |
76.2 |
|
In general, similar situation is observed in major iron and steel corporations. On average in 2012–2016, compared to 2007–2011, net profit of PAO GMK Nornickel increased by nine billion rub. (from 80.9 to 90 billion); net profit of PAO RUSAL Bratsk decreased by 1.3 billion rub. (from 3.4 to 2.1 billion).
During the same period, the dividends paid to major shareholders of PAO GMK Nornickel increased from 29 to 90% of profit; those paid to major shareholders of PAO RUSAL Bratsk increased from 24 to 76%.
Insert 4
Table 1. Dynamics of average monthly wages of workers and average monthly remuneration of executives of corporations in 2011–2016, thousand rub.
|
Indicators |
2011 |
2012 |
2013 |
2014 |
2015 |
2016 |
2016 to 2011, % |
|
|
PAO GMK Nornickel PAO |
Wages of workers |
56 |
63 |
68.5 |
76 |
75 |
85 |
151.9 |
|
Number of executives, people |
20 |
19 |
24 |
26 |
27 |
27 |
135.0 |
|
|
Remuneration |
6015 |
12850 |
14253 |
6541 |
11433 |
12738 |
211.8 |
|
|
To the wages of workers, times |
107 |
204 |
208 |
86 |
152 |
150 |
+43 |
|
|
PAO RUSAL Bratsk |
Wages of workers |
No data |
45 |
47 |
52 |
53.0 |
56 |
124.4 |
|
Number of executives, people |
No data |
28 |
28 |
27 |
27 |
29 |
103.6 |
|
|
Remuneration |
No data |
3391 |
4119 |
3924 |
3653 |
4640 |
136.8 |
|
|
To the wages of workers, times |
No data |
75 |
87 |
75 |
69 |
83 |
+8 |
|
|
PAO Severstal |
Wages of workers |
34 |
39 |
47 |
53 |
54 |
61 |
179.4 |
|
Number of executives, people |
10 |
10 |
10 |
10 |
22 |
22 |
220.0 |
|
|
Remuneration |
8904 |
5417 |
6680 |
9563 |
37403** |
36997** |
415.5 |
|
|
To the wages of workers, times |
262 |
138 |
142 |
181 |
695 |
606 |
+344 |
|
|
OAO MMK |
Wages of workers |
40 |
43 |
46 |
47 |
52 |
55 |
137.5 |
|
Number of executives, people |
10 |
26 |
25 |
25 |
23 |
23 |
230.0 |
|
|
Remuneration |
434 |
1613 |
3879 |
1467 |
2827 |
2677 |
616.8 |
|
|
To the wages of workers, times |
11 |
37 |
85 |
31 |
55 |
49 |
+38 |
|
|
PAO NLMK |
Wages of workers |
35 |
39 |
43 |
48 |
52 |
58 |
165.7 |
|
Number of executives, people |
17 |
21 |
19 |
18 |
18 |
18 |
105.9 |
|
|
Remuneration |
2551 |
1600 |
2515 |
5363 |
7174 |
7464 |
292.6 |
|
|
To the wages of workers, times |
73 |
41 |
58 |
111 |
137 |
129 |
+56 |
|
|
PAO Gazprom |
Wages of workers |
77 |
79 |
90 |
94 |
106 |
114 |
148.0 |
|
Number of executives, people |
27 |
27 |
27 |
27 |
27 |
27 |
100.0 |
|
|
Remuneration |
5540 |
6574 |
9235 |
13559 |
14818 |
14491 |
261.6 |
|
|
To the wages of workers, times |
72 |
83 |
102 |
145 |
140 |
127 |
+55 |
|
|
PAO NK Rosneft |
Wages of workers |
44 |
51 |
60 |
65 |
70 |
75,5 |
116.2*** |
|
Number of executives, people |
12 |
19 |
21 |
20 |
18 |
14 |
116.7 |
|
|
Remuneration |
Data not available |
17942 |
28337 |
31055 |
173.1*** |
|||
|
To the wages of workers, times |
276 |
405 |
411 |
+135*** |
||||
|
* Monthly average remuneration per senior executive includes all types of remuneration, excluding dividends, including wages, bonuses, commissions, and reimbursement of expenses ** The growth in remuneration is due to the establishment of a management company. *** 2016 compared to 2014. |
||||||||
In 2011, the average monthly remuneration of executives of major corporations in the tens and even hundreds of times exceeds the wages of employees: at PAO Gazprom – in 72 times; at PAO NLMK – in 73 times; at PAO Severstal – in 262 times; at PAO NK Rosneft (according to the data as of 2014) – in 276 times, etc.
By 2016, this indicator has significantly increased in all major corporations: at PAO Gazprom to 127 times; at PAO NLMK – 129 times; at PAO Severstal – 606 times; at PAO NK Rosneft – 411 times. Moreover, in the majority of the corporations there has been an increase in the number of “recipients” of this remuneration: for example, at PAO Severstal – from 10 to 22 people; at OAO MMK – from 10 to 23 people, etc.
Insert 5
Table 1. Dynamics of people’s per capita monetary incomes, fortune of owners of metallurgical corporations, and tax revenues of the budgets of Russian Federation constituent entities in 2012–2016 (in the prices as of 2016)
|
Indicators |
2012 |
2013 |
2014 |
2015 |
2016 |
2016 compared to 2012, % |
|
|
Vologda Oblast |
People’s per capita monetary incomes, rub. |
25036 |
26913 |
28273 |
28652 |
27379 |
109.4 |
|
Fortune of the owner of PAO Severstal, billion rub. |
528.1 |
479.4 |
1123.0 |
965.8 |
1000.1 |
189.6 |
|
|
Tax revenues of the budget, billion rub. |
55.1 |
50.9 |
52.8 |
48.7 |
51.9 |
94.2 |
|
|
Chelyabinsk Oblast |
People’s per capita monetary incomes, rub. |
26475 |
27863 |
28228 |
27527 |
23272 |
87.9 |
|
Fortune of the owner of OAO MMK, billion rub. |
168.7 |
121.0 |
297.2 |
336.7 |
474.4 |
281.2 |
|
|
Tax revenues of the budget, billion rub. |
129.8 |
129.5 |
131.6 |
133.2 |
131.1 |
101.0 |
|
|
Lipetsk Oblast |
People’s per capita monetary incomes, rub. |
27146 |
28955 |
31326 |
31012 |
28547 |
105.2 |
|
Fortune of the owner of PAO NLMK, billion rub. |
580.4 |
752.6 |
1002.0 |
824.8 |
920.1 |
158.5 |
|
|
Tax revenues of the budget, billion rub. |
46.6 |
46.5 |
50.8 |
51.7 |
48.4 |
103.9 |
|
|
Krasnoyarsk Krai |
People’s per capita monetary incomes, rub. |
29664 |
31128 |
29792 |
29975 |
28010 |
94.4 |
|
Fortune of the owners of PAO GMK Nornickel, billion rub. |
902.9 |
830.1 |
1807.1 |
1242.5 |
1108.8 |
122.8 |
|
|
Tax revenues of the budget, billion rub. |
189.0 |
180.7 |
176.3 |
188.2 |
194.0 |
102.6 |
|
|
Irkutsk Oblast |
People’s per capita monetary incomes, rub. |
24057 |
24883 |
24875 |
25183 |
22017 |
91.5 |
|
Fortune of the owner of PAO RUSAL Bratsk, billion rub. |
345.1 |
289.8 |
531.2 |
186.4 |
291.5 |
84.5 |
|
|
Tax revenues of the budget, billion rub. |
146.1 |
134.0 |
133.5 |
116.1 |
128.5 |
88.0 |
|
*According to the Forbes Magazine methodology, the fortune of an entrepreneur includes the value of their assets: company shares, land, real estate, personal property, etc.
Source: Forbes Magazine. Available at:
The maximum growth of people’s per capita incomes for the period from 2012 to 2016 is registered in the Vologda Oblast (by 9%), the maximum increase in tax revenues of the budget – in the Lipetsk Oblast (by 4%).
For comparison: during the same period, the fortune of the owners of major corporations located in these areas increased in 1.5–3 times: PAO Severstal – by 90%; OAO MMK – by 181%; PAO NLMK – by 59%; PAO GMK Nornickel – by 23%.
Thus, the law is built so that the profit from the exploitation of national wealth goes to owners of corporations and is realized primarily in their private interests. As a result of this policy of “crony capitalism” that has taken root in the system of public administration, the number of dollar billionaires in Russia over the past 10 years increased by 60% and their wealth increased by 50% (Tab. 5) .
However, the policy of “oligarchic capitalism” brings profit only to the people who create it and support it. So for about 30 years (1989– 2016), the growth of the aggregate real income of 50% of Russians with the lowest income (more than 57 million people) decreased by 20%, and as for the 40% of those with average incomes
(almost 46 million people), it increased only by 15%. For comparison: the share of incomes of the richest 10% (11.5 million people) increased by 171%, that is, it almost doubled, and the income level of 0.001% of the richest Russians (about 1,000 people) amounted to 4,122%, i.e. increased in almost 40 times (Tab. 6) .
In 1989–2016, the national average annual growth rate of people’s incomes amounted to 1.3%. At that, 57 million Russians face a decline in the growth rate of their income (-0.89%), and the richest 11.5 million people in the country experience an increase in their income by almost 4%; among the 1,000 most wealthy Russian citizens, the growth rate of income in 1989–2016 amounted to 15%.
Table 5. Changes in the wealth of Russia’s dollar billionaires
|
Year |
Number of people |
Fortune, billion US dollars |
Fortune, billion rub. |
On average per billionaire |
|
2006 |
60 |
337.3 |
9168.4 |
152.8 |
|
2007 |
100 |
521.7 |
13343.5 |
133.4 |
|
2008 |
32 |
102.1 |
3553.1 |
111.0 |
|
2009 |
62 |
265.0 |
7983.0 |
128.8 |
|
2010 |
101 |
432.7 |
12660.1 |
125.3 |
|
2011 |
96 |
376.1 |
11240.6 |
117.1 |
|
2012 |
110 |
426.8 |
12835.0 |
116.7 |
|
2013 |
111 |
422.2 |
14689.3 |
132.3 |
|
2014 |
88 |
337.0 |
23476.8 |
266.8 |
|
2015 |
77 |
282.6 |
22357.7 |
290.4 |
|
2016 |
96 |
386.3 |
22077.3 |
230.0 |
|
2016 in % to 2006 |
160 |
114.5 |
241 |
150.5 |
Table 6. Growth of incomes and inequality in Russia (1989–2016 years), in %
Income group (distribution of per adult pre-tax national income)* Number of people in the group as of January 1, 2017**, people Average annual growth rate in 1989–2016 Aggregate real growth in 1989–2016 Total population 114566000 1.3 41 Bottom 50% 57283000 -0.89 -20 Middle 40% 45826400 0.5 15 Top 10% 11456600 3.8 171 Including Top 1% 1145660 6.4 429 Including Top 0.1% 114566 9.5 1054 Including Top 0.01% 11457 12.2 2134 Including Top 0.001% 1146 14.9 4122 * Distribution of pre-tax national income among equal-split adults. The unit is the adult individual (20-year-old and over; income of married couples is split into two). Fractiles are defined relative to the total number of adult individuals in the population. Corrected estimates (combining survey, fiscal, wealth and national accounts data). * * The population of the Russian Federation over 20 years of age was calculated by the author according to the data of the Federal State Statistics Service (. Source: Novokmet F., Piketty T., Zucman G. From Soviets to Oligarchs: Inequality and Property in Russia, 1905-2016. National Bureau of economic research. Cambridge: MA, August 2017. Р. 78.
“Russians are sensitive to the inequalities that they face personally or see their existence in society. Income inequality is perceived most acutely today, and the sharpness of this inequality for the population has increased significantly during the crisis (which is not surprising, as income inequality in modern Russia defines a number of non-monetary inequalities that afflict today’s population, including the opportunity to receive necessary medical care)»10.
It should be noted that a high degree of social inequality is manifested in various spheres of life and goes far beyond financial well-being. Experts at the Institute of Sociology point out that “despite the fall in the real incomes of Russians due to the growth of prices in the past year, they began to note certain disparities as painful to society, rather than to themselves. This applies to all the inequalities they consider to be most common: inequalities in the access to healthcare and good jobs, inequalities in housing conditions, in opportunities for children from different social strata, in access to education... High scores with which Russians estimate the severity of different types of inequalities currently existing in the Russian society are not detached from reality, but dictated by it”1 11.
As we can seen from the data presented in Tab. 7 , income inequality is perceived by Russians most acutely, but it is not the only issue that alarms them: other issues include the painful perception of inequalities in access to medical care, housing conditions, and good jobs. They are perceived as “painful to society” by 50–80% of Russians.
Table 7. Perception of the acuteness of various inequalities by Russians, October 2015, %* (ranked by the inequalities painful personally for respondents)
|
Inequalities |
Most painful for society in general |
Most painful for oneself (for one’s family) |
|
Incomes |
82 |
66 |
|
Access to medical aid |
59 |
39 |
|
Housing conditions |
61 |
30 |
|
Access to good jobs |
50 |
23 |
|
Opportunities for children from different social strata |
31 |
18 |
|
Access to education |
40 |
16 |
|
Leisure opportunities |
14 |
12 |
|
Property ownership |
18 |
12 |
|
Acquaintance with the people of influence |
10 |
11 |
|
Getting to a necessary destination by public transport |
8 |
10 |
|
Physical capabilities |
7 |
9 |
|
Using computer and the Internet |
3 |
3 |
|
There are no such inequalities |
3 |
9 |
|
* The data show the situation concerning working Russians. Source: Rossiiskoe obshchestvo: god v usloviyakh krizisa i sanktsii. Informatsionno-analiticheskii material po itogam obshcherossiiskogo sotsiologicheskogo issledovaniya [The Russian society: a year in the conditions of crisis and sanctions. Information and analytical materials on the results of nationwide sociological research]. Moscow. Institut sotsiologii RAN, 2015. P. 31. |
||
Thus, having analyzed the factual information obtained from various sources, we can conclude that the contours of a political system established by the ruling elite in the 1990s for the purpose of self-enrichment continue to prevail. With the fraudulently acquired capital, they were able to penetrate into the very depths of the political system of the country, thus forming a system of “capitalism for the few”, which “successfully” allows them to extort national wealth and use it for their own purposes. In other words, the problem of social inequality in Russia remains unresolved not because there are some obstacles on the way to achieving this goal, but because the ruling elite does not set such a task in the first place .
Deliberately ignoring social decrees of the President and the needs of the population, the financial and economic bloc of Russia’s liberal Government creates favorable conditions for the enrichment of representatives of big business; as a result, by 2016, Russia has topped the ranking of countries by volume of “crony capital” (18%)12.
There are a lot of representatives of economic science, who speak openly about the domination of oligarchic capitalism in Russia and warn about the disastrous consequences it may bring to our country (S.Yu. Glazyev, S.S. Gubanov, B.Yu. Titov, M.G. Delyagin, etc.). And it is not only about a threat to social stability, but also about the gap between key participants of the geopolitical competition. History has many examples of how this factor became crucial for the collapse of Russian statehood: such critical backwardness in scientific, technological and socio-economic development was the prerequisite for the fact that the West actually financed the Revolution in 1917 and the collapse of the Soviet Union in 1991. And both these “projects”, in fact, turned out to be quite successful for the West...
In March 2012, on the eve of Vladimir Putin’s third presidential term we paid attention13 to his call to “turn the page”, to “end the phase” and “settle the matters ” of the 1990s, when “business was often reduced to a simple division of the state pie” .
B.Yu. Titov: “Now the World Bank estimates the growth opportunities of the Russian economy at 1.2% up to 2025. Our government’s assessments are the same. We believe that the Russian economy cannot develop with the rate of 1% of GDP per year when the average global economic growth is 3%. If we don’t have a 4–6% growth, then Russia will experience further stagnation and move to the second, and then the third tier of countries according to its economic indicators... A growth rate that is less than 2-3% means that Russia may forever lag behind leading countries of the world, since the 1% growth of GDP at purchasing power parity (PPP) in China is 197 billion US dollars, in Russia – 37 billion US dollars. This means that 1% growth in China is 5.3% growth in Russia. We believe that in 2019, this growth should be 3.5–5%. The growth of 4–6% should be maintained until 2025. Then it may slightly decrease by 2035 – to 3–3.5%”14.
-
• “...Concerning what happened in the 1990s. We talked a lot on this subject, when the business was often reduced to a simple division of the state pie”;
-
• “...We, of course, must turn over this page, as well... We need to close this period. Different options are offered, it is necessary to discuss them with society and with the expert community, but it is necessary that society should approve these options of settling the issues of the 1990s such as, frankly speaking, a dishonest privatization, and various auctions”;
-
• “...It is necessary to provide public legitimacy of the very institution of private property, to ensure public trust in business; otherwise we will not be able to develop a modern market economy, nor can we create a healthy civil society... major decisions should be taken in 2012”15.
Moreover, Vladimir Putin stressed that “the main decisions about this should be taken as early as 2012”16.
Almost six years passed since that time. V. Putin’s third presidency is coming to an end. However, it is premature to speak about any tangible signs of overcoming the “oligarchic capitalism” and its consequences. And this cannot but raise the questions: what next? What are we to expect from the next presidential term of Vladimir Putin, whose victory in the 2018 election is predicted by the majority of experts? Will he manage to reorient the country’s political system so that key issues of national security and national development took priority over the interests of “oligarchic capitalism” in the value system of the ruling elite? And will he be able to do so in an evolutionary way, not allowing a crisis of Russian statehood to break out? Will Russia be able, in the end, during the next six years to take the next step in its historical development, which is essential for maintaining its national security in the context of rapid progress?..
The questions are numerous, and the answers to them will be received, probably, in the nearest six-year period (which will be the last presidential term of Vladimir Putin, according to the Constitution of the Russian Federation). The solution to these issues will depend on an integrated approach to improving the efficiency of public administration and on the political will of the head of state, because the fusion of the interests of the political elite and oligarchy exists at all levels of the administration system, and this situation impedes the implementation of national interests, and this problem cannot be overcome without making tough internal policy decisions. It is important that awareness of the problem of “oligarchic capitalism” and its negative consequences for the country should be a priority in the Program of action of the President for the near six-year term and that the general population should see that this Program is implemented on a system basis, that is, year by year, consistently, no matter what external or internal circumstances may be.
In conclusion, we should note that the President has the powerful resource that has more than once played a crucial role in Russia’s history: this resource is the trust of the population. However, like any other resource, the support that people show toward the head of state is not unlimited: it depends on how the key needs of the population are reflected in legislation and in administrative decisions of the authorities. According to the latest nationwide sociological research17, in society there is a growing need for change. The value of stability is increasingly giving way to the values of development. It is possible to realize this demand only if there is an effective system of public administration aimed to implement national interests; therefore, overcoming of “crony capitalism” is the main condition for Russia’s transition to a new stage of its historical development.
References “Crony capitalism” - a source of social inequality in modern Russia
- Glazyev S.Yu. Pochemu ne rastet rossiiskaya ekonomika (29.06.2017) . Official website of S.Yu. Glazyev. Available at: https://www.glazev.ru/articles/6-jekonomika/54326-pochemu-ne-rastet-rossi-skaja-jekonomika..
- Ilyin V.A. K itogam politicheskogo tsikla . Ekonomicheskie i sotsial'nye peremeny: fakty, tendentsii, prognoz , 2012, no. 1 (19), pp. 9-16..
- Rossiiskoe obshchestvo: god v usloviyakh krizisa i sanktsii. Informatsionno-analiticheskii material po itogam obshcherossiiskogo sotsiologicheskogo issledovaniya . Moscow. Institut sotsiologii RAN, 2015. 48 p..
- Epikhina Yu.B. (Ed.). Sotsial'naya spravedlivost' v russkoi obshchestvennoi mysli: monografiya . Moscow: Institut sotsiologii RAN, 2016. 219 p..
- Stein L. von. Uchenie ob upravlenii i pravo upravleniya s sravneniem literatury i zakonodatel'stv Frantsii, Anglii i Germanii . Saint Petersburg: A.S. Gieroglifov, 1874. 578 p..
- Novokmet F., Piketty T., Zucman G. From Soviets to Oligarchs: Inequality and Property in Russia, 1905-2016. National Bureau of Economic Research. Cambridge, MA, 2017. 79 p.
