Crop Type Classification Based on Clonal Selection Algorithm for High Resolution Satellite Image

Author: J. Senthilnath, Nitin Karnwal, D. Sai Teja
Journal: International Journal of Image, Graphics and Signal Processing(IJIGSP) @ijigsp
Article in issue: 9 vol.6, 2014.
Free access
This paper presents a hierarchical clustering algorithm for crop type classification problem using multi-spectral satellite image. In unsupervised techniques, the automatic generation of clusters and its centers is not exploited to their full potential. Hence, a hierarchical clustering algorithm is proposed which uses splitting and merging techniques. Initially, the splitting method is used to search for the best possible number of clusters and its centers using non-parametric technique i.e., clonal selection method. Using these clusters, a merging method is used to group the data points based on a parametric method (K-means algorithm). The performance of the proposed hierarchical clustering algorithm is compared with two unsupervised algorithms (K-means and Self-Organizing Map) that are available in the literature. A performance comparison of the proposed algorithm with the conventional algorithms is presented. From the results obtained, we conclude that the proposed hierarchical clustering algorithm is more accurate.
Hierarchical clustering, k-means, Self Organizing Map, Artificial Immune System
Short address: https://sciup.org/15013404
IDR: 15013404
Text of the scientific article Crop Type Classification Based on Clonal Selection Algorithm for High Resolution Satellite Image
Agriculture is the process of producing food by the systematic growing and harvesting of crops. Improvement in agricultural productivity is now a necessity, due to limitations in the expansion of cultivated acreage and the ever-increasing demand for food. Total agricultural production is the product of planting area and the crop yield; therefore production estimation consists of yield estimation and area prediction. Thus, there arises a need to make the best possible use of crop cultivable area. Amongst the multiple benefits and uses of remote sensing, one of the most important applications is to solve the problem of crop classification
-
i .e. distinguishing between various types of crops [1]. Investigation of the temporal changes in the cultivated area also uses the satellite imagery as a viable source [2].
Satellite images provide a rich source of information about agricultural activities being carried out in a specific area. Vegetation in satellite images shows crop growth from planting through to harvest (i.e. the temporal patterns in reflectance), along with the abnormalities, and changes as the season progress. A geo-referenced and ortho-rectified image can locate these problem areas and the size of the area affected can be easily determined. In addition to highlighting problematic areas, images can also act as an early indicator of crop yield. This information can be constructively used to improve agricultural productivity. Furthermore, agricultural activities can be planned based on the available information- delineating their extent [1], deciding on the type of crop to be cultivated [3], and knowing the crop growth stage [4].
Crop identification and mapping benefit from the use of multi-spectral imagery to facilitate classification as it takes into account changes in reflectance as a function of crop type. Crop classified information can be used to audit land usage, in the context of agriculture planning for efficient crop cultivation. Considerable variability has been observed in the way in which crops are cultivated within an agricultural zone and hence crop classification becomes a challenge [5].
Evolution of satellite image processing for crop mapping problems can be broadly divided into two categories – supervised and unsupervised techniques [6]. In supervised techniques, the homogeneous representative samples of the different surface types of interest are used (referred to as training areas). All the spectral bands of the pixels comprising these areas have numerical information and it is used to “train” the algorithm to recognize spectrally similar areas for each class. Each and every pixel in the image is compared to these signatures and labeled as the class it most closely “resembles” digitally. Various image classification techniques have been tried and tested to obtain the best classification efficiency [7]. Among the supervised techniques, artificial neural networks have been extensively used [8][9] and have been reported to perform better when compared with statistical classifiers. The problem of crop type classification has been tackled using a number of supervised techniques [10][11][12] and these techniques have performed efficiently.
For a given satellite image, if there is a lack of ground truth information, then unsupervised techniques can be applied for classification of satellite image into distinct land cover regions [13]. In an unsupervised technique without prior knowledge of labels, data sets are subdivided into groups or clusters based on some attributes, and are then matched by the analyst to information classes. The knowledge extracted from the data set is in the form of optimal cluster centers. The main aim is to ensure that the intra-cluster distance is minimum and inter-cluster distance is maximum. Some of the widely used unsupervised techniques for crop type classification problem using satellite imagery are k-means [14], iterative self-organizing data analysis (ISODATA) [15], and self-organizing feature maps [16]. Further, many researchers have shown clustering problems can be analyzed efficiently using hierarchical methods [17][18]. The hierarchical clustering for crop type classification using QuickBird image is the subject of this study.
A popular partitional clustering algorithm—k-means clustering, is essentially a function minimization technique, where the objective function is the squared error. However, the main drawback of k-means algorithm is that it converges to local minima from the starting position of the search [19]. In the literature, Kohonen’s Self-Organizing Map [20] has been widely used in the fields of clustering [21]. The main disadvantages of SOM are bad organization, bad visualization, unbalanced classes, and strong dependence on the initialization [22]. In order to overcome local optima problems, many nature inspired algorithms such as ant colony optimization [3] and particle swarm optimization [3] have been used. Recently, efficient hybrid evolutionary optimization algorithms based on combining evolutionary methods and k-means to overcome local optima problems in clustering have been successfully applied [23].
Artificial Immune System (AIS) is a relatively recent family of nature-inspired algorithm, which has gained popularity in various fields of research. AIS is a computational system which has been inspired by theoretical immunology and observed immune system functions. This technique has been successfully applied in the field of pattern recognition [24], data mining [25], fault detection [26], crop classification [27], multi-spectral satellite image classification [28][29][30][31] and in many other fields. AIS works by creating a compressed data representation of the input data set by compressing the rows and then automatically generates clusters and its centers from the compressed data. These centers are globally optimal centers of the immune network.
Contribution of this paper: In this paper, we propose a hierarchical clustering algorithm for crop type classification problem. The proposed algorithm uses splitting and merging techniques. A combination of nonparametric method and parametric method is used for splitting and merging. Hierarchical clustering constructs a hierarchy of clusters by splitting a large cluster into smaller ones and merging smaller clusters into their nearest centroid. To search for the best possible number of clusters and its centers (splitting), the non-parametric method namely Artificial Immune System is used. In order to group the data points to their respective classes (merging), parametric methods namely k-means and voting are used. The major hurdle here is to obtain possible combinations of clusters that can be used to split the data set and merge the data set efficiently with their respective groups. The advantage of the algorithm can be understood from the following aspect: It is a self-learning algorithm which utilizes the immunological properties like clonal selection and memory. It is a non-linear model and can be modeled for real complex world problems. It inherits the memory property of human immune systems and can recognize the same or similar antigens quickly at different times. Therefore, the proposed algorithm overcomes these difficulties by combining splitting and merging techniques. The performance of the proposed algorithm is compared and analyzed with two unsupervised algorithms, namely, ALG1: K-means and ALG2: Self Organizing Map (SOM). The performance measures used are classification accuracy and Receiver Operating Characteristics (ROC). Multi-spectral Image – QuickBird Image of the region around Mysore district in Karnataka, India is used to demonstrate the performance of the proposed hierarchical Artificial Immune System clustering algorithm (ALG3).
The remainder of the paper is organized as follows. The objective function used in clustering the data set is given in Section II. Cluster splitting and merging is given in Section III. In section IV, the performance measures are given and in section V, motivational example is provided. The results obtained using this methodology are presented and discussed in Section VI. Section VII concludes and summarizes the observations obtained by using this approach to multi-spectral QuickBird image.
-
II. Objective Function in Clustering
An objective function determines the goodness of a solution. In case of clustering, it is used to determine the cluster centers of the data set. The objective functions used in ALG1: K-means; and ALG2: Self-Organizing Map (SOM) and ALG3: proposed hierarchical artificial immune system, is provided here.
-
A. K-means Algorithm
The k-means algorithm [32] is a parametric technique i.e., the number of clusters is known a priori. The objective function is the sum of error squared, which is to be minimized:
K
J(K) = VV (x i - c k)2 (1)
k=1 ieck where ck is the number of clusters, given as c = V -xi- and nk is the number of data points in
-' nk cluster k, given as nk = |Ck|.
In most applications, one directly minimizes this objective function in K-means clustering, to obtain the cluster centers.
-
B. Self Organizing Map
The SOM defined by [20] is a Gaussian-neighborhood, Euclidean distance and rectangular topology. The two factors that essentially govern the SOM [20] can be elucidated as: i) Spatial concentration of the network activity on the cell (or its neighborhood) that it best tuned to the present input, and ii) Further sensitization or tuning of the best-matching cell and its topological neighbors to the input. The basic steps in the algorithm include two stages [20]:
-
i. Competition: An input x(t) is presented to the network at epoch (iteration) t . The ‘winning neuron’, i.e. the neuron that most closely matches the input, is selected using Eq. 2. This is also known as the “objective function”
c = argmin t (| x(t) — w( t )||2) (2)
w ( t ) is the weight vector of cell at epoch t . . 2 denotes the Euclidean distance. The neuron c is denoted the ‘winner’ and a neighborhood set Nc around the cell c is defined.
. Updat on: All the cells that fall inside this neighborhood then undergo the updation process. The radius of N c is time-variable and it is found to be very large at the beginning and then decreases uniformly.
From the above basic algorithm, many other algorithms have been developed which incorporate various improvements over the original one. These include Hybrid SOM with incremental clustering [33], parameter-less SOM [34] and many more. For our study, we will be implementing the original SOM algorithm developed by [20].
-
C. Art f c al Immune System
The Immune System is a complex functional system of cells, tissues and organs with the fundamental role of limiting damage to the host organism by pathogens (called ant gens , Ag ), which elicit an immune response. One such response is secretion of ant body , Ab by B -cells (or B -lymphocytes). A portion of antibody called paratope or V-reg on recognize a portion of antigen called ep tope. These portions adhere to the antigens in order to kill, ingest or remove them.
The Immune System employs two significant principles [35] that facilitate the B -cell generation to bind the antigens. These principles are Clonal Selection Theory and Immune Network Theory. A detailed statistical theory along with natural immune system is provided as follows:
-
1) Clonal Select on Theory: This theory explains how an immune response is mounted when a non-self-antigenic pattern is recognized by a B-cell [28][18]. When an antigen is detected, those B-cells that best recognize, i.e. have the best affinity for the antibody, proliferate by cloning and become memory cells. The affinity between the antibody and the antigens is the distance between them, which can be found by various metrics. In terms of the Euclidean distance, the affinity measurement for the antigen and the antibody, the grouping function for the antigen can be defined as [29]:
J (u, x) = VCJ,VC Е'=,,„/u, )| kj - c,||
where u j indicates the extent with which the vector X j ( j=1,2,3….,n ) belongs to the group C ( i=1,2,3….,c ) and takes values between 0 and 1. Here, the X vector represents antigens and group C represents the generated antibodies. During each grouping the n antigens are grouped into different C j ( j=1,2,3,….c ). Based on the strength of affinity, u j can be defined as follows:
u, =1
1 ifk ^/'addk^-cCl^l |X7-Ck\|\0 otherwise
w , ( t + 1)
w ( t ) + a ( t )[ x ( t ) - w , ( t )] if i e N ( t ) ! w , ( t ) if it Nc ( t )
Antibodies clone according to the following equation [30]:
where a ( t ) is a scalar-valued ‘adaptation gain’. It decreases with time.
n = VV round (в x M) (6)
i = 1
where p is a multiplication factor, M is the affinity between antigen and generated antibodies, round(·) is the operator that rounds its argument.
The B -cells that have less affinity towards antigens are either directly eliminated or undergo hypermutation process. In this process, random changes are introduced in the V -region of the antibody which, occasionally, leads to an increase in its affinity towards the antigens. These increased affinity cells are selected and hence survive, to enter the memory pool and the remaining cells eventually die (suppression). These mutations are, however, dependent upon the affinity to the antigen. The highest affinity cloned cells experience the lowest mutation rates, whereas the lowest affinity cloned cells have high mutation rates. This process of increased affinity is also known as affinity maturation .
The mutation of n clones is performed according to the following equation:
Mutated _ clone; = n + Mutation _ rate x N(0,1) (7)
where i lies between 1 and n , N(0,1) is a Gaussian random variable of zero mean and standard deviation of one, mutation_rate is a user-entered parameter [28].
When a body has been successfully defended against an antigen, memory cells remain circulating throughout the body for a long period of time. When the immune system is later exposed to the same type of antigen (or a similar one), these memory cells get activated, and present a better and more efficient response. Such a strategy ensures both high speed and accuracy. This design forms an indispensable part of a reinforcement learning strategy [36], where the system is continuously improving its capability to perform its task.
-
2) Immune Network Theory: The Immune Network Theory [37] indicates that the immune system involves not only the interactions of antibodies and antigens but also that of antibodies with other antibodies. The immune cells respond positively to the recognition of an antigen and negatively to recognition of another antibody. A positive response results in cell proliferation, cell activation and antibody secretion (called Network Activation), while a negative response leads to tolerance and suppression of redundant antibodies (called Network Suppression). Both of these responses continue until an equilibrium is reached and finally there is a network of antibodies and antigens. Thus, on the basis of the strength of the antigenic affinity and through the processes of antibody optimization and antibody suppression, optimal antibodies (cluster centers) are split from the input data set. These small clusters are now merged into large clusters with the help of K-means and voting algorithm. This kind of clustering approach is called agglomerative technique.
The optimal cluster centers generated are used for initializing K-means to perform agglomerative clustering. The number of clusters is known a priori in K-means. It groups the data points to closest cluster centers using a similarity metric. This procedure is carried out iteratively till the similarity metric becomes stationary. The objective function given in Eq. 1 is directly minimized to obtain the cluster centers.
Then, we label a cluster based on the maximum number of data points (i.e. voting method) belonging to a class label. To estimate the effectiveness and efficiency of the clustering algorithm, we require class labels for the data points which are used in the clustering algorithm. After agglomerative clustering is carried out, we need to group the clusters and evaluate the performance.
-
III. Clustering Splitting and Merging
The aiNet algorithm, first proposed by [38], implies both the principle of clonal selection and immune network theory. An antigen represents each data from input data set and an antibody as cluster representatives. In the current work, the antibody network is generated, by clonal selection, affinity maturation and immune network theory and is, then, subjected to K-means, and voting algorithm is used to classify the data set to their respective classes.
The implementation of the Hierarchical Artificial Immune System algorithm based on artificial immune system principles is as follows [18]:
-
1. Randomly create a matrix M of Abs .
-
2. For each Ag , do
-
2.1 Calculate affinity between Ag and each Ab from M according to Eq. 4.
-
2.2 Select n highest affinity Abs.
-
2.3 Proliferate (Clone) these n selected Abs proportionally to their antigenic affinities: higher the affinity, larger the number of clones, with the help of Eq. (6).
-
2.4 Mutate this set of clones towards the Ag with a rate inversely proportional to their affinities: higher the affinity, lower the mutation. The mutation of clones is done according to Eq. 7
-
2.5 Determine affinity between Ag and each mutated clones.
-
2.6 Re-select nc% of highest affinity Ab (clones) and
-
-
2.7 Eliminate those Ab with affinity inferior to death threshold (σd) yielding a reduction in memory matrix Mp.
-
2.8 Calculate the network affinity between Ab in the matrix Mp.
-
2.9 Clonal Suppression: Eliminate those Ab having affinity lower than suppression threshold (σs).
-
2.10 Concatenate the total antibody matrix with the resultant network matrix.
-
3. Determine network affinity among all memory antibodies.
-
4. Network Suppression: Eliminate all Ab having affinity lower than σs.
-
5. Add a new set of randomly generated set of Ab to network Ab. Thus, cluster centers are generated in the form of network of antibodies.
-
6. These cluster centers are provided for K-means clustering to optimize the function of Eq. 1.
-
7. Merge data points to the closest clusters using Eq. 1.
-
8. Use voting method for each data points belonging to the cluster.
-
9. Clusters are grouped in agglomerative fashion using labels.
-
10. Assign each data point to one of the class.
-
11. Calculate the performance measures of each class.
create a partial memory matrix Mp.
In the above algorithm, steps 2.1 to 2.7 describe the clonal selection and affinity maturation principles. Steps 2.8 to 2.10 and 3 to 5 simulate the immune network model. Thus, the optimal antibodies (cluster centers) are generated on the basis of the strength of their antigenic affinity, during the generation of the new antibodies; antibodies are deleted in every group based on the principle of antibody suppression. The process of antibody optimization and antibody suppression are executed for a pre-defined number of iterations.
There are four tunable parameters for the proposed algorithm:
N : The number of Abs selected for cloning in step 2.2;
nc : The percentage of reselected Abs for step 2.6;
σd : The death rate, which defines the threshold to remove the low-affinity Abs after the reselection for step 2.7;
σ s : The suppression threshold for steps 2.9 and 4, which defines the threshold to eliminate redundant Ab s .
The algorithm is parameter-sensitive and these parameters have a significant influence on the quality of the result and the computational time. σs is the parameter which has the most prominent effect in controlling the network size. Based on its value, N and nc adjust the network size. σ d is responsible for eliminating the antibodies with low affinity for antigens and is useful only in the first iteration of the evolving process. A very low value of σ d cause very few antibodies to be generated. Increasing the value of n c , though results in more antibodies, but results in a decrease in the classification efficiency. However, the exact behavior of the remaining three parameters ( N , nc, σd) is dependent upon the input data set. Therefore, optimal values of the four parameters are to be chosen for best results. To evaluate the network convergence, different criteria, such as the following, can be used:
-
IV. Performance measures
In this section, we present performance measures used in this study for comparing the classifiers, viz., Classification Efficiency and ROC parameters.
-
A. Classification Efficiency
To classify and evaluate the performance based on individual, average and overall classification accuracy for a given data set, we use 3 unsupervised techniques namely – ALG1, ALG2 and the Hierarchical AIS algorithm (ALG3). Initially, the data set is used to arrive at the classification matrix which is of size n x n , where n is the number of classes. A typical entry q in the classification matrix shows how many samples belonging to class i have been classified into class j . For a perfect classifier, the classification matrix is diagonal. However due to misclassification we get off-diagonal elements. The individual efficiency of class i is defined for all j . The percentage classification % for class c is [39]:
H i =
qii
En j=1 qji
where q is the number of correctly classified samples and n is the number of samples for the class c in the data set. The global performance measures are the average ( n ) and overall ( % ) classification, which are defined as [39]:
1 nc
n =~Ъ- n i nc 1
1 nc n = n Z q-
where n is the total number of classes and n is the number of samples.
-
B. Rece ver Operat ng Character st cs (ROC)
ROC is calculated for satellite image classification in view of the terms like True Positive (TP), False Positive (FP), True Negative (TN) and False Negative (FN).
A True Positive (TP) is the classified sample is positive and the actual database sample is also positive. If the classified sample is negative and the actual database sample is positive, it is counted as a False Negative (FN). In True Negative (TN), the classified sample is negative and the actual database sample is also negative. If the classified sample is positive and the actual database sample is negative, it is counted as a False Positive (FP).
Some evaluating features introduced in [40], which can be derived from ROC parameters are:
-
1) False Positive Rate (FPR) : For a good classifier this will be close to zero.
From FIG. 1, it is observed that the cluster centers generated using K-means and SOM are same as the original number of clusters while Hierarchical AIS has generated 4 centers for it. The splitting of the data set is done with the help of steps 2 and 4 of the algorithm. The cluster centers generated are shown in TABLE I.
Table 1. Cluster Centers for Gaussian Mixture Data set
FPR =
FP
(FP + TN)
2) True Positive Rate (TPR) :For a good classifier this will be closer to one.
|
Algorithm |
Cluster Centers |
|
K-means |
(x,y)= {(7.9211, 1.3851);(1.5199, 2.6078)} |
|
SOM |
(x,y)= {(9.4063, 1.1408);(2.5833, 3.7889)} |
|
AIS |
(x,y)= {(1.7312, 3.5844);(2.102, -0.9646); (-0.0131,1.4993);(-1.7399,1.5779)} |
TPR =
TP
(TP + FN )
We plot a FPR vs. TPR graph to compare the classification abilities of the three algorithms, viz., ALG1, ALG2 and ALG3. The FPR and TPR are calculated for each class with all three methods and are plotted together. The ideal classification would show all the points to be at (0, 1). Better classification shows positions close to (0,1) on the plot.
-
V. Motivational eample
We illustrate how the proposed algorithm (ALG3) is used for clustering with the following synthetic data and then later discuss about the satellite image. Although the proposed algorithm can be used for any type of mixture model, we focus on a Gaussian mixture. The results are then compared with K-means algorithm (ALG1) and SOM (ALG2).
Let us consider two Gaussian mixtures that have two input features, namely x1 and x2 . Here, mean F = [6,1] T and F = [3,3] T co-variance matrix (x,y)={(6,2);(2,1)} and each class having equal number of samples. In our study, 500 samples are generated randomly for each class, as shown in Fig. 1.
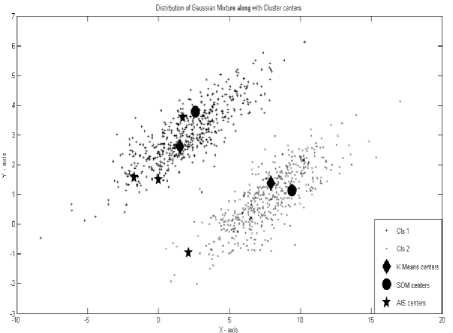
Fig. 1. Distribution of Gaussian Mixture along with cluster centers
The above cluster centers are used for merging with K-means clustering algorithm (step 6 and step 7 of the algorithm). To classify the data points, the voting method is used (steps 8-10 of the algorithm). For the grouped data set, we evaluate the performance using Eqs. 9-11. The parameter values for ALG2 are a0 = 0.07, a = 0.7 x a_ iand for ALG3 ( os,o d ,N,n c ) are (0.95,400,2,0.2). The classification efficiency of this hierarchical artificial immune system is better than k-means and SOM (TABLE II). Thus, this algorithm generates clusters in an efficient manner.
Table 2. Classification efficiency for Gaussian mixture
|
Classification Efficiency |
K-means |
SOM |
Hierarchical AIS |
|
П 1 (%) |
83.6 |
89.6 |
99.8 |
|
П 2 (%) |
79 |
92 |
100 |
|
П а (%) |
81.3 |
90.8 |
99.9 |
|
П о (%) |
81.3 |
90.8 |
99.9 |
-
VI. Results and Discussions
In this section, we present the results obtained for multi-spectral satellite image classification problem.
-
A. Satellite image acquisition
In our study, we consider one multi-spectral QuickBird image containing 6 classes, of a region around Mysore district, Karnataka India. It is a densely cultivated set-up and the basic crop coverage classes are present. QuickBird’s (operated by Digital Globe) multi-spectral (MSS) image with the resolution of 2.4 m has been used as inputs.
The high resolution image used is a four-band multi spectral image of the southern part of India. A level one classification was carried out by dividing the image into six crop classes (sugarcane, ragi, paddy, mulberry, groundnut and mango). The reference data was prepared by surveying the considered area and demarcating it based on the crops cultivated. After completing this process, the high resolution image and reference data were overlaid one over the other using the tool Erdas Imagine 8.5®. From this superimposed image the crop classes for training and validation are randomly selected. The list of crop classes and reference data for training and validation obtained from the above method are given in TABLE III.
-
B. Comparison of clustering methods
The classification results in terms of the classification matrix [41] by ALG1 have been tabulated in TABLE IV. We can observe from the classification matrix (TABLE IV) that classes C1 , C2 and C5 have been well classified; C3 has been strongly misclassified, while C4 and C6 have been correctly classified to an extent. As a consequence, the overall efficiency is 57.9%. The values of the parameters ( a , a ) of ALG2 used in this study are (0.01,0.1 x a ;_i) . The classification results by ALG2 have been tabulated in TABLE V. As we can see, even though this algorithm performs excellently for well-defined clusters; however, its performance is poor when the clusters overlap, as in case of C 1 and C 6 . This, however, is better than the ALG1 and the resulting overall efficiency is 86.9%.
The values of the parameters ( σ s ,σ d ,N,n c ), as mentioned in Section III, used in this study are (0.8,1500,1,0.3). The classification matrix for ALG3 is shown in TABLE VI. From TABLE VI, we can observe that ALG3 has classified C1 and C6 in a better way compared to the other two algorithms, though there is a scope for improvement in classifying C6 . ALG3 achieves an overall efficiency of 92.5%.
Table 3. Multispectral quickbird data description
|
Class no. |
Class name |
Pixels for clustering & classification |
|
C 1 |
Sugarcane |
500 |
|
C 2 |
Ragi |
500 |
|
C 3 |
Paddy |
500 |
|
C 4 |
Mulberry |
500 |
|
C 5 |
Groundnut |
500 |
|
C 6 |
Mango |
500 |
|
Total |
3000 |
|
Table 4. Classification Matrix for ALG1
|
Class no |
C 1 |
C 2 |
C 3 |
C 4 |
C 5 |
C 6 |
η i (%) |
|
C 1 |
432 |
0 |
68 |
0 |
0 |
0 |
86.4 |
|
C 2 |
0 |
500 |
0 |
0 |
0 |
0 |
100 |
|
C 3 |
0 |
500 |
0 |
0 |
0 |
0 |
0 |
|
C 4 |
0 |
0 |
0 |
305 |
0 |
195 |
61 |
|
C 5 |
0 |
0 |
0 |
0 |
500 |
0 |
100 |
|
C 6 |
400 |
0 |
197 |
0 |
0 |
2 |
0.4 |
|
η a (%) |
57.9 |
||||||
|
η o (%) |
57.9 |
||||||
Table 5. Classification Matrix for ALG2
|
Class no. |
C 1 |
C 2 |
C 3 |
C 4 |
C 5 |
C 6 |
η i (%) |
|
C 1 |
400 |
0 |
0 |
0 |
0 |
100 |
80 |
|
C 2 |
0 |
499 |
1 |
0 |
0 |
0 |
99.8 |
|
C 3 |
0 |
1 |
499 |
0 |
0 |
0 |
99.8 |
|
C 4 |
1 |
0 |
0 |
499 |
0 |
0 |
99.8 |
|
C 5 |
0 |
0 |
0 |
0 |
500 |
0 |
100 |
|
C 6 |
289 |
0 |
0 |
0 |
0 |
211 |
42.2 |
|
η a (%) |
86.9 |
||||||
|
ηo (%) |
86.9 |
||||||
The ROC graph has been plotted for all the three algorithms and is shown in FIG. 2. ALG1 shows large misclassification errors in C1 , C3 , C4 and C6 . This is clearly shown as the corresponding points are far away from the y-axis. ALG2 has points closer to the y-axis in comparison to the corresponding points from C1 . However, it performs badly for C1 and C6 . On the other hand, ALG3 shows very low misclassification error. Hence, all the points are either on the y-axis or very close to it.
Table 6. Classification Matrix for ALG3
|
Class no. |
C 1 |
C 2 |
C 3 |
C 4 |
C 5 |
C 6 |
η i (%) |
|
C 1 |
460 |
0 |
0 |
0 |
0 |
40 |
92 |
|
C 2 |
0 |
466 |
34 |
0 |
0 |
0 |
93.2 |
|
C 3 |
0 |
0 |
496 |
0 |
4 |
0 |
99.2 |
|
C 4 |
0 |
0 |
0 |
489 |
0 |
11 |
97.8 |
|
C 5 |
0 |
0 |
0 |
0 |
500 |
0 |
100 |
|
C 6 |
112 |
0 |
0 |
25 |
0 |
363 |
72.6 |
|
η a (%) |
92.5 |
||||||
|
η o (%) |
92.5 |
||||||
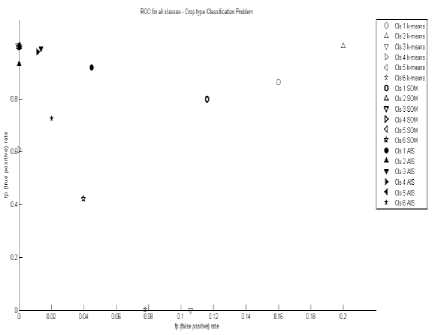
Fig. 2. ROC for all classes-Crop Type Classification Problem
-
VII. conclusion
In this paper, we present a hierarchical clustering algorithm (ALG3) for crop type classification problem. It uses a combination of non-parametric method and parametric method for splitting and merging. It adopts the AIS for splitting and k-means algorithm for merging data set. A Quick Bird multi-spectral image is used to demonstrate its performance. From the results obtained, we conclude that the proposed hierarchical clustering algorithm is more accurate and robust.
Acknowledgements
We would like to thank the anonymous reviewers for their comments and suggestions. Also, we are grateful to S.N.Omkar, and V.Mani for many useful and stimulating discussions regarding image clustering for remote sensing. Finally, we are indebted to D.R. Raghuram from IISc, Bangalore for proof reading this paper and H. Honne Gowda from KSTA, Bangalore, India, for providing the satellite image.
References Crop Type Classification Based on Clonal Selection Algorithm for High Resolution Satellite Image
- Panigrahy, S., Sharma, S.A. Mapping of crop rotation using multidate Indian Remote Sensing satellite digital data. Journal of Photogrammetry and Remote Sensing. 52(2), pp. 85-91, 1997.
- Li, F., Tian, G. Research on Remote sensing- Meteorological model for wheat yield estimation. GISdevelopment.net, AARS, ACRS, 1991.
- Omkar, S.N., Senthilnath, J., Mudigere, D., Kumar, M.M. Crop classification using biologically inspired techniques and high resolution satellite image. Journal of Indian Society for Remote Sensing. 36, pp. 175-182, 2008.
- Omkar, S.N., Sivaranjani, V., Senthilnath, J., Suman, M. Dimensionality Reduction and Classification of Hyperspectral Data. 2(3), pp. 157-163. 2010.
- Foody, G.M., Curran, P.J., Groom, G.B., Munro, D.C. Crop Classification with Multi-Temporal X-Band SAR data. Proceeding of IGARSS ’88 Symposium, Edinburgh, Scotland, 1988.
- Schowengerdt, R.A., Remote Sensing: Models and Methods for Image Processing. 2nd ed. Academic Press, San Diego, CA, 1997.
- Lu, D., Weng, O. A survey of image classification methods and techniques for improving classification performance. International Journal of Remote Sensing. 28(5), pp. 823-827, 2007.
- Yoshida, T., Omatu S. Neural network approach to land cover mapping. IEEE Trans. Geosci. Remote Sens. 32(5), pp. 1103-1108, 1994.
- Foody, G.M., Mathur, A. A relative evaluation of multiclass image classification of support vector machines. IEEE Trans. Geosci. Remote Sens. 42(6), pp. 1335-1343, 2004.
- Rajan, N., Stephan, J.M. Mapping ground cover using airborne multispectral digital imagery. Precision Agriculture. Springer. 10(4), pp. 304-318, 2009.
- Chenghai, Y., James H.E., Dale, M. Evaluating high resolution SPOT 5 satellite imagery for crop identification. Computers and Electronics in Agriculture. 75(2), pp. 347-354, 2011.
- Goel, P.K., Prasher, S.O., Patel, R.M., Landry, J.M., Bonnell, R.B., Viau, A.A., Classification of Hyperspectral Data by Decision Trees and Artificial Neural Networks to Identify Weed Stress and Nitrogen Status of Corn. Computers and Electronics in Agriculture, 39, pp. 67-93, 2003.
- Maulik, U., Bandyopadhyay, S., Pakhira, M.K. Clustering using annealing evolution: Application to pixel classification of satellite images. 3rd Indian Conference on Computer Vision, Graphics and Image Processing, Online ICVGIP -2002 Proceedings. 2002.
- Turner, D., Gower, S., Cohen, W.B., Gregory, M., Maiersperger, T. Effects of spatial variability in light use efficiency on satellite-based NPP monitoring. Remote Sensing of Environment 80, pp. 397-405, 2002.
- Everitt, J.H., Yang, C., Fletcher R.S., Drawe, D.L. Evalutaion of high resolution satellite imagery for assessing rangeland resources in South Texas. Rangeland Ecol. Manag., pp. 30-37, 2006.
- Ersahin, K., Scheuchl, B., Cumming, I. Incorporating texture information into polarimetric radar classification using neural networks. In IEEE International Geoscience and Remote Sensing Symposium, IGARSS ’04, 2004.
- Senthilnath, J., Omkar, S.N., Mani, V., Tejovanth, N., Diwakar, P.G., Archana, S.B. Multi-Spectral Satellite Image Classification using Glowworm Swarm Optimization. Proceeding of IEEE International Geoscience and Remote Sensing Symposium (IGARSS'11), Vancouver, Canada, 2011.
- Senthilnath, J., Omkar, S.N., Mani, V., Nitin, K. Hierarchical artificial immune system for crop stage classification. Proceeding IEEE INDICON'11, Hyderabad, India, 2011.
- Hartigan, J.A., Wong, M.A. A k-means Clustering Algorithm. Applied Statistics,1979.
- Kohonen, T. Self-Organizing Maps, Springer Series in Information Sciences, vol 30, Berlin. 1995.
- Vesanto, J., Alhoniemi, E. Clustering of the Self Organizing Map. IEEE Trans. Neural Networks, 11, pp 586-600, 2000.
- Fort, J.C., Letremy, P., Cottrell, M. Advantages and drawbacks of the Batch Kohonen algorithm, in ESANN’2002, M. Verleysen (ed.), D Facto, pp. 223-230, 2002.
- Senthilnath, J., Vipul, D., Omkar, S.N., Mani, V. Clustering using Levy Flight Cuckoo Search. Proceedings of Seventh International Conference on Bio-Inspired Computing: Theories and Application (Eds. J.C. Bansal et al.). Advances in Intelligent Systems and Computing, Springer India. 202, pp. 65 – 75, 2013.
- Cao, Y., Dasgupta, D. An Immunogenic Approach in Chemical Spectrum Recognition In Advances in Evolutionary Computing. Springer-Verlag, 2003.
- Knight, T., Timmis, J. A multi-Layered Immune Inspired Approach to Data Mining. Proceedings of the 4th International Conference on Recent Advances in Soft Computing, 2002.
- Bradley, D., Tyrell, A. Immunotronics: Hardware fault tolerance inspired by the immune system in Proceedings of the 3rd International Conference on Evaluable Systems (ICES2000), 1801, Springer-verlag Inc., 2000.
- Senthilnath, J., Omkar, S.N., Mani, V., Nitin, K., Shreyas, P.B. Crop Stage Classification of Hyperspectral Data using Unsupervised Techniques. IEEE Journal of Selected Topics in Applied Earth Observations and Remote Sensing (IJSTARS), 6(2), pp. 861 - 866, 2013.
- Yanfei, Z., Liangpei, Z., Bo H., Pingxiang, L. An Unsupervised Artificial Immune Classifier for Multi/Hyperspectral Remote Sensing Imagery. IEEE Transactions On Geoscience And Remote Sensing, 44(2), pp. 420-431, 2006.
- Tao, L., Yan, Z., Zhifeng, H., Zhijie, W. A New Clustering Algorithm Based on Artificial Immune System. Fifth International Conference on Fuzzy Systems and Knowledge Discovery, pp. 347 – 351, 2008.
- Yanfei, Z., Liangpei Z., Pingxiang, L., Huanfeng, S. A Sub-Pixel Mapping Algorithm Based On Artificial Immune Systems for Remote Sensing Imagery. Geoscience and Remote Sensing Symposium, IEEE International, 2009.
- Yundong, W.U., Geng, L. Research on Computation Model and Key Parameters of AIRS Supervised Classification in Remote Sensing Images. International Conference on Environmental Science and Information Application Technology, 2009.
- MacQueen, J. Some methods for classification and analysis of multivariate observations,” in Proc. 5th Berkeley Symp. pp. 281–297, 1967.
- Sap, M.N.M., Mohebi, E. Hybrid self-organizing map for overlapping clusters. International Journal for Signal Processing, Image Processing and Pattern Recognition (IJSIP), 1(1), pp. 11-20, 2008.
- Erik, B., Joaquin, S. The Parameter-Less SOM Algorithm. In ANZIIS 2003, pp. 159-164. 2003
- Timmis, J. Artificial immune systems: A novel data analysis technique inspired by the immune network theory. PhD thesis, 2000.
- Sutton, R.S., Barto, A.G. Reinforcement Learning an Introduction’’, A Bradford Book, 1998.
- Jeme, N.K. Towards a Network Theory of the Immune System. Ann. Itnmunol. (Inst. Pasteur), pp. 373-389, 1974.
- Castro, D.E., Von, Z. Artificial Immune Systems: Part I-Basic Theory and Applications. Technical Report-RT DCA 01/99, URL:http://www.dca.fee.unicamp.br/ lnunes.
- Suresh, S., Sundararajan, N., Saratchandran, P.A. Sequential Multi-Category Classifier using Radial Basis Function Networks. Neurocomputing. 71(7-9), pp.1345-1358, 2008.
- Fawcett, T. Roc Graphs: Notes and Practical Considerations for Researchers, Technical Report HPL-2003-4, HP Labs, 2006.
- Ashoka, V., Omkar, S.N., Akhilesh, K., Devesh. Aerial Video Processing for Land Use and Land Cover Mapping. I.J. Image, Graphics and Signal Processing. 8, pp. 45-54, 2013.
