Crowd escape event detection via pooling features of optical flow for intelligent video surveillance systems

Author: Gajendra Singh, Arun Khosla, Rajiv Kapoor
Journal: International Journal of Image, Graphics and Signal Processing @ijigsp
Article in issue: 10 vol.11, 2019.
Free access
In this paper we propose a method for automatic detection of crowd escape behaviour. Motion features are extracted by optical flow using Lucas-Kanade derivative of Gaussian method (LKDoG) followed by robust probabilistic weighted feature pooling operation. Probabilistic feature polling chooses the most descriptive features in the sub-block and summarizes the joint representation of the selected features by Probabilistic Weighted Optical Flow Magnitude Histogram (PWOFMH) and Probabilistic Weighted Optical Flow Direction Histogram (PWOFDH). One class Extreme Learning Machine (OC-ELM) is used to train and test our proposed algorithm. The accuracy of our proposed method is evaluated on UMN, PETS 2009 and AVANUE datasets and correlations with the best in class techniques approves the upsides of our proposed method.
Crowd escape, Probabilistic weighted feature Probabilistic Weighted Optical Flow Magnitude Probabilistic Weighted Optical Flow Direction, One-Class ELM
Short address: https://sciup.org/15016090
IDR: 15016090 | DOI: 10.5815/ijigsp.2019.10.06
Text of the scientific article Crowd escape event detection via pooling features of optical flow for intelligent video surveillance systems
Published Online October 2019 in MECS
Video surveillance systems for indoor and outdoor environments, such as metro stations, intersection at roads, fun-fairs etc., where a large number of people gather, play vital role both in the assurance of safety conditions for the persons and managing the road transport. But the scientific challenge in crowd image analysis is to observe and analyze this huge amount of data generated by these cameras network, which may contain hundreds of cameras and monitors. Human interaction based surveillance systems are more prone to errors because abnormal events take place after a long period. In such situations human attention may wander and abnormal situation may be more challenging to get noted. So, to avoid such situations an automated system is needed that can analyze such huge amount of data and trigger alarm in abnormal events. Now a days, automation of surveillance systems is a major research area for researchers. The use of computer vision algorithms in surveillance systems, which can automatically detect adverse situations such as violence, accidents or defacement of public property etc., at an early stage will make these environments safer for public and issuing timely warning will minimize the loss of life and public property. Abnormal event detection framework consists of two components viz. feature extraction and pattern identification. Feature extraction is arrangement of low-level data into different primitives that describes the scene characteristics in a compact way. Feature extraction methods are mainly classified into two categories: object based and pixel based. Object based methods extract geo- spatial information of objects and one sort of methods are trajectory based [1, 2, 3], where anomalous events are detected based on object trajectory. These methods track each object in the scene and make model based on the object trajectory statistics of each object. Efficiency of these methods is mainly dependent on the extraction of objects. But there are too many objects in the scene and tracking of each object is difficult due to occlusion in crowed scene and it takes lot of time for tracking multiple objects [3]. On the other hand, pixel-based methods [4, 5] describe the scene by low level features. One such approach is based on flow of crowd which uses motion statistics of scene. In [4], abnormal event detection is carried out by modelling change in each pixel value and this method uses optical flow that models the crowd movement through motion statistics. Optical flow methods are capable of easily and accurately modeling densely crowded scenes. Feature extraction is followed by pattern identification for differentiation between normal and abnormal events. Pattern identification is broadly classified into supervised, semi-supervised and unsupervised techniques.
In this paper, a new anomaly detection framework is proposed for video surveillance systems using semi supervised learning process. For feature extraction optical flow is used. Feature vector consists of both magnitude and direction information about the objects in the scene. This is followed by robust pooling operation, which robustly describe even small change in movement or in direction and the distribution of activity is modelled by OC-ELM. Due to robust features and robust classifier our method works well in challenging conditions (e.g. camera shake and varying crowd density) with respect to other state of the art methods. Rest of the paper is organized as follows; Section 2 provides an overview of related work on abnormality detection in video surveillance systems. Section 3 gives an overview of proposed method. Sections 3 describes the process of robust feature extraction from the scene and feature modelling process for the detection of abnormal events from normal events. The performance results of our proposed method are described in Section 4. In section 5 finally the paper is concluded.
-
II. Related Work
Abnormal event detection is application specific task and depends on situation in the scene. One thing that is normal at some places, may not be normal at other places e.g. running at racing track is normal task while running in the mall or running at the railway track is abnormal situation. So abnormal event detection techniques generally learn from its environment, where they are being deployed. First thing in anomalous event detection is to abstract the features which can describe the scene statics i.e. low level features, high level features. After abstraction of features, event modelling or classification is done. Event modelling is formal way to designate and classify whether scene comprises an anomalous event or not. Event modeling techniques are generally classified into three categories: supervised, semi supervised and unsupervised techniques. The anomaly detection based on supervised technique requires the labeling of samples for both normal samples and abnormal samples to train the model. These methods are usually modelled for specific abnormal situation whose characteristics are previously defined, such as ’U’ turn detection in traffic surveillance scene [6, 7]. Semi supervised approaches require only normal samples for training and these approaches can be further categorized into two sub-approaches, rule-based and model-based. In rule-based approach, some rule are created according to the scene features [8, 9]. Samples not following a pre-defined rule would be classified/labelled as abnormal/irregular. Sparse coding [8], Online dictionary updating [10] and sparse combination learning [9] are widely rule-based methods. In [8], author proposed a method based on reconstruction cost criterion, if the reconstruction cost of a sample is high then the sample is labelled as abnormal sample. In [11, 12, 13], similarity-based methods were proposed, where abnormal score of a test data is measured by its similarity to the training sample. While model-based methods [2, 14] attempts to build a model only for normal scene data and calculate the probability of test sample from the model learned. Test sample which is similar to the learned data gives high probability and labelled as normal, while low probability test samples with respect to the train model will be considered as anomalous samples. The commonly used model-based techniques are Hidden Markov Model (HMM) [2, 15, 16] and Markov Random Field (MRF) model [14, 17], which are used in a wide variety of applications. Kim et al. [14] proposed a Space Time Markov Random Field (STMRF) approach illustrating distribution of regular motion behavior. Kratz et al. [2] proposed a model based on the local spatial and temporal motion behavior using distribution-based HMM. Andrade et al. [16] proposed a model-based grouping of video into different cluster using spectral clustering and trained the model for each cluster using Multiple Observation Hidden Markov Model (MOHMM). Mehran et al. [18] proposed Social Force Model (SFM) for detection and localization of abnormal behavior of crowd based on interaction forces. Adam et al. [19] presented a method for abnormal behavior detection by observing histogram statistics of optical flow for normal behavior at several fixed-location monitors. While Wu et al. [20] modelled chaotic invariants of Lagrangian particle trajectories for normal events to characterize crowded scene.
Cui et al. [21] proposed a model based on interaction energy potential function describing the action and spatial arrangement with the surroundings of normal objects changing over time, and events with abrupt fluctuations in functions are likely to be uncommon. M.H.Sharif et al. [22] proposed a method based on entropy of the spatiotemporal information of the interest points to measure randomness in video frame. Kwon et al. [23] proposed predefined energy model whose parameters reflect frequency, causality, and significance of events, which can be used for abnormal event detection. Xuxin Gu et.al [24] proposed a method for detection of abnormal event based on particle entropy which describes the distribution information of crowded scenes. The energy-based algorithms are generally sensitive to various parameters, and a particular energy function can perform well only for specific scenes. Unsupervised methods do not require normal or abnormal data samples in advance and abnormal event detection is done based on the fact that abnormalities are rare with respect to normal situation. Several proposed techniques categorize an event as anomalous if the distance between the test data point and the nearest cluster center is greater than the predefined threshold, that may be adaptive, or user specified. The Battacharyya distance is a commonly used for distance calculation [25]. In many techniques, threshold is not directly a distance measure. Goshorn et al. [26] used the number of fluctuations essential to cause the test data point to fit into a trained cluster. Each fluctuation is given a cost and if the total cost surpasses a predefined threshold, then the action/event is labelled as abnormal.
-
III. Proposed Algorithm
This section presents our anomaly detection framework for surveillance systems at crowded places. Our proposed algorithm is based on extraction of motion information and concrete representation of extracted features followed by machine learning for classifying normal/abnormal events. Block diagram of the proposed algorithm is shown in Fig 1.
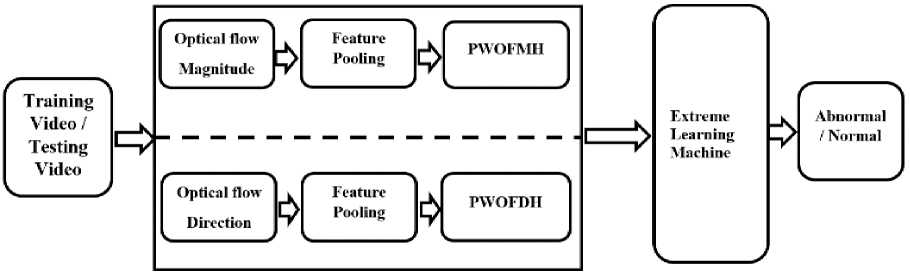
Fig.1. Block diagram of our proposed algorithm
-
A. Feature Extraction
When some abnormal event occurs in crowded area e.g. market, mall, playground etc., crowd disperse from that location speedily. So for such situations, information about motion of crowd plays crucial role for the detection of abnormal events. Motion information is extracted using optical flow that represents the apparent movement of objects, surface and edges due to relative movement between observer and objects. Optical flow magnitude and direction provides the information about the velocity and direction of movement of object(s) and motion information is described by Probabilistic Weighted Optical Flow Magnitude Histogram (PWOFMH) and Probabilistic Weighted Optical Flow Direction Histogram (PWOFDH). Probabilistic weights are obtained by pooling operation, which uses probability for finding weights. After feature extraction, feature vectors are fed into OC-ELM to learn model parameters for classification. After training, same process is followed for test frames to detect whether the given frames belong to normal or abnormal situation. Motion information for each frame of video is extracted by using Lucas-Kanade derivative of Gaussian method (LKDoG) [27] in the form of optical flow that estimates the speed and direction of object(s) in video. It assumes that the flow is essentially constant in a local neighborhood of the pixel under observation. To estimate the optical flow between two frames, the following optical flow constraint equation for all the pixels in that neighborhood is solved by the weighted least squares criterion.
Exu + Eyv + Et = 0 (1)
WhereEX, Ey and Et are image intensity derivatives in spatial as well as temporal dimension of a video and u, v are optical flow vector in horizontal and vertical directions respectively.
Before calculation of spatial derivatives and temporal derivatives ( Ex,Ey and Et) gaussian smoothing is performed and then derivative of gaussian filter are used for derivative calculation. To solve the optical flow constraint equation (1) for и and v, this method divides the original frame into small blocks and assumes a constant velocity in each block. Then, it performs a weighted least-square criterion of equation (1) for calculating [u v]T in each block. The method attains this by minimizing the following equation:
I k W 2 [Exu + Eyv + E t ] 2 (2)
Where к is kth block of original frame and W is a window function. Solution of the minimization problem is given as
■ IW 2 E 2
. !W 2 EyEx
IW2EXEJ rui _[ZW2ExEt IW2E2 J [vJ [zW2EyEt
After obtaining optical flow (u, v) using LKDoG [27], motion features (velocity magnitude and movement direction) at every pixel location of each frame can be calculated as
M(x, y, t) = J uX, y ,t + v2,y,t
D (x, y, t) = atan2 (^ ,2:£ ) ^ X.y.t
Where M (x, y, t) and D (x, y, t) are magnitude and direction of optical flow at (x,y) pixel location in tth frame of video respectively. Optical flow magnitude and direction matrix after extraction from each frame is divided into smaller sub blocks with 50 percent of overlapping. Strong feature points are pooled from each sub block form optical flow magnitude matrix and final feature vector of frame is concatenated vector of pooled features from optical flow magnitude and direction matrices as shown in Fig 2.
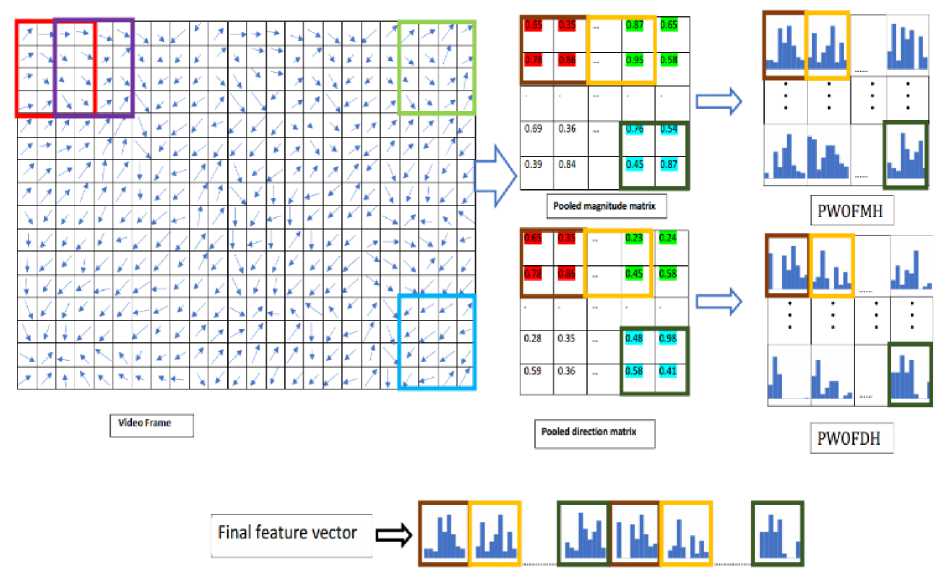
Fig.2. Illustration of Feature extraction for a video frame based on proposed algorithm
|
0.90 |
0.70 |
0.01 |
0.01 |
|
0.02 |
0.20 |
0.20 |
0.01 |
|
0.0 |
0.40 |
0.20 |
0.01 |
|
0.40 |
030 |
0.02 |
0.80 |
|
0.01 |
0.01 |
0.03 |
0.90 |
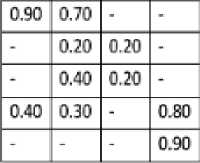
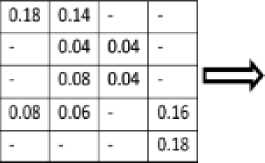

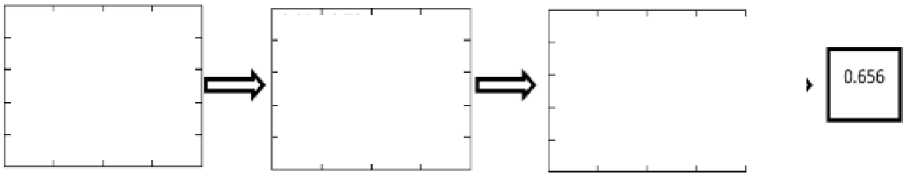
Fig.3. Illustration of Pooling Operation
Robust features are pooled from optical flow magnitude obtained by using rich and robust feature pooling (R2FP) method proposed by Xiong et.al [28]. Fig 3 illustrates the feature pooling process. For obtaining PWOFMH, optical flow magnitude matrix is first divided into K blocks and each block is further sub divided into c cells with 50 percent overlapping and magnitude value for each cell is firstly sorted in decreased order, the resulting vector for cth cell of Kth block is VKc £ R 1* N , where N is the number of pixels in the cell. After sorting, feature selection is done based on the fact that feature that are more indicative are retained, while less indicative features are discarded. So feature value close to zero contain less important information [28] so these values are discarded. This feature selection gives more concrete representation compared to raw features. Finally the selected features of cell are pooled according to Eq. (6) [28] given as:
f(Kc)=w ^c .VK c (6)
Where / (Kc) is pooled value of cth cell of Kth sub Block, wTKc is probabilistic weight matrix of cth cell of Kth sub-block and VKc raw optical flow magnitude vector of cth cell of Kth sub-block. After obtaining pooled value for each cell in a block, each block is represented by a histogram having 9 bins. The PWOFMH for a frame can be represented as Fmi = [M1,M 2 ...,MK] , where
M1, M2..., MK are pooled magnitude values for K number of block in ith frame of a video. Same procedure is followed for PWOFDH and represented as Fdi = [D1,D2..., DK], where D1,D2...,DK are pooled directional values from optical flow direction matrix for K number of blocks in ith frame. Final feature vector for ith frame of a video is concatenated histogram of PWOFMH and PWOFDH and can be represented as
Ft = [Fmi Fdi\. Final feature vector length for a frame will be equal to 2 * 9 * К * c. Number of blocks and number of cells within a block depends upon the frame size of a video, as in our case each standard dataset having different frame size e.g. UMN dataset having frame size of 320*240 pixels, PETS 2009 dataset having frame size of 728*576 and Avanue dataset having frame size of 640*360. Subsequently those features are fed to classifier to obtain prediction on frames whether the given frame presents normal or abnormal situation and this process is described in the section below.
-
B. Training And Classification
Features obtained as explained in the previous section, is fed to OC-ELM that tries to find the smallest training error as well as the smallest norm of output weights [29] between the output layer and the hidden layer. As per Bartlett’s theory [19], the network having smaller norm of weights, tends to have the better generalization performance. Thus, OC-ELM networks can give better generalization performance. In [17], equality constraints are used in ELM, which yields a unified solution for regression, binary, and multiclass classifications. For given N training samples (xt,yt), where i varies from 1 to N , X t = [xt1, ...xtn]T £ Rn is the individual n dimensional feature vector and y t £ Rk is the desired output. In case of one-class classification problem, single output node is required. The ELM output function can be given as
f(x) = Z ;=1 P ] G(W j , b j , X) (7)
where ( = [( 1 , ... (L]T is the weights vector connecting the output layer and the hidden layer, W j = [ wj1 ,... wjn ]T is the vector of input weights between input nodes and the jth hidden node, bj is the bias of the jth hidden node, and G(w, b, x) is the activation function (e.g., sigmoid function) satisfying ELM universal approximation capability theorems [20, 21]. Actually, G(w, b, x) is a nonlinear mapping function which maps the feature data X from the n -dimensional input space to the L-dimensional ELM feature space [17]. The objective of ELM is to minimize the training errors and the norm of output weights, which is equivalent to
m u.;.v 1 ( -f 1 v.\ (8)
L
-
s.t ^ PjG(wj, bj, x) = tt - ft; i = 1,2, ... N j=i
Where ft is the slack variable of the training sample Xt and C controls the tradeoff between the errors and the output weights. When only normal or target class data is available for training purpose, the one-class classifier is trained to accept normal class objects and discard objects that deviate significantly from the normal class. In the training phase, the one-class classifier, which defines a distance function d between the objects and the target class, takes in the training set X to build the classification model. In general, the classification model contains two important parameters to be determined: threshold 6 and modal parameter Л. A generic test sample z is accepted by the classifier if d(z|X,A) < 6.
The fundamental theory behind object recognition is that similar objects have to be close in the feature space and for similar objects, the target outputs should be the same:
tt = a; Vxt £ X (9)
Where a is class number (real number). All the training samples target outputs are set to the same value a. Then, the desired target output vector is T = [tl, t2,... tn]T = [a, a,... a]T. Training the samples from the target class can directly use the optimization function Eq. (8). For a new test sample z , the distance function between the sample object and the target class is defined as dELM(zlX,A) = |(jG(wj,bj,z) - a| (10)
Threshold decides whether a test sample z belongs to the target class or outlier. It is optimized to reject a small fraction of training samples to avoid overfitting. The distances of the training samples to the target class can be directly determined using Eq. (10) and the constraint of Eq. (8)
dE L M(x t lX,X) = lP j G(w j ,b j ,Xt)-al = lf t l (11)
From Eq. (11), larger the value of |f t | means the training sample xi is more deviant from the target class. Hence, threshold is derived based on θ, a quantile function to reject the most aberrant training samples. The sorted sequence of the distances of training samples are denoted by d = [dl, d2..., dN]. Here, dl represents the most deviant samples and dN represents the least deviant samples. The function determining θ can be given as
9 = d floor(ji,N) (12)
Where floor(k) returns the largest integer not greater than k. Then, we can get the decision function for z to the target class:
fElm(z) = Siyn(6 — dELM(z|X,A)) (13)
When fElm(z) = 1, z is classified as target otherwise labeled as outlier.
-
IV. Experiment Simulation and Result Analysis
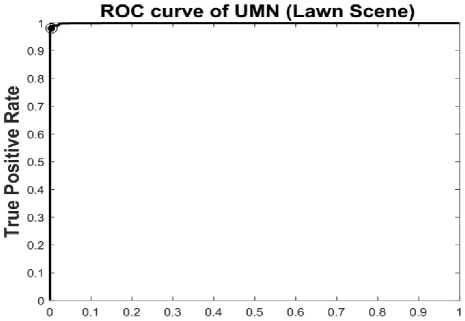
To demonstrate the effectiveness of our proposed algorithm, experiments were performed on three publicly available datasets: the UMN dataset [30], the PETS2009 dataset [31] and AVANUE dataset [32]. Our proposed method is compared against the state-of-the-art methods. The Receiver Operator Characteristics (ROC) plot and
Area Under the Curve (AUC) are being used as performance evaluation parameters. In a Receiver Operating Characteristic (ROC) curve is plotted between the true positive rate (Sensitivity) the false positive rate (100-Specificity) for different cut-off values. Each point on the ROC plot shows a sensitivity/specificity pair corresponding to a fixed threshold. A test with ideal segregation (no overlapping between two distributions) has a ROC curve that passes 100% sensitivity and 100 specificity.
The UMN dataset: The UMN dataset [30] were recorded by a stationary camera located at some elevation at three different locations (Lawn, Indoor, and Plaza). This dataset contains normal (walking) as well as abnormal behavior (running). Lawn scene contains total 1452 frames out of which 296 frames shows crowd escape behavior. Indoor scene and Plaza scene contains 4144 and 2142 frames respectively. The original resolution images are of 320 * 240 pixels. Some of the detected results of our proposed algorithm on UMN dataset (lawn scene) are shown in Fig 4, 5 and 6.
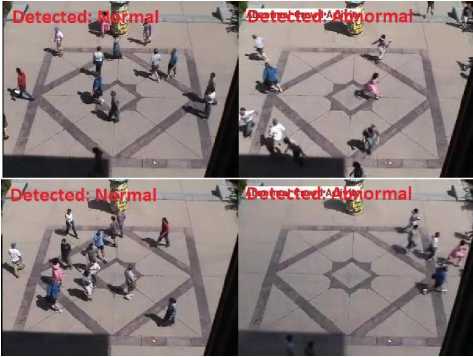
Fig.6. Detected results on UMN dataset (Plaza Scene)
Our proposed algorithm is compared with [4, 33] and [34], comparison results are given in Table 1. Our method achieve higher AUC value over state of the arts methods. ROC curve for all three different scenes are shown in Fig. 7, 8, 9.
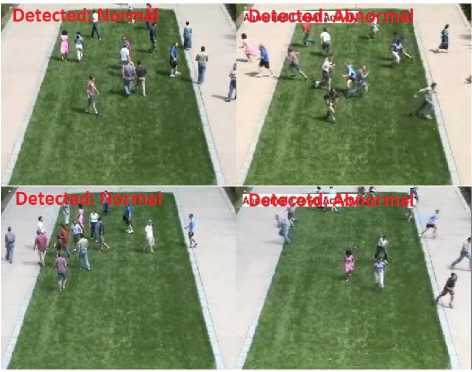
Fig.4. Detected results on UMN dataset (Lawn Scene)
Table 1. Comparison results of our proposed method with state-of-the-art methods (AUC performance of anomaly detection on the UMN dataset)
|
S.No |
Dataset |
HOFO [4] |
HOS [33] |
STCOG [34] |
PROPOSED METHOD |
|
1 |
Lawn Scene |
0.9845 |
0.9950 |
0.9362 |
0.9910 |
|
2 |
Indoor Scene |
0.9037 |
0.9330 |
0.7759 |
0.9859 |
|
3 |
Plaza Scene |
0.9815 |
0.9800 |
0.9661 |
0.9982 |
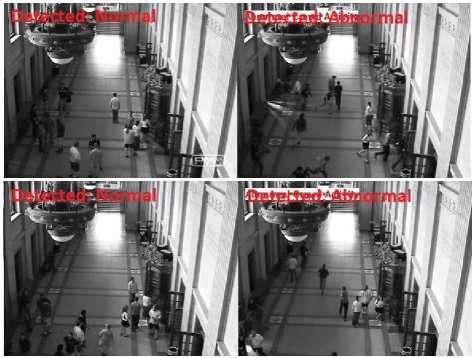
Fig.5. Detected results on UMN dataset (Indoor Scene)
False Positive Rate
Fig.7. ROC curve for UMN lawn scene
The Pets2009 Dataset: The PETS2009 datasets [31] contain three different sequences encompassing crowd situations with increasing complexity of scene. The resolution of the PETS2009 dataset images are 728 x 576 pixels. Dataset S0 contains training data. Dataset S1 is
mainly for person count and density estimation. Dataset S2 involves people tracking. Dataset S3 addresses crowd flow analysis and abnormal event detection. Some frames of PETS2009 dataset are shown in Fig 10.
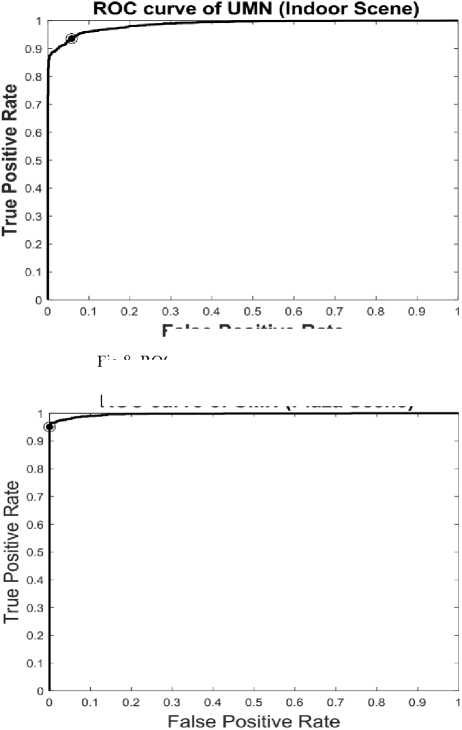
Fig.9. ROC curve for UMN Plaza scene
False Positive Rate
Fig.8. ROC curve for UMN Indoor scene
ROC curve of UMN (Plaza Scene)
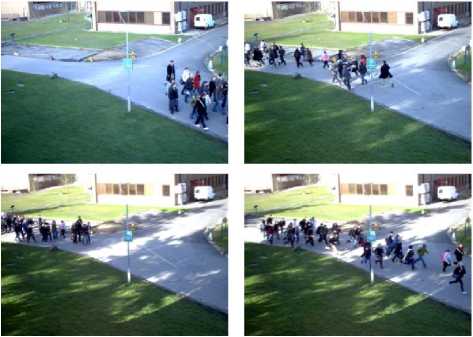
Fig.10. PETS2009 dataset :(left column: normal situation, right column: abnormal situation)
The experiments are performed on view 1 [31] for time sequence 14-17, 14-16, 14-06 and 14-55. The detection results on PETS2009 (time sequence 14-16) are shown in Fig 11. Where persons are running or walking from left to right or right to left direction. A normal situation corresponds to individuals walking at normal speed. While aberrant situation corresponds to the persons started running.
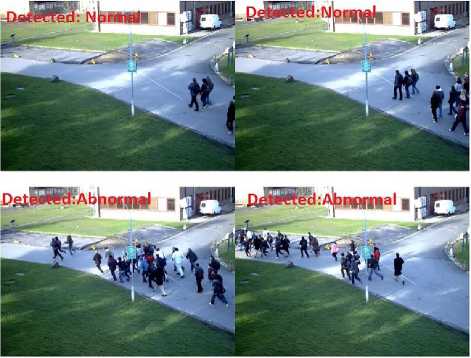
Fig.11. Detected results on PETS2009 (Time 14-16)
Classifier is trained only for normal situation where individuals are walking, training frames are chosen form time sequence 14-16 and 14-06. By our proposed method 95.27% detection accuracy is achieved. ROC curve for detection result on Time 14-16 is shown in Fig 12, AUC value for roc curve of time 14-16 is 0.9874.
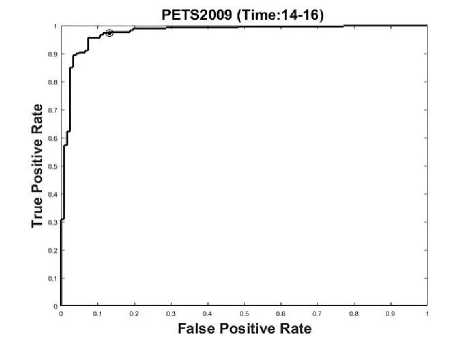
Fig.12. ROC curve for PETS2009 (Time 14-16)
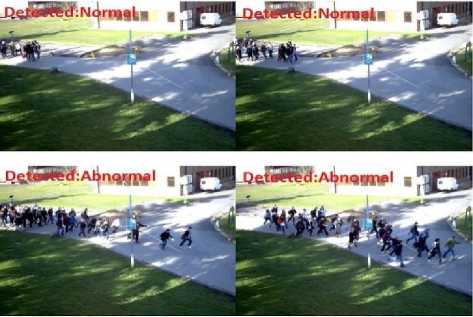
Fig.13. Detected results on PETS2009 (Time 14-17)
The detection result on PETS2009 (time sequence 1417) are shown in Fig 13, where walking is taken as normal situation and running is taken as abnormal situation. Detection accuracy for time 14-17 is 92.28% and AUC value is 0.9558. ROC curve is shown in Fig 14.

Fig.14. ROC curve for PETS2009 (Time 14-17)
The AVANUE dataset: The Avenue dataset [32] contains 16 training videos and 21 videos for testing, the videos include a total of 15183 frames for training and 15324 frames for testing. The resolution of video is 640*360. The training videos capture normal situations. Testing videos include both normal and abnormal events. This dataset contains abnormalities like running, wrong direction movement, jumping and throwing object. Some frames, where abnormalities are detected are shown in Fig 15.
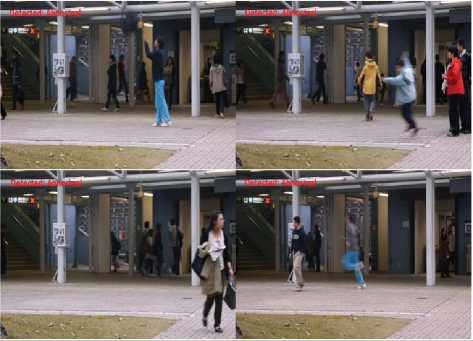
Fig.15. Detected results on AVANUE dataset
This dataset contains the challenges like minor camera shake (testing video 2, frame 1051- 1100) presents, a few outliers are included in training data and some normal patterns seldom appear in training data. ROC Curve of detection result on Avanue dataset are shown in Fig.16 and comparison result of our method with method presented [35] in Table 2.
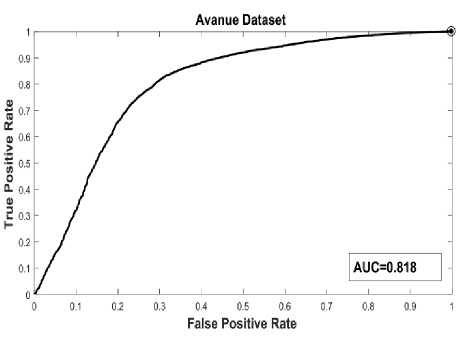
Fig.16. ROC curve for AVANUE dataset
Table 2. Comparison results of our Proposed method with state-of-the-art methods (AUC performance of anomaly detection on the AVANUE dataset)
|
S.No |
Method |
AUC |
Accuracy |
|
1 |
[36] |
0.809 |
- |
|
2 |
Proposed Method |
0.818 |
88.10 |
-
V. Conclusion
In this paper, an effective algorithm for crowd escape or stampede event detection based on crowd motion modelling is proposed. Crowd movement information is represented by movement direction and speed model is trained on One Class Extreme Learning Machine (OC-ELM), which outperform for anomaly detection. In this algorithm, pooling operation is used which gives sparse representation of features and reduces the computational load of machine learner. ROC curve and high value of AUC of our model on different datasets show good performance of proposed algorithm over state-of-the-art methods. High detection rate on UMN, PETS2009 datasets and AVANUE dataset demonstrate that our proposed algorithm can be used in challenging conditions specially in little bit noisy conditions. It’s effectiveness in challenging crowed scenes, make our method very suitable for a wide variety of video surveillance applications. Our proposed method achieve good accuracy over different crowd datasets, however our algorithm is not applicable for real time application because optical flow calculation of each frame consumes a lot of time of this algorithm. So some different approach to obtain motion information can be used in future to make this algorithm work in real time. So in future, some other addition information can also be utilize e.g. deep learning, shape information etc., to make this algorithm work more efficiently and effectively in more challenging conditions.
Acknowledgment
We would like to thanks unknown reviewers for their valuable suggestions. This research work is fully supported by Dr. B R Ambedkar National Institute of Technology, Jalandhar, Punjab, India.
References Crowd escape event detection via pooling features of optical flow for intelligent video surveillance systems
- M. Heikkila, M. Pietikainen, “A texture-based method for modeling the background and detecting moving objects” IEEE transactions on pattern analysis and machine intelligence 28 (4) (2006) 657–662.
- L. Kratz, K. Nishino,” Anomaly detection in extremely crowded scenes using spatio-temporal motion pattern models”, Computer Vision and Pattern Recognition, 2009. CVPR 2009. IEEE Conference on, IEEE, 2009, pp. 1446–1453.
- Y. Yuan, J. Fang, Q. Wang, “Online anomaly detection in crowd scenes via structure analysis”, IEEE Transactions on Cybernetics 45 (3) (2015) 548–561.
- T. Wang, H. Snoussi, “Detection of abnormal visual events via global optical flow orientation histogram”, IEEE Transactions on Information Forensics and Security 9 (6) (2014) 988–998.
- N. Dalal, B. Triggs, “Histograms of oriented gradients for human detection”, Computer Vision and Pattern Recognition, 2005. CVPR 2005. IEEE Computer Society Conference on, Vol. 1, (2005), pp. 886–893.
- G. Zen, E. Ricci, ‘Earth mover’s prototypes: A convex learning approach for discovering activity patterns in dynamic scenes”, Computer Vision and Pattern Recognition (CVPR), 2011 IEEE Conference on, IEEE, 2011, pp. 3225–3232.
- Z. Fu, W. Hu, T. Tan, “Similarity based vehicle trajectory clustering and anomaly detection”, Image Processing, 2005. ICIP 2005. IEEE International Conference, Vol. 2, IEEE, 2005, pp. II–602.
- Y. Cong, J. Yuan, J. Liu, “Sparse reconstruction cost for abnormal event detection”, Computer Vision and Pattern Recognition (CVPR), 2011 IEEE Conference on, IEEE, 2011, pp. 3449– 3456.
- C. Lu, J. Shi, J. Jia, “Abnormal event detection at 150 fps in matlab”, Proceedings of the IEEE International Conference on Computer Vision, 2013, pp. 2720–2727.
- B. Zhao, L. Fei-Fei, E. P. Xing, “Online detection of unusual events in videos via dynamic sparse coding”, Computer Vision and Pattern Recognition (CVPR), 2011 IEEE Conference on, IEEE, 2011, pp. 3313–3320.
- O. Boiman, M. Irani, “Detecting irregularities in images and in video”, Computer Vision, 2005. ICCV 2005. Tenth IEEE International Conference on, Vol. 1, IEEE, 2005, pp. 462–469.
- V. Saligrama, Z. Chen, “Video anomaly detection based on local statistical aggregates”, Computer Vision and Pattern Recognition (CVPR), 2012 IEEE Conference on, IEEE, 2012, pp. 2112– 2119.
- R. Hamid, A. Johnson, S. Batta, A. Bobick, C. Isbell, G. Coleman, “Detection and explanation of anomalous activities: Representing activities as bags of event n-grams”, Computer Vision and Pattern Recognition, 2005. CVPR 2005. IEEE Computer Society Conference on, Vol. 1, IEEE, 2005, pp. 1031–1038.
- J. Kim, K. Grauman, “Observe locally, infer globally: a space time mrf for detecting abnormal activities with incremental updates”, Computer Vision and Pattern Recognition, 2009. CVPR 2009. IEEE Conference on, IEEE, 2009, pp. 2921–2928.
- D. Zhang, D. Gatica-Perez, S. Bengio, I. “McCowan, Semisupervised adapted hmms for unusual event detection”, Computer Vision and Pattern Recognition, 2005. CVPR 2005. IEEE Computer Society Conference on, Vol. 1, 2005, pp. 611– 618.
- E. L. Andrade, S. Blunsden, R. B. Fisher, “Modelling crowd scenes for event detection”, Pattern Recognition, 2006. ICPR 2006. 18th International Conference on, Vol. 1, IEEE, 2006, pp. 175–178.
- Y. Benezeth, P.-M. Jodoin, V. Saligrama, C. Rosenberger, “Abnormal events detection based on spatio-temporal cooccurences”, Computer Vision and Pattern Recognition, 2009. CVPR 2009. IEEE Conference on, IEEE, 2009, pp. 2458–2465.
- R. Mehran, A. Oyama, M. Shah, “Abnormal crowd behavior detection using social force model”, Computer Vision and Pattern Recognition, 2009. CVPR 2009. IEEE Conference on, IEEE, 2009, pp. 935–942.
- A. Adam, E. Rivlin, I. Shimshoni, D. Reinitz, “Robust real-time unusual event detection using multiple fixed-location monitors”, IEEE transactions on pattern analysis and machine intelligence 30 (3) (2008) 555–560.
- S. Wu, B. E. Moore, M. Shah, “Chaotic invariants of lagrangian particle trajectories for anomaly detection in crowded scenes”, Computer Vision and Pattern Recognition (CVPR), 2010 IEEE Conference on, IEEE, 2010, pp. 2054–2060.
- X. Cui, Q. Liu, M. Gao, D. N. Metaxas, “Abnormal detection using interaction energy potentials”, Computer Vision and Pattern Recognition (CVPR), 2011 IEEE Conference on, IEEE, 2011, pp. 3161–3167.
- M. H. Sharif, C. Djeraba, “An entropy approach for abnormal activities detection in video streams”, Pattern recognition 45 (7) (2012) 2543–2561.
- J. Kwon, K. M. Lee, “A unified framework for event summarization and rare event detection from multiple views”, IEEE transactions on pattern analysis and machine intelligence 37 (9) (2015) 1737–1750.
- X. Gu, J. Cui, Q. Zhu, “Abnormal crowd behavior detection by using the particle entropy”, Optik-International Journal for Light and Electron Optics 125 (14) (2014) 3428–3433.
- M. H. Sharif, S. Uyaver, C. Djeraba, “Crowd behavior surveillance using bhattacharyya distance metric”, International Symposium Computational Modeling of Objects Represented in Images, Springer, 2010, pp. 311–323.
- R. Goshorn, D. Goshorn, J. Goshorn, L. Goshorn, “Abnormal behavior-detection using sequential syntactical classification in a network of clustered cameras”, Distributed Smart Cameras, 2008. ICDSC 2008. Second ACM/IEEE International Conference on, IEEE, 2008, pp. 1–10.
- J. L. Barron, D. J. Fleet, S. S. Beauchemin, T. Burkitt, “Performance of optical flow techniques”, Computer Vision and Pattern Recognition, 1992. Proceedings CVPR’92., 1992 IEEE Computer Society Conference on, IEEE, 1992, pp. 236–242.
- W. Xiong, L. Zhang, B. Du, D. Tao, “Combining local and global: Rich and robust feature pooling for visual recognition”, Pattern Recognition 62 (2017) 225–235.
- Q. Leng, H. Qi, J. Miao, W. Zhu, G. Su, “One-class classification with extreme learning machine”, Mathematical problems in engineering 2015.
- UMN, Unusual event datasets of university of minesota. URL http://mha.cs.umn.edu/Movies/Crowd-Activity-All.avi.
- PETS, Pets2009 benchmark dataset. URL http://cs.binghamton.edu/~mrldata/pets2009
- C. Lu, J. Shi, J. Jia, Abnormal event detection at 150 fps in matlab, in: Proceedings of the IEEE international conference on computer vision, 2013, pp. 2720–2727. URL http://www.cse.cuhk.edu.hk/leojia/projects/detect abnormal/dataset.html
- V. Kaltsa, A. Briassouli, I. Kompatsiaris, L. J. Hadjileontiadis, M. G. Strintzis, “Swarm intelligence for detecting interesting events in crowded environments”, IEEE transactions on image processing 24 (7) (2015) 2153–2166.
- Y. Shi, Y. Gao, R. Wang, “Real-time abnormal event detection in complicated scenes”, Pattern Recognition (ICPR), 2010 20th International Conference on, IEEE, 2010, pp. 3653–3656.
