Curvelet transform for efficient static texture classification and image fusion

Author: M.Venkata Ramana, E.Sreenivasa Reddy, Ch.Satayanarayana
Journal: International Journal of Image, Graphics and Signal Processing @ijigsp
Article in issue: 5 vol.10, 2018.
Free access
Wavelet Transform (WT) has widely been used in signal processing. WT breaks a signal into its wavelets that are scaled and shifted versions of given signal. Thus wavelets are able represent graphical objects. The irregular shape and compact support of wavelets made them ideal for analyzing non-stationary signals. They are useful in analysis in both temporal and frequency domains. In contract, the Fourier transform provides information in frequency domain lacking in information in time domain. Thus wavelets became popular for signal processing and image processing applications. Nevertheless, wavelets suffer from a drawback as they cannot effectively represent images at different angles and different scales. To overcome this problem, of late, Curvelet Transform (CT) came into existence. CT is nothing but the higher dimensional generalization of WT which can effectively represent images at different angles and different scales. In this paper we proposed a CT method that is used to represent textures and classify them. The methodology used in this paper has an underlying approach that exploits statistical features of curvelets that resulted in curvelet decomposition. We built a prototype application using MATLAB to demonstrate proof of the concept.
Wavelet transform, Fourier transform, Curvelet Transform, texture, texture classification
Short address: https://sciup.org/15015965
IDR: 15015965 | DOI: 10.5815/ijigsp.2018.05.07
Text of the scientific article Curvelet transform for efficient static texture classification and image fusion
Published Online May 2018 in MECS DOI: 10.5815/ijigsp.2018.05.07
The theory of Wavelets is widely used for image processing. With one dimension, wavelets are successful in providing good performance with respect to rendering piecewise smooth functions. Unfortunately wavelets are not good for two dimensions. Wavelets are good at capturing point or zero-dimensional singularities. In order to overcome the weakness of Wavelets with respect to two or more dimensions, Candes and Donoho built a new system of representations known as ridgelets. Ridgelets can effectively deal with line singularities in case of two-dimensions. There is possibility to map line singularity with point singularities. In such cases again wavelets play important role. Ridgelet transform is able to represent edges and other singularities efficiently when compared with wavelets. In many images processing applications, the images have edges that are curved. Ridgelets alone cannot handle this situation. To overcome this drawback Candes and Donoho introduced another multiscale transform known as Curvelet transform which can handle curve discontinuities efficiently
In this paper, curvelet transform is explored to have better representation of curved singularities and edges in order to have better quality in different applications. We considered two applications that are frequently used in image processing. The first application is texture classification which is widely used while the second one is image fusion which improves quality of an image. The texture classification generally has two phases. They are known as learning phase and classification phase. In the learning phase a model is built by using input texture images and performs processing to obtain feature vectors. These feature vectors are used when query texture is given as input for efficient classification. Image fusion on the other hand is used to have high quality of an image. Two images representing same scene or object captured in different light conditions can be combined in order to have high quality image.
The remainder of the paper is structured as follows. Section II presents review of literature. Section III provides details of curvelet transform. Section IV presents methodology and results of CT based texture classification. Section V presents CT based image fusion methodology and results. Section VI concludes the paper besides providing details of possible future work.
-
II. Related Works
This section provides review of related works. It throws light on the curvelet transforms, fast discrete curvelet transforms, continuous curvelet transforms, 3D discrete curvelet transforms and applications of curvelet transforms.
-
A. Curvelet Transforms
ZM|(W|2=llfH2L 2 (R2),vf £ l2(r2) (1)
It implies that the standard arguments can be reconstructed as in Equation (2)
f
=^
^
-
B. Fast Discrete Curvelet Transforms
Candes et al. [8] proposed two digital implementations of curvelet transforms known as fast discrete curvelet transforms. The first one was done based on Unequally-Spaced Fast Fourier Transforms (USFFT) while the second one is based on wrapping of Fourier samples that are specially selected. Both the curvelet transforms return a table containing digital curvelet coefficients. These curvlets are known as second generation curvlets. They also discussed about a software package known as CurveLab for demonstrating implementations of these curvelets.
-
C. Continuous Curvelet Transform
Candes & Donoho [2] presented continuous curvelet transform (CCT). It is a transform denoted as f ^ T j (a,b,6) of functions f(x1, x2) on R2 into a domain with orientation0E[O,2?r], locationb £ R2, and scale a>0. Finally the transform is defined as in Equation (3)
T f (a,b,9) = (r.Y abo) (3)
Where f projects inner products while Y ab9 represents curvelets. CCT is used when there are many objects containing singularities at different places such as smooth curves, lines and points. This CCT is close to the CCT used by Smith in the study of Fourier Integral Operators. Wavelet changes scale by scale is used in the CCT while Smith’s CCT was based on strict affine parabolic scaling pertaining to a single mother wavelet.
f”W(r')2 ^- =1 (4)
J 1 v(t)2 dt = 1 (5)
These windows are used in frequency domain in order to construct wave forms with sufficient complexity. Such waveforms have three parameters such as with scale, location and orientation denoted as a>0, b £ R2 , and 0е[О,2я] respectively.
-
D. 3D Discrete Curvelet Transform
Ying et al. [1] explored 3D curvelet transform for the first time. It is an extension to the 2D transform. The 3D curvelet frame has ability to preserve significant properties such as sparse representation, tightness, and probabilistic scaling. Different implementations of 3D curvelet transform were explored. They include out-ofcore implementation, in-core implementation and MPI based parallel implementation. Their empirical results revealed that with respect to desired properties, the implementations were proved efficient. The 3D curvelet transform takes a 3D Cartesian grid as input. The grid is in the form f(n 1 , n2, n3), 0 < n 1 , n2, n3< n. The output of the transform is a set of coefficients denoted as C D (j, I, k) . The coefficients are computed as in Equation (6).
C D (j, l, к):=Х1 г 1 Д 2 Д з f(n 1 , П 2 ,П з ) Ф^,^, П 2 , П з ) (6)
where j,l £ X and k= (k 1 ,k 2 ,k3).
-
E. Applications of Curvelets
ц(ш) = J ^е-1^2^)^^ (w1,w2) e 2ттЖ x 2тй
Chaki et al. [10] employed curvelets transforms in order to identify plat leafs by using shape and texture features. They modelled the same using a filter known as Gabor filter and grey scale co-occurrence matrix (GLCM). Dhahbii et al. [11] used curvelet moments for breast cancer diagnosis in the form of digitized mammograms. Dubois et al. [12] employed curvlelets for characterization of dynamic textures and recognizing them. Gorgel et al. [13] used curvelets for classification of breast cancer masses and compared with that of wavelet transform.
Karthik et al. [14] proposed a comprehensive framework for classification of brain tumour using curvelet transform and Support Vector Machine (SVM). They used both spatial and frequency domains for successful classification of given input brain tumour images. Local curvelet and Gober wavelet transforms are used by Xue et al. [15] for classification of hyperspectral data. Gornale [16] explored fingerprint-based gender classification and presented a review of curvelet transform methods used for different purposes. Razzak [17] proposed a method for automatic detection of malaria parasites. Forward Discrete Curvelet Transform (FDCT) is applied for pre-processing of blood cell image. It was able to capture singularities but it has high directional sensitivity.
Waitovski and Bolcskei [18] proposed a method based on deep convolution neural networks. Upon this, they made a mathematical theory for feature extraction. Their theory is based on semi-discrete frames including curvlets. Mohana and Prabhakar [19] explored a novel technique for grading date fruits based on extracted local binary pattern (LBP) and curvelet transform. They built three classifiers namely k-Nearest Neighbour (kNN), SVM and linear discriminant. Venkataramana et al. [20] made a review of various texture classification methods including curvelet transforms.
-
III. Curvelet Transform
Candes and Dohono introduced a novel transform known as curvelet transform. CT can represent edges and singularities along curves better than conventional transforms. It also used fewer coefficients to achieve this. A pair of windows named W(r) and V(t) can be defined in continuous transform. The former is known as radial window while the latter is known as angular window. They are associated with equations (8) and (9) respectively.
V. 'W (2 - r) = 1 re[3,3] (8)
XT=-«V2(t-I) = 1 te[-|,|] (9)
W and V support a polar wedge which is represented as U j which is computed as follows.
Uj(r,9) = ^( j/4)W(2.-]'r)V
^Z
2я
Curvlet transform can be defined as follows.
Implementation of curvelet transform needs different activities such as decomposition of sub-band, smooth partitioning, renormalization and ridgelet analysis. The following section provides usage of curvelet transform for texture classification.
-
IV. Methodology and Results of Ct Based Texture Classification
This section provides methodology for texture classification using curvelet transform. Input texture images are subjected to discrete curvelet transform which results in having a database of global feature vectors. This activity is taken place as part of learning phase. The result of learning phase is to have a database with global feature vectors representing all textures in the database. The classification phase takes query texture image as input and applies discrete curvelet transform for obtaining features. Such features are compared with the features found in the database in order to perform classification.
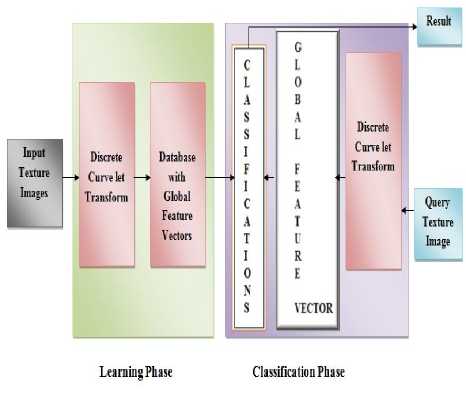
Fig.1. Methodology for texture classification
As shown in Fig. 1, it is evident that the classification phase is preceded by learning phase. After giving query texture image, it is important to find out similarity before making decision on texture classification. The similarity is computed using three factors as shown in Equation (12)
df = (df * df * dfD) (12)
The three factors are elaborated in Equation (2). These factors are used to have a similarity measure.
= 1^— 15 ^ 227 dJ o vs (,J 2 ,
^ m^i V^ m )
df =^m=№2,dfD = Z^=i(d^)2, Z^=1(d")2 ^m=iV°m)
The above similarity measure is used to find the similarity between query input texture image and the texture images in database. This can help in making classification decisions.
-
A. Datasets Used for CT Based Texture Classification
Three different datasets are used for experiments with respect to texture classification. Dataset 1 is obtained from [22]. It is known as VisTex dataset which contains 20 texture images. Dataset 2 and Dataset 3 are obtained from [23]. These datasets are known as Brodatz’s texture databases. Dataset 2 contains 25 texture images while dataset 3 contains 112 texture images.
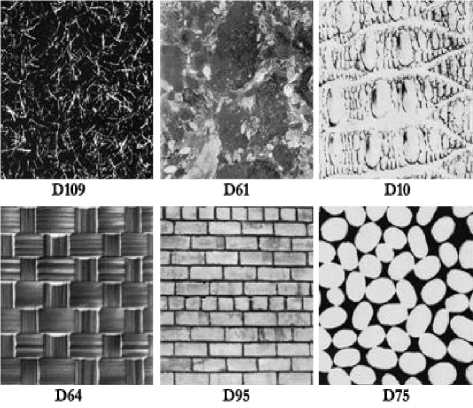
Fig.2. Some of the images from original Brodatz’s texture database
As shown in Fig. 2, it is evident that some of the images are presented. These images do have different intensities. For instance D109 has background in black while other two images on the same row contain grey and white backgrounds respectively. This kind of different in intensities can help in accurate classification of images using curvelet transform.
-
B. Results of CT based Texture Classification
The results of texture classification with 3 different datasets are captured in terms of number of image regions correctly classified and mean success arête for Curvlet Statistical Features (CSF) and compared with that of Ridgelet Statistical Features (RSF) and Wavelet Statistical Features (WSF).
Table 1. Results of Dataset 1
|
CSF |
RSF |
WSF |
|
|
Number Of Image Regions Correctly Classified |
319 |
316 |
295 |
|
Mean Success Rate(%) |
99.7 |
98.8 |
92.2 |
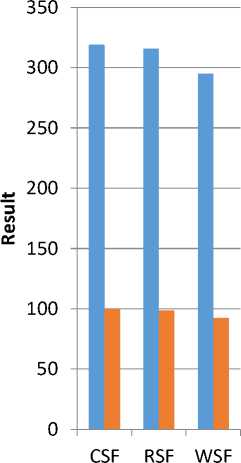
As shown in Table 1, it is evident that the results of CSF, RSF and WSF are presented in terms of mean success rate and number of image regions correctly classified for dataset 1.
Number Of Image Regions Correctly Classified
Mean Success Rate(%)
Fig.3. Texture classification results of dataset 1
As shown in Fig. 3, the results reveal the performance of CSF compared with RSF and WSF in terms of mean square error and number of image regions correctly classified. These results are captured with texture classification with dataset 1.
Table 2. Results of Dataset 2
|
CSF |
RSF |
WSF |
|
|
Number Of Image Regions Correctly Classified |
400 |
386 |
355 |
|
Mean Success Rate(%) |
100 |
96.5 |
88.8 |
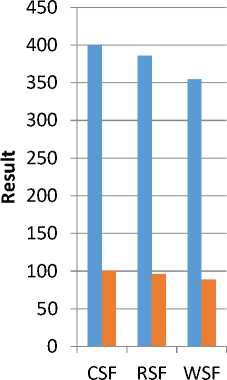
As shown in Table 2, it is evident that the results of CSF, RSF and WSF are presented in terms of mean success rate and number of image regions correctly classified for dataset 2.
Number Of Image Regions Correctly Classified
Mean Success Rate(%)
-
Fig.4. Texture classification results of dataset 2
As shown in Fig. 4, the results reveal the performance of CSF compared with RSF and WSF in terms of mean square error and number of image regions correctly classified. These results are captured with texture classification with dataset 2.
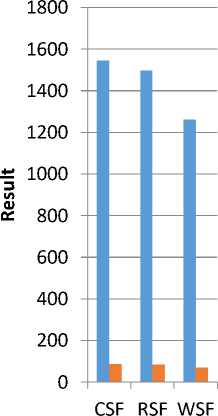
Table 3. Results of Dataset 3
|
CSF |
RSF |
WSF |
|
|
Number Of Image Regions Correctly Classified |
1546 |
1498 |
1261 |
|
Mean Success Rate (%) |
87.1 |
84.3 |
71.0 |
As shown in Table 3, it is evident that the results of CSF, RSF and WSF are presented in terms of mean success rate and number of image regions correctly classified for dataset 3.
Number Of Image Regions Correctly Classified
Mean Success Rate(%)
As shown in Fig. 5, the results reveal the performance of CSF compared with RSF and WSF in terms of mean square error and number of image regions correctly classified. These results are captured with texture classification with dataset 3.
-
V. Methodology and Results of Ct Based Image Fusion
-
2. 2^ 2, M C ] (k^ + i,k2 + ;)]/ (14)
Image fusion is another important utility in image processing. Different techniques came into existence for this purpose. However, usage of curvelets for image fusion is the novel concept. There are three levels in which fusion can be made. They are known as pixel level, feature level and choice level. In this paper pixel level fusion is considered. Geometry of peculiarity is overlooked in Wavelet transform while curvelet transform considers it. In contrast to Wavelet, curvelet has support for point directivity.
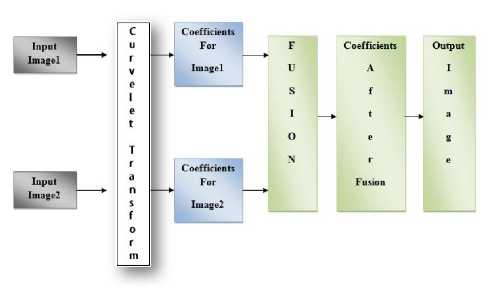
Fig.6. Methodology for curvelet based image fusion
As shown in Fig. 6, it is evident that the two input images are provided to CT. These images are having different blur problems that need to be overcome with the fusion concept. The CT generates coefficients representing image 1 and image 2 separately. Then the coefficients are subjected to fusion. The result of fusion is coefficients that are combined. Then finally the output image is obtained with good quality. The fusion standard employed is shown in Equation (14)
E^k^) =
(N1-1) (M1-1)
-
1 2 "* 2
The sub-blocks of input image are subjected to local area variance computation using Equation (15).
STD
J (N1-1) (M1-1)
Z. 2(N 1) Z 2(_M 1) [C j,i (k 1 +i,k 2 +])-C] 0 (k 1, k 2' )\2
l=- 2 i=— 2
N2xM2
Fig.5. Texture classification results of dataset 3
Once variance is computed, it is used further. If it is bigger, it reflects bigger local contrast of original image. This is expressed as in Equation (16).
F (C^k^STB^STB8
jo V i , 2 ) { cf 0 (k 1 ,k 2 ),STB A < STB B
The regional activity denoted as Ej,1(K1, K2) is considered as fusion standard as shown in Equation (14).
A. Metrics Used for Evaluating CT Based Image Fusion
Different metrics used for evaluating the CT based image fusion are Mean Square Error (MSE), Average Difference (AD), Structural Content (SC), Normalized Cross Correlation (NK), Maximum Difference (MD), Laplacian Mean Square Error (LMSE), Normalized
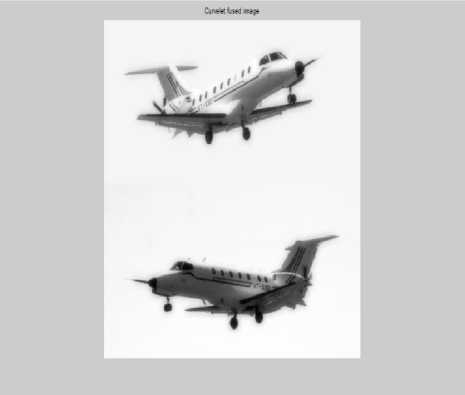
Fig.7. Result of CT based image fusion
Absolute Error (NAE), Structural Similarity (SSIM), and Peak Signal to Noise Ratio (PSNR).
Mean Square Error
Index
MSE=^№ =0 (A ij -Bu)2
Peak Signal to Noise Ratio
PSNR^Oxlog^(18)
PSNR = 10xloglo^(19)
Average Difference
АВ = ^тмиАи — ви)(20)
Table 4. Shows evaluation metrics and results
|
EVALUATION METRIC |
RESULT |
|
Mean Square Error |
0.0000002 |
|
Average Difference |
-0.0036372 |
|
Structural Content |
0.2541602 |
|
Normalized Cross Correlation |
1.9462482 |
|
Maximum Difference |
0.0039222 |
|
Laplacian Mean Square Error |
3.4924872 |
|
Normalized Absolute Error |
1.0415042 |
|
Structural similarity Index |
0.9999982 |
|
Peak Signal to Noise Ratio |
96.5518732 |
Structural Similarity Index
SSIM =
(2^А^В+с1)(2^АВ+С2)
(Ц д +Ц д +С-^а д +а д +С г- )
As shown in Table 4, different evaluation metrics are used to know the quality of image fusion.
Normalized Absolute Error
NAE =^^=^^-^
Yi^j=o A i.J
B. Results of CT Based Image Fusion
The methodology for CT based image fusion is implemented by using a prototype application in MATLAB. A pair of images (of same scene or object) obtained with different lighting conditions can be combined to have a high quality image. This phenomenon is known as image fusion. Different pairs of images are subjected to CT based image fusion.
As shown in Fig. 7, it is evident that the CT based image fusion resulted in an output image which has higher quality than a pair of images showing same object/scene captured with different lighting conditions.
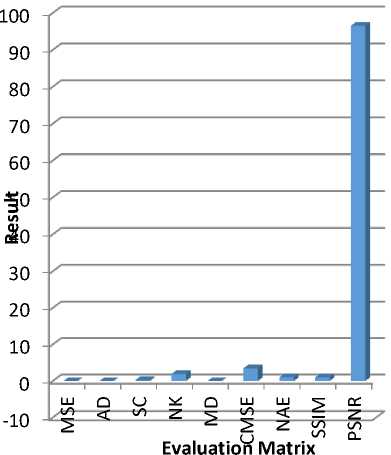
Fig.8. Evaluation of CT based image fusion
As shown in Fig. 8, the evaluation metrics are presented. These metrics provide insights into the quality of output image subjected to CT based image fusion.
-
VI. Conclusion and Future Work
In this paper, we studied the importance of using curvelets in image processing. Unlike wavelets and ridgelets, curvelets have two mathematical properties that are unique. First, curved singularities can be represented with few coefficients. Second, curvelets are still waveforms and wave equation can be used. CT is nothing but higher dimensional generalization of Wavelet transform. In this paper we studied the utility of Curvelets with two case study applications. First application is CT based texture classification while the second application is CT based image fusion. In both the applications CT enables good representation of edges and other singularities efficiently when compared with its predecessors such as Wavelets and ridgelets. Three datasets from two sources such as VisTex and Broadtaz’s texture database are used for experiments. We built a prototype application to demonstrate proof of the concept. The empirical results revealed that CT provides improved performance over its wavelet and ridgelet counterparts. In future, we enhance CT for dynamic texture classification with invariance to rotation and scale descriptors. Another future direction is to employ CT for medical data mining with applications such as brain tumour detection and breast cancer detection.
References Curvelet transform for efficient static texture classification and image fusion
- Lexing Ying ,Laurent Demanet and Emmanuel Candes , “3D Discrete Curvelet Transform”, ACM, p1-11, 2005.
- Emmanuel J. Candes and David L. Donoho, “Continuous Curvelet Transform: I. Resolution of the Wavefront Set”, Elsevier, p1-29, 2005.
- Emmanuel J. Candes and David L. Donoho, “Continuous Curvelet Transform: II. Discretization and Frames”, ACM, p1-22, 2005.
- Emmanuel J. Candes and David L. Donoho, “New Tight Frames of Curvelets and Optimal Representations of Objects with C2 Singularities”, Wiley Online Library, p1-39, 2004.
- Emmanuel Candes and Laurent Demanet, “Curvelets and Fourier Integral Operators”, Elsevier, p1-9, 2003.
- Emmanuel J. Candes and Franck Guo, “New Multiscale Transforms, Minimum Total Variation Synthesis: Applications to Edge-Preserving Image Reconstruction”, Elsevier, p1-36, 2002.
- Emmanuel J. Candes and Laurent Demanet, “The Curvelet Representation of Wave Propagators is Optimally Sparse”, ACM p1-44, 2005.
- Candes, Laurent Demanet, David Donoho and Lexing Ying, “Fast Discrete Curvelet Transforms”, SIAM , p1-44, 2006.
- Laurent Demanety and Lexing Yingz, “Curvelets and Wave Atoms for Mirror-Extended Images”, ACM, p1-15, 2007.
- Jyotismita Chaki, Ranjan Parekh and Samar Bhattacharya, “Plant leaf recognition using texture and shape features with neural classifiers.Computer Scince”, Elsevier p1-4, 2015.
- Sami Dhahbi n, Walid Barhoumi and Ezzeddine Zagrouba, “Breast cancer diagnosis in digitized mammograms using curvelet moments Computer Scince”, Elsevier, p1-12, 2015.
- Sloven Dubois, Renaud P ́eteri and Michel M ́enard, “Characterization and Recognition of Dynamic Textures based on 2D+T Curvelet Transform”, .IEEE , p1-14, 2013.
- Pelin Görgel, Ahmet Sertbas and Osman Nuri Uçan, “Computer-aided classification of breast masses in mammogram images based on spherical wavelet transform and support vector machines”, IEEE, 32(1) , p1-10, 2015.
- Karthik ,R. Menaka and C. Chellamuthu, “A comprehensive framework for classification of brain tumour images using SVM and curvelet transform”, IEEE , 17(2),p1-10, 2015.
- Xue, Jun Li, Liang Cheng, and Peijun Du, “Spectral–Spatial Classification of Hyperspectral Data via Morphological Component Analysis-Based Image Separation”, IEEE ,53(1),p1-15, 2015.
- S. Gornale, “Fingerprint Based Gender Classification for Biometric Security: A State-Of-The-Art Technique”, AIJRSTEM ,p1-11, 2015.
- Muhammad Imran Razzak, “Automatic Detection and Classification of Malarial Parasite”, IJBB , 9 , p1-12, 2015.
- Thomas Wiatowski and Helmut B, “A Mathematical Theory of Deep Convolutional Neural Networks for Feature Extraction”, IEEE ,p1-49, 2016.
- Mohana S.H. and Prabhakar C.J, “A NOVEL TECHNIQUE FOR GRADING OF DATES USING SHAPE AND TEXTURE FEATURES”, MLAIJ , 1(2),p1-15, 2014.
- M. Venkataramana , E.Sreenivasa Reddy, H.Satyanarayana and S.Anuradha, “A Review of Recent Texture Classification: Methods”, IOSR-JCE , 14(1) ,p1-7, 2013.
- Liran Shen, and Qingbo Yin, “Texture Classification using Curvelet Transform”, ISIP , p1-6, 2009.
- VizTex dataset, Available at: http://vismod.media.mit.edu/pub/VisTex/Images/Reference/Brick/ [Accssed: 20 February 2017]
- TEXTURE DATABASE, Available at:http://multibandtexture.recherche.usherbrooke.ca/original_brodatz.html [Accessed: 22 february 2017]
