Curvilinear Tracing Approach for Extracting Kannada Word Sign Symbol from Sign Video

Author: Ramesh M. Kagalkar, S.V Gumaste
Journal: International Journal of Image, Graphics and Signal Processing(IJIGSP) @ijigsp
Article in issue: 9 vol.9, 2017.
Free access
Gesture based communications are utilized as a primary method of correspondence, however, the differing qualities in the sign image portrayal limit its use to district bound. There is a tremendous assorted quality in the sign image portrayal from one nation to another, one state to another. In India, there is distinctive gesture-based communication watched for each state locale. It is henceforth exceptionally troublesome for one area individual to convey to other utilizing a signature image. This paper proposes a curvilinear tracing approach for the shape portrayal of Kannada communication via gestures acknowledgment. To build up this approach, a dataset is consequently made with all Swaragalu, Vyanjanagalu, Materials and Numbers in Kannada dialect. The arrangement of the dataset is framed by characterizing a vocabulary dataset for various sign images utilized as a part of regular interfacing. In the portrayal of gesture-based communication for acknowledgment, edge elements of hand areas are thought to be an ideal element portrayal of communication through signing. In the preparing of gesture-based communication, the agent includes assumes a critical part in arrangement execution. For the developed approach of sign language detection, where a single significant transformation is carried out, a word level detection is then performed. To represent the processing efficiency, a set of cue symbols is used for formulating a word. This word symbols are then processed to evaluate the performance for sign language detection. Word processing is carried out as a recursive process of a single cue symbol representation, where each frame data are processed for a curvilinear shape feature. The frame data are extracted based on the frame reading rate and multiple frames are processed in successive format to extract the region of interest. A system outline to process the video data and to give an optimal frame processing for sign recognition a word level process is performed.
Curvilinear feature, leap forward tracing, support vector machine, kannada sign language
Short address: https://sciup.org/15014226
IDR: 15014226
Text of the scientific article Curvilinear Tracing Approach for Extracting Kannada Word Sign Symbol from Sign Video
Published Online September 2017 in MECS
Sign language is the only mode of communication for vocally disabled people to communicate with the external world. The mode of sign language generated is dependent on the way of its representation, where only hand gesture or hand and lip movement are combined together to communicate. Wherein sign language is the only mode of communication in this domain, people need to be trained for this sign language to understand to communicate. The vocally disabled personals are given courses in this language towards sign language generation to communicate with each other. However, for a normal individual it is hard to understand this sign language, as no exposure or courses in this reference is given. It is then become a limited mode of communication for a vocally disabled individual with a common individual. This raise the need of a converter system, which is need for interfacing the captured sign language to automatically transform to an understanding character, to eradicate the interfacing issue.
This paper is organized as follows. In the section to follow, we have provided a brief overview of related work. In section 3 describes the system outline overviews of system, where the detailed description of approach used for shape representation. In section 4 provides experimental results and analysis on our self-built data set. Lastly conclusion of the work is outlined.
-
II. Related Work
Towards the development of such system, various systems were proposed in past. In [1] survey that specializes in computerized speech consciousness for sign language is presented. The definition of sign languages and the objective associated to them are first defined. The contributions made in automatic sign recognition are proposed. Examples of past initiatives and future trends when coping with sign languages are outlined A temporal dynamics of the generation of sign and the analysis of sign language for ISL was outlined in [2]. In [3] an Indian sign language system was proposed based on conditional random field (CRF). This approach works efficiently for complex backgrounds. The proposed approach was includes robust and efficient hand segmentation algorithm for the purpose of better recognition rate achievement. A real time simulation software WEBOTS is used for performing the classified gesture. A continuous ISL gesture recognition system was proposed in [4]. In this approach, both the hands are used for gesture performing. DWT was used for feature extraction and HMM was used for gesture recognition.
In [5] proposed a HCI system was proposed capable to perform gesture recognition from the ISL. In this, neural network (NN) was proposed at recognition. Additional it is proposed that quantity of finger pointers and the space of fingertips from the centroid of the hand can be used together with PCA for robustness and efficient results. In [6] a gesture classification scheme was described in the headquartered view setup to classify the large type of hand gesture. It is observed that the input images are given take form single capturing unit which provides the high complexity. However, it requires a classifier with high accuracy for the purpose of classification and also requires a consciousness motive. Thus the classification phase is carried out by combining the most popular classifiers such as KNN, MLP and SVM to classify the remote signs of signal languages.
The classification involves two phases, first, coarse classification through a single classifier and the next is fused classification through the combination approach. In [7] an approach was proposed for ISL application through facial expression. Face shape features were used through a Bayesian framework. SVM and HMM were used for tracking of face shape constraints. In [8] procedure is proposed that considers hand gestures for recognition of Indian signal Language. The proposed approach was able to recognize the signs even in the dynamic nature. This approach used a simple web camera to capture the hand gestures. ANN was used for recognizing the various signs and also translates them into voice and text format. In [9] a video based sign language recognition system was proposed. In this approach, the videos were captured while the signer performing the hand gesture. Next, the hand was segmented. Then after, the features of hand were extracted. This is a three step algorithm. This approach works effectively for motion tracking, edge detection and skin color detection. To convert human signal language to Voice with human gesture understanding and motion capture a Kinect of motion capture gadget from Microsoft was discovered.
In [10] an approach was proposed to develop an electronic instrument that can translate the sign language into speech to provide the communication between the mute people with general public. This also developed a data base for different signs which are called by signs world atlas. In [11] developed a new device based on the vision of language translation of ISL into speech in English for the purpose of helping impaired people. In this device, the gesture images of sign language are acquired with an inbuilt camera in the mobile phone, the operating system is used for processing them and the speech output is produced at the external hardware device thereby the hardware complexity is minimized. The device was fixed in a position such that it would recognize the numbers (0-9) and alphabets (A-Z). in [12] concentrated on the iconic lexical forms in British sign language (BSL). In three experiments conducted, the iconicity in BSL defines a Picture–sign matching, phonological decision, and picture naming. In [13] a dynamic system was proposed for gesture recognition of Arabian sign language (ASL). This approach takes the video input and extracts the hand area and the computes the motion features, then these features are used for recognition. The identification of hand was done using color space and skin detection model. Then, this system classifies the given input pattern based on their correlation coefficients.
In [14] a sign language recognition using the face and arm interface was suggested. The developed system was suggested for a learning approach to automate Indian sign language detection. The developed method proposed a new system model for automation in sign language recognition, where a tool is suggested for Indian sign language recognition developed over XML platform called SiGML. A new mode of sign language generation was suggested in [15] where the suggested system, uses the child behavior under consideration, for its automation. The approach defined uses the behavior mode as a learning parameter for sign language detection. The suggested system has up come with a picture book of large volume of children utterance as a training detail. In all these suggested approach, the base need of feature representation and its usage for automation is important part. An additional detail such as facial expression, electrical pulse, stereo mode gesture etc. Add to the recognition efficiency; however the processing overhead is large. As in real time usage this overhead may not be optimal for low resource standalone device such as mobile phone or PDA device, a low complexity coding is needed. With this objective in this work, a new approach of sign language recognition and transformation for Kannada language, based on region bound curvatures and region bound area is suggested. From the literature review, it is clear that various methods are used by different author for region localization; feature extraction and classification of sign gesture are proposed.
-
III. System Outline
To perform the word processing, the basic approach for the developed system is shown in fig.1. The word symbols are extracted from a given video sample, where the video data is processed frame wise manner and the recurrent frame information are eliminated as redundant bits. To perform the frame coding the video frame under process, is processed using a joint adjacent matching and a single ton region matching algorithm is used for frame processing. In the join adjacent region processing, in this frame processing, each characters are extracted as a set of image data and processed in a recurrent manner to extract the feature described. In the process of word recognition process the video frames are extracted based on the frame rate of the video sample. The video data are processed as an energy correlation, where the video sample is processed in time frame slices. The suggested approach of video processing for video frame data is as presented below.
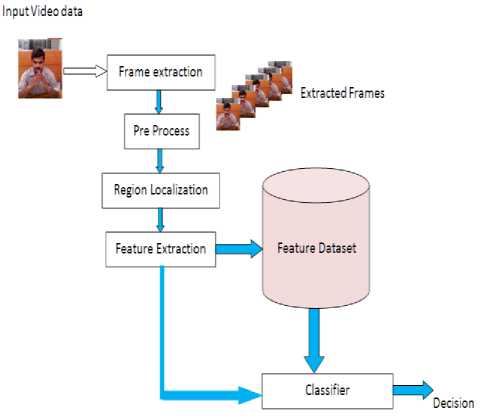
Fig.1. Proposed System Architecture for Video Coding.
The suggested approach defines a new representative feature sign curvilinear coding, which extract the major features from sample, uses leap forward tracing algorithm and region close area feature and process for character generation is discussed in detail.
-
A. Curvilinear Feature Representation
Towards the description of the hand region a bounding region representation is proposed. The region bound feature is developed in 3 phases, wherein,
Phase 1-The given image is passed for edge region prediction using Edge descriptor.
Phase 2-A close bound contour is derived using a forward march algorithm.
Phase 3-The curvature of the closed bound contour is developed and peak bond feature are selected.
For the edge detection, a canny operator is used. This operator derives the Canny operator extracts the edge regions through the first series of Gaussian filters derivatives. Canny uses the concept of maximum suppression in which the points with maximum gradient magnitude are assumed as peaks and having maximum local gradient in that direction, defines as pre smoothing filters. The observed edge image for a given cue sample is given in fig.2.
This detected edge region is then used as a reference model for representing the bound contour. For a cue symbol, the continuous bounding region can be defined as a contour. Contour detection can be done accurately if all the possible true corners were detected and there will be no false corners in that detected corners. The locating of corners points should be carried out to obtain the proper continuity. A robust contour estimator will estimate all possible corners even under the presence of noise. Leap forward tracing algorithm was proposed for contour detection.
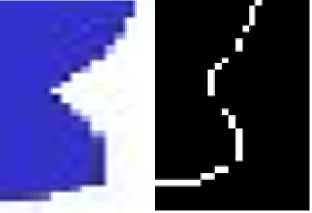
Fig.2. Detected Edge Region for a Given Sign Cue Symbol.
-
B. Leap Forward Tracing Algorithm
-
1. Find out the preliminary area pixel by scanning horizontally or vertically for the given side information.
-
2. The received initial pixel is termed as a seed and viewed as a reference pixel.
-
3. Taking the seed pixel as a beginning point, discover the viable eight neighboring pixels adjacent to it with the aid of tracing in anti-clockwise direction.
-
4. If (x, y) be the coordinate of seed pixel, then the tracing order will be,
-
5. If any pixel is determined as an adjoining neighbor to the seed pixel, then replace the new pixel as seed and repeat step 3, four and step 5 till the preliminary seed pixel is reached.
[1.(x+1,y),2.(x+1,y+1),3.(x,y+1),4.(x-1,y+1),5.(x-1,y),6.(x-1,y-1),7.(x,y-1),8.(x+1,y-1)].
The order of tracing is coded for tracing the path in the form of a frame, wherein the orientation of tracing is given in values an defined by,
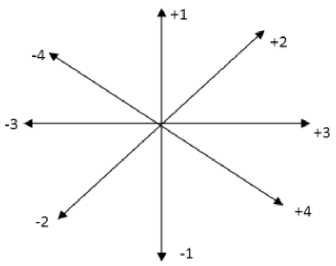
Fig.3. Weights of Orientations for Tracing the Contour.
For every forward/backward contour evolution tracing, a value is assigned at every iteration. This entire process will result in a contour, in fig.3 shows weights of orientations for tracing the contour. However, the obtained feature count is observed to be very high. To reduce the feature count, here, a new representation of features is represented termed as peak curvature feature representation. The new features are obtained by performing the convolution operation between a standard Gaussian function and the curve represented in a path based parameter. Since the Gaussian function’s standard deviation values are in the range of too small to too large, the extraction of a curve results a plane noise in the obtained curves. This new representation is robust to uniform scaling, rotation and translation of a curve. Along with this property, some more important properties make this new representation very much suitable to extract a noise curve from an orientation.
This process of curve describing at increasing ranges of abstraction is termed as the curve evolution. To extract a curve plane for the contour obtained for a given image, following strategy is carried out. For a given coordinates of a contour(x(u),y(u)), the curve airplane can be obtained as,
The curve plane of Γ σ is given by,
k ( u , CT ) =
Where,
X u ( u , CT ) Y uu ( u , CT ) — X uu ( u , CT ) Y u ( u , CT )
( X u ( u , CT )2 + Y ( u , CT )2 ) 3/2
Xu ( u , CT ) = V ( x ( u ) ® g ( u , ct ) ) = x ( u ) ® g u ( u , a ) d u
d 2
X uu ( u , CT ) = ^r ( x ( u ) ® g ( u , CT ) ) = x ( u ) ® g uu ( u , CT ) d u
Y u ( u , CT ) = y ( u ) ® g u ( u , CT )
Y uu ( u , CT ) = y ( u ) ® g uu ( u , CT )
= x ( u ) y ( u ) — y ( u ) x ( u ) ( x ( u )2 + y ( u )2 ) 3/2
The step by step illustration of proposed
region
boundary curvature representation algorithm is given as,
The utilization of this curvature is finished in the curve plane of a planar curve from its representation. Simplifying of formulae is completed in the case of special instances of parameterization.
If w is the parameter representing the normalized arc length then,
Step 1: Firstly read an input image.
Step 2: 2-level (1/0) conversion.
Step 3: Contour extraction through forward march region.
Step 4: Curvature evaluation through.
k ( w) = x ( w) y ( w) — x ( w) y ( w)
k(u CT = X u ( u , CT ) Y uu ( u , CT ) — X uu ( u , CT ) Y u ( u , CT ) , 3/2
( X u ( u , ct ) + Y ( u , ct ) )
Given a planar curve, r = {( x(w), y(w)) I w 40,1]}
Where, w is the parameter representing the normalized arc length, an evolved version of that curve is defined as,
Г . = { ( X ( u , CT ), Y ( u , ct ) ) I w ^ [0,1] }
Where,
X ( u ,a) = x ( u ) ® g ( u , ct ) Y ( u , ct ) = y ( u ) ® g ( u , ct )
Step 5: Proceed for evaluation of curvature with smoothening evaluation curvature by varying Gaussian factor (σ).
Step 6: So repeat the above step until all curvature are smoothened.
Step 7: Measure a threshold as,
(max(peak)*k) ,
Where k is a factor of smoothening
Step 9: Based on the obtained threshold, the decision is taken as,
g(u,σ) Describes the Gaussian width σ and defined as,
— u 2
g ( u , CT) = -------e2 ^
g(u,σ) and y(u,σ) are given explicitly by,
— ( u — v )2
X ( u , ct ) = f x ( v )--- t= e 2 ^ 2 dv
—”
— ( u — v ) 2
Y ( u , CT ) =[ y ( v )--- ^=e" 2 ^ 2 dv
—”
If P i, j < T h then
P i, j =0;
else
P i, j =P i, j;
Where P i, j is the element of obtained curvature.
The pseudo code algorithm is a represented below, {
Read cue image;
Pre-process (x, y)
Forward march ();
Derive contour [m, n];
// for evaluate the curvature by using k
For i=1 to n
X u ( u , 0 )Y„„ ( u , 0 ) - X uu ( u , 0 ) Y u ( u , 0 ) k ( u , 0 ) .3/2
( X u ( u , 0 ) + Y ( u, CT ) )
// Measure a threshold
_ (max(pea.k)*Zc)
Where, k is a factor of smoothening
If P i, j < T h then
P i, j =0;
else
P i, j =P i, j;
}
-
C. Region Closure Area Feature
The suggested approach represents the descriptive feature of region bound representation of cue symbol. To elevate the spatial symanticity issue, in addition to the defied feature, closed bound area region is as well defined. The region bound area is defined as a closed area under a curve. In the suggested approach, for the bounded region contour, the regions with value of ‘High’ are treated as an area region. The density of the area filling in addition to the derived curvature peaks are then treated as a learning feature for a support vector machine (SVM). The region bound area feature is defined as,
Where, C is defined as the closed bound contour. The area under the curve is defined as an aggregative sum of the region, subjected to the condition of coefficient bound into the closed contour region(C). The two feature set (K, A) is then passed as a training parameter to the classification system. The features are used as a learning feature to derive a classification. For each of the trained character from A-Z and 0-9 numeric, the training set is derived, defined as D (K i , A i ) where, K i is the region bound curvature feature and Ai are the region bound area feature. These features are considered as a learning knowledge parameter to SVM system. A multi class SVM model is developed for the classification of the given cue symbol to its corresponding recognition.
-
D. Word Recognition
For a given video file, while processing two frames, if a video file a time-slice t is observed as a match, and t + 2 is also a match, then t+1 is also considered as a match. Singleton areas while, if T and T + 2 do not match for the given query sample, the T + 1 is discarded as well. If selected on the histogram area to best match the dataset histogram feature is designed to get information. Minimum recovery performance leads to the proper selection of frame area adjacent area selection and single tones which were not classified under the region classification process.
It is observed that, depending on the correlation reduction process is an adjacent area frames which are distributed over a period of frames as a video content can reflect and are not been calculated in conventional approach. So for a long time frame, the system with more details impact need more analysis to strengthen the estimation process. The information are considered in a specified time frames to eliminate inter-frame correlation difference. For the processing for a given frame data the spectral interpolation is carried out based on the computed Histogram, defined by,
Hist i (k) = [Hist i (kN),Hist i (kN-1),…Hist i (kN-M+1)]
Where, Histi is the Histogram, N is number of frame to process and M is the total processing frames to be processed. To evaluate the motion effect in the temporal frames for prediction of word, a frame difference is computed given by, dfi,Hist(k) = Histi,t(k)-Histi,t+1(k) (14)
It defines the difference in two frame components, and low values min(dfi,Hist(k)) with the histogram feature elements are considered errors. Although celebrated in the frame of the observation period and the difference rate due to the impact of a large wandering may be effective. Therefore, in such a condensed mode with coding parameters will speed histogram intersection. To eliminate this problem, and to improve the feature selections choose a histogram bin computation on a time series is proposed. This approach is suggested, but rather a frame of information to the histogram, the histogram bins is selected. To get bin selection, initially histogram bins are normalized using a random weight factor.
HIST i (k) = HIST i (k)wt(k) (15)
Where, wt(k) = [wt 0 (k),wt 1 (k),…. wt M-1 (k)]T are the allocated weight value for each frame. The estimated frame difference is then defined as;
df i,Hist (k) = Hist i,t (k)-Hist i (k)wt(k) (16)
The difference is recursively been computed over the total frames (i=1….N), and the initial difference is recorded as df i,Hist,init
A weight factor is then updated as,
Where µ is the updating step size, with a difference updating factor. The objective of this computation is to select the bins satisfying the min(dfi,Hist (k) condition. Based on the derived minimum frame difference, the action model frame is extracted and processed for feature extraction. The extracted features are then processed for word recognition. The evaluation of the developed approach is as outlined below.
-
IV. Experimental Result and Analysis
To evaluate the operation performance for the developed system, a set of cue symbols for all the Vowels (Swaragalu/Swaras 16), Consonants (Vyanjanas 36) and Matras(14) of Kannada characters and also numeric characters of 0-10 (11) is developed is shown in fig.4a. 4b, 4c and 4d. The observations derived for the developed system is as outlined below, the training data set used is as illustrated. The proposed methodology is coded using MATLAB Version 7.11 (Release R2010b) and implemented on laptop with Intel(R) Core™ i3-2350M CPU @ 2.3GHz and 4GB RAM running Microsoft Windows 7.
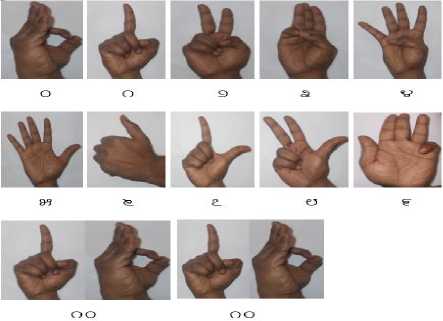
Fig.4a. Training Dataset of 0-10 Numerals Sign (11) in Kannada Language.
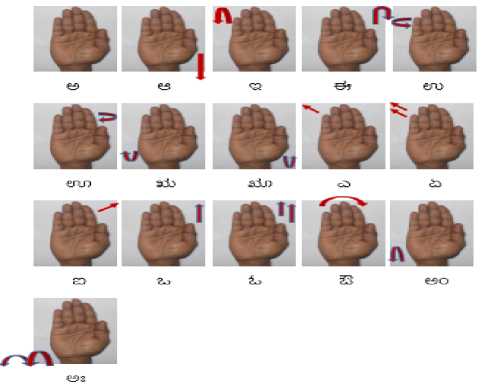
Fig.4b Training Dataset used of Swaragalu Sign (16).
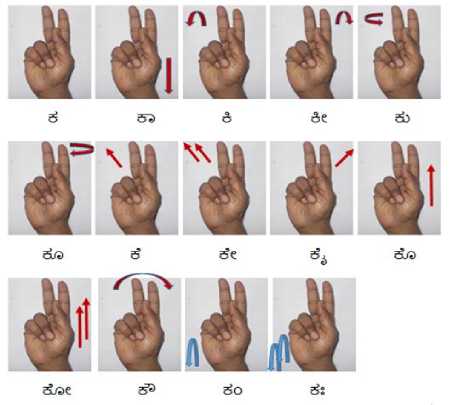
Fig.4c. Training Dataset of Vayanjanas Sign (36).
;t i i 30 Fi ^ 23
>^* ¥8 ed si ® dp 'sr
-
• »**l* ej d d c£ еэ
***** ^ si c5 c5 ^3
х^еи.® rd)
1T4^¥W cd d o d d
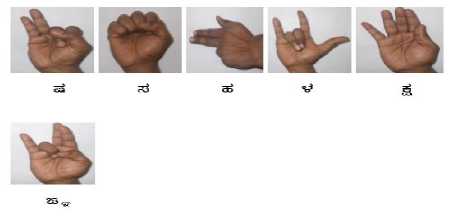
Fig.4d. Training Dataset used for the Developed System Matra Sign (14) in Kannada Language.
-
A. Performance Analysis
To evaluate the developed system the sample is processed in two phase of work. Wherein first phase process in training operation, 2nd phase is developed for testing. To achieve the objective of sign language to word transformation, a sequence of frame data is read and passed to processing unit. This unit transforms the given video frame to feature vector and the derived feature vectors are then processed for word mapping. To generate the translation operation, a set of word vocabulary data set is formed. The dataset is defined for different classes of training and testing. In dataset created is defined in with different classes defined as; Personal Pronouns , Family And Relatives, Religion and Religious Places, Cloths And Jewelry, Food Items Vegetables, Fruits, Colors, Calendar, Time, Birds, Domestics Animals, Wild Animals, Water Animals, Verbs, General Words and General Sentences. To each of the word vocabulary created in the dataset, a corresponding video file is created. The listed table 4.1 illustrates the content of the database created. This data set for each video file feature values are extracted and mapped to each of the word specified. This trained data is passed to the recognition system, for word recognition process. The experimental result obtained for the developed system outlines below. Test video frames passed for evaluation,
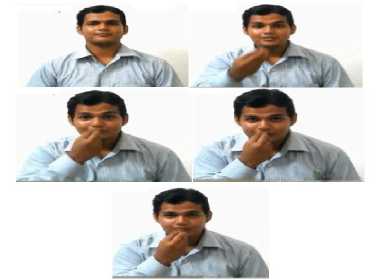
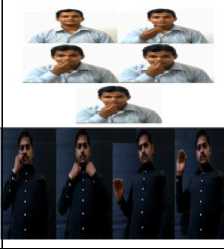
Fig.5. Test Sample for a Word ‘FOOD’.
Fig.5 illustrates the video frame passed for testing operation. The frame are sampled at 120fps and from the derived frame values, sample with minimum correlation values are extracted as isolated frames. These frame data are then passed for word recognition. The obtained observation (Table-1) for the given test sample is obtained as,
Table 1. Observation for the Given Test Sample.
Sr. No
Video Samples
My father is in higher post
Word in English
Food
Recognized Kannada word
ИЕЭб
ЙЙЧ Зоб бб^Й фe^j ипб.
A similar case analysis for different words sample is carried out. The obtained observation for the developed system is as outlined below.
Table 2. Observation Derived for Different Test Video Samples.
|
Sr. No. |
Video samples |
Words in English |
Recognized Kannada words |
|
1 |
GW_ Video_9 |
Time |
г—" |
|
2 |
WA_Video_5 |
Frog |
d^ |
|
3 |
T_Video_5 |
Now |
W, |
|
4 |
T_Video_11 |
Always |
^гайм |
|
5 |
T_Video_12 |
Early |
бей |
|
6 |
T_Video_13 |
Late |
8^5^е„ |
|
7 |
CJ_Video_21 |
Cosmetics |
5ЭЙЬЫ^„ |
|
8 |
CJ_Video_22 |
Cream |
Sje^ |
|
9 |
FR_Video_20 |
Boy |
йгй^ |
|
10 |
FR_Video_21 |
Girl |
йгйгП |
|
11 |
FR_Video_22 |
Children |
—dA^ |
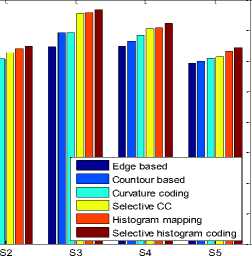
Table-2 presents the derived observation for the developed approach for different test samples. The test carried out illustrates a higher recognition rate of retrieval for the developed system. The performance of the developed system is evaluated based on the computation time; feature overhead for learning and testing, and recognition performance. The obtained results are illustrated in the given fig. 6, 7, 8, 9, 10 and 11 with respective table Table-3, 4, 5, 6, 7, 8, 9, 10 and 11 below.
Table 3. Observed Correlative Error for the Test Frame Samples.
|
Sr. No. |
Methods |
Correlative Errors |
||||
|
S1 |
S2 |
S3 |
S4 |
S5 |
||
|
1 |
Edge based |
28.24 |
28.46 |
32.32 |
32.45 |
29.60 |
|
2 |
Contour based |
29.48 |
29.02 |
34.68 |
33.26 |
30.03 |
|
3 |
Curvatur Coding (CC) |
30.41 |
30.39 |
34.73 |
34.23 |
30.49 |
|
4 |
Selective CC |
34.48 |
31.46 |
37.80 |
35.21 |
30.68 |
|
5 |
Histogram mapping |
35.48 |
31.96 |
37.91 |
35.54 |
31.65 |
|
6 |
Selective Histogram coding |
36.52 |
32.40 |
38.38 |
36.20 |
32.21 |
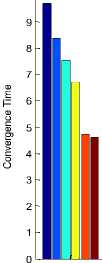
Table 5. Observed Convergence Time for the Test Samples.
|
Method |
Convergence time |
||||
|
S1 |
S2 |
S3 |
S4 |
S5 |
|
|
Edge based |
9.68 |
9.43 |
8.38 |
8.67 |
9.23 |
|
Contour based |
8.39 |
9.92 |
8.80 |
8.82 |
9.04 |
|
Curvature coding (CC) |
7.53 |
7.55 |
8.07 |
7.85 |
8.67 |
|
Selective CC |
6.72 |
6.68 |
7.35 |
7.15 |
8.44 |
|
Histogram mapping |
4.71 |
6.31 |
5.49 |
5.98 |
8.07 |
|
Selective Histogram coding |
4.60 |
6.12 |
5.10 |
4.92 |
7.43 |
25 й
Test Sample
S1
Edge based Countour based Curvature coding
। । Histogram mapping
^е S ele ctive histog ram coding

S2
S3
Test Sample
S4
S5
Fig.8. Observed Convergence Time Comparison Plot.
Fig.6. Observed Correlative Error for Different Estimation Approach.
Test Sample
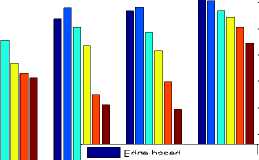
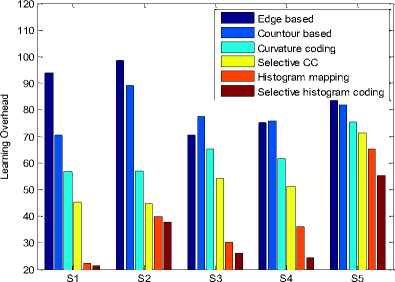
Fig.7. Observed Learning Oerhead Comparison Plot.
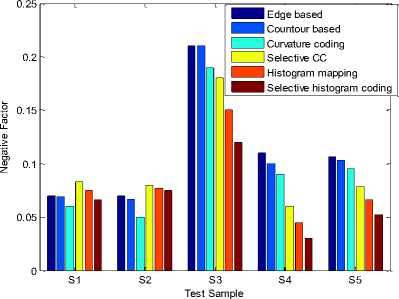
Fig.9. Observed Negative Factor Comparison Plot.
Table 4. Observed Learning Overhead for the Test Samples.
|
Method |
Learning overhead |
||||
|
S1 |
S2 |
S3 |
S4 |
S5 |
|
|
Edge based |
93.70 |
98.60 |
70.30 |
75.23 |
85.26 |
|
Contour based |
70.39 |
89.11 |
77.46 |
75.72 |
81.84 |
|
Curvature coding (CC) |
56.78 |
57.12 |
65.14 |
61.76 |
75.34 |
|
Selective CC |
45.21 |
44.60 |
54.07 |
51.17 |
71.39 |
|
Histogram mapping |
22.24 |
39.82 |
30.15 |
35.85 |
65.25 |
|
Selective Histogram coding |
21.25 |
37.56 |
26.02 |
24.30 |
55.33 |
Table 6. Observed Negative factor for the Test Samples.
|
Sr. No. |
Methods |
Negative factors |
||||
|
S1 |
S2 |
S3 |
S4 |
S5 |
||
|
1 |
Edge based |
0.07 |
0.070 |
0.21 |
0.11 |
0.1064 |
|
2 |
Contour based |
0.069 |
0.067 |
0.21 |
0.10 |
0.1037 |
|
3 |
Curvature coding (CC) |
0.060 |
0.050 |
0.19 |
0.09 |
0.0952 |
|
4 |
Selective CC |
0.083 |
0.080 |
0.18 |
0.06 |
0.0786 |
|
5 |
Histogram mapping |
0.075 |
0.077 |
0.15 |
0.04 5 |
0.0658 |
|
6 |
Selective Histogram coding |
0.066 |
0.075 |
0.12 |
0.03 |
0.0523 |
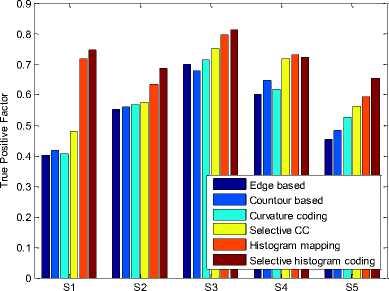
Table 7. Observed True Positive Factor (TPF) For the Test Samples.
|
Method |
TPF |
||||
|
S1 |
S2 |
S3 |
S4 |
S5 |
|
|
Edge based |
0.401 |
0.551 |
0.70 |
0.602 |
0.453 |
|
Contour based |
0.416 |
0.559 |
0.678 |
0.645 |
0.484 |
|
Curvature coding (CC) |
0.407 |
0.567 |
0.715 |
0.618 |
0.525 |
|
Selective CC |
0.481 |
0.574 |
0.752 |
0.717 |
0.562 |
|
Histogram mapping |
0.718 |
0.632 |
0.795 |
0.729 |
0.594 |
|
Selective Histogram coding |
0.745 |
0.685 |
0.812 |
0.723 |
0.655 |
Test Sample
Fig.10. Observed True Positive Factor (TPF) Comparison Plot.
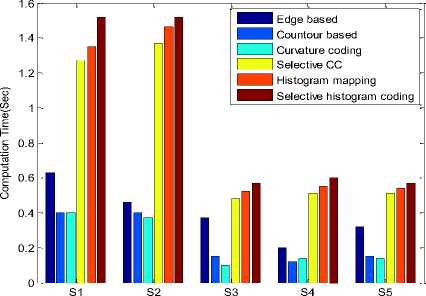
Table 8. Observed Computation Time for the Test Samples.
|
Sr. No. |
Methods |
Computation Times |
||||
|
S1 |
S2 |
S3 |
S4 |
S5 |
||
|
1 |
Edge based |
0.63 |
0.46 |
0.37 |
0.20 |
0.32 |
|
2 |
Contour based |
0.40 |
0.40 |
0.15 |
0.12 |
0.15 |
|
3 |
Curvature coding (CC) |
0.40 |
0.37 |
0.10 |
0.14 |
0.14 |
|
4 |
Selective CC |
1.27 |
1.37 |
0.48 |
0.51 |
0.51 |
|
5 |
Histogram mapping |
1.35 |
1.46 |
0.52 |
0.55 |
0.54 |
|
6 |
Selective Histogram coding |
1.52 |
1.52 |
0.57 |
0.60 |
0.57 |
Test Sample
Fig.11. Observed Computation Time Comparison Plot.
The derived observations (from Table-3-11 and Fig. 611) illustrate a comparatively higher estimation performance for selective coding approach. Where the features are extracted over the selected frames, and the dominant curvature points reflect the descriptive feature more effectively. The true positive factor for the developed system is 0.2 units higher in comparison to the conventional system models.
V Conclusion
The developed system is processed for word recognition in sign language processing. The test sample is passed as a cue symbol to the developed system, where the sign cue symbol is processed for feature extraction and mapped to generate a mapped word for the given recognizing sign language. The suggested approach illustrates an optimal frame selection to minimize the frame processing overhead, and the test frames are then processed for selective curvature feature extractions. The proposed approach, results in higher retrieval accuracy as compared to the conventional processing system. This system, result in lower descriptive feature with minimum processing frames, which hence achieve the objective of higher accuracy and lower processing overhead.
References Curvilinear Tracing Approach for Extracting Kannada Word Sign Symbol from Sign Video
- Lalit Kane and Pritee Khanna (2012) ‘Towards establishing a communication an Indian sign language perspective’, 4th International Conference on Intelligent Human Computer Interaction, Kharagpur, IEEE, pp.1-6.
- Vivek Kumar Verma, Sumit Srivastava and Naveen Kumar (2015) ‘A Comprehensive Review Automation of Indian Sign Language’, International Conference on Advances in Computer Engineering and Applications (ICACEA), IEEE, pp-138-142.
- Pratibha Pandey and Vinay Jain (2015) ’Hand Gesture Recognition for Sign Language Recognition: A Review’, International Journal of Science, Engineering and Technology Research (IJSETR), Vol. 4, Issue 3.
- Besacier, L., Barnard, E., Karpov, A. and Schultz, T. (2013) ‘Automatic Speech Recognition for Under- Resourced Languages: A Survey’, Speech Communication, Elsevier, Vol.56, pp- 85-100.
- Cristina Bausa and Albert Costa (2015) ‘On the Temporal Dynamics of Sign Production: An ERP Study in Catalan Sign Language (LSC)’, Elsevier, Vol. 1609, Issue 3, pp 40-53.
- P.M. Mahajan and Jagruti S. Chaudhari (2015) ‘Review of Finger Spelling Sign Language Recognition’, International Journal of (IJETT), Vol. 22, Number 9.
- Prerna Gupta, Garima Joshi and Maitreyee Dutta (2015) ‘Comparative Analysis of Movement and Tracking Techniques for Indian SignLanguage Recognition’, 5th International Conference on Advanced Computing & Communication Technologies, IEEE, PP-90-95, 2015.
- Kanchan Dabre (2014) ‘Machine Learning Model for Sign Language Interpretation using Webcam Images’, International Conference on Circuits, Systems, Communication and Information Technology Applications (CSCITA) IEEE, pp.317-321.
- Daleesha M Viswanathan and Sumam Mary Idicula (2015) ‘Recent Developments in Indian Sign Language Recognition: An Analysis’, International Journal of Computer Science and Information Technologies, Vol. 6 (1), 2015.
- Ananya Choudhury, Anjan Kumar Talukdar and Kandarpa Kumar Sarma (2014) ‘A Conditional Random Field based Indian Sign Language Recognition System under Complex Background’, 4th International Conference on Communication Systems and Network Technologies, IEEE, pp-900-904, 2014.
- W.W.Kong and Surendra Ranganath (2014) ‘Towards subject independent continuous sign language recognition: a segment and merge approach’, Pattern Recognition, Elsevier, Vol.47, Issue 3, pp- 1294-1308, 2014.
- Mohidul Alam Laskar (2015) ‘Stereo vision-based hand gesture recognition’, Second International Symposium on Computer Vision and the Internet , Procedia Computer Science 58, Elsevier, Vol.58, pp.194-201.
- Ravikiran Krishnann and Sudeep Sarkar (2015) Conditional distance based matching for one- shot gesture recognition’, Pattern Recognition, Elsevier, Vol.48, Issue 4, pp.1304-1314.
- M.K. Bhuyan, D. Ghoah, and P.K. Bora (2006) ‘A Framework for hand gesture recognition with applications to sign language’, India Conference, IEEE, pp.1-6.
- T. Shanableh and K. Assaleh (2011) ‘User- independent recognition of arabic sign language for facilitating communication with the deaf community’, Digital Signal Processing, Elsevier, Vol.21, Issue 4, pp.535-542, 2011.
