Damage Measurement of Collision Attacks on Performance of Wireless Sensor Networks

Author: Mina Malekzadeh, Sadegh Ebady, M.H. Shahrokh Abadi
Journal: International Journal of Information Engineering and Electronic Business(IJIEEB) @ijieeb
Article in issue: 6 vol.6, 2014.
Free access
Wireless sensor networks (WSN) are widely developed to monitor different phenomena in a variety of areas including nature, medical centers, home automation, industrial and military applications. Such development in many different fields, raises important security issues related to the reliability of the WSNs. Due to the resource constrained nature of the WSNs, these networks are the target of many different types of attacks and prone to failure. In this paper, we consider the collision attack. An attempt has been made to measure the impact of the collision attack on the performance of WSNs under variety scenarios performed by the attackers. The main contribution of this paper is to present that although the attack does not consume much energy of the attacker, it can highly disrupt the normal operation of the target sensor networks. The implementation of the proposed attack model has been done by using NS2 network simulator.
Collision attack, wireless sensor security, WSN attacks
Short address: https://sciup.org/15013312
IDR: 15013312
Text of the scientific article Damage Measurement of Collision Attacks on Performance of Wireless Sensor Networks
Published Online December 2014 in MECS
WSN are subject to several constraints in terms of battery (limited lifetime), embedded processor (slow computation), and memory (limited storage). Due to these limitations, the existing security mechanisms are poorly fitted for WSNs to provide security level in an energyefficient manner. This in turn has led the way to expose their security using different attacks conducted by intruders. In this paper, we study the collision attack. Based on rules implied in the medium access control (MAC) protocol, a collision occurs when two distinct transmissions happen simultaneously on the same media.
When the packets collide, a change occurs in their data portion, causing a checksum mismatch at the receiving end. The packet is then discarded as an invalid packet and the source sensor node is responsible for the retransmission [5]. The attackers exploit the MAC protocol to launch collision attack. They deliberately induce collisions to the target media even by sending a short packet [14]. Adversaries may only need to induce a collision in one octet of a transmission to disrupt the entire packet. A corrupted acknowledgment control message could induce costly exponential back-off and retransmissions.
The collision attack can affect the normal performance of WSNs in different ways. The attack can increase energy consumption level of the sensor nodes while trying to detect collision and provide reliable data transmissions. Moreover, the attack can cause loosing many packets, which in turn degrade the network throughput due to retransmissions of the lost packets.
In this work, we implement the collision attacks with different aspects to measure their severity and the amount of damages induced to WSNs. The rest of the paper is organized as follows. Section 2 reviews the related researches. In Section 3 we propose an attack model to conduct the collision attacks over WSNs under different scenarios. We present and analyze the experimental results in Section 4. We conclude this paper in Section 5.
-
II. Related Work
The threats against WSNs can be implemented in different layers of the OSI protocol stack. The common types of these attacks, classified based on the OSI layers, are presented in Table1.
Table 1. Common Types of Attacks over WSNs Based on OSI Layers
|
Layer |
Attack |
Process |
|
Physical |
Jamming |
The attackers broadcast a high-energy signal to jam the frequencies of the radio used for communication by the users in the target network [2,3,16]. |
|
Radio interference |
The attacker produces large amounts of interference periodically or persistently [3]. |
|
|
Tampering or Destruction |
The attacker extracts sensitive information by physical access to a node [3,5]. |
|
|
Data link |
Collision |
Collide data by concurrent transmission over the channel in the target network [5,6,14,17]. |
|
Exhaustion |
The attacker disrupts the MAC protocol by continuously requesting or transmitting over the channel and exhausts the power supply [5]. |
|
|
Unfairness |
Repeated exhaustion or collision [8,9]. |
|
|
Interrogation |
Repeatedly sending requests to send/clear to send (RTS/CTS) messages [3]. |
|
|
Sybil |
A single malicious node will appear as a set of nodes and send incorrect information to a node. The incorrect information can be a variety of things including position of nodes, signal strengths, making up nodes that do not exist [8,9]. |
|
|
Network |
Sinkhole |
The attack makes a compromised node look especially attractive to surrounding nodes with respect to the routing algorithm. For example a compromised node advertises zero cost route through itself which is attractive for algorithms like distance vector which is a “low cost route first “protocol [19,20]. |
|
Flooding: Hello flood Ping flood |
Hello flood: Hello packets are required to announce nodes to their neighbors. By receiving Hello packets, a node assumes that it is in the range of the sender. Attacker broadcasts a Hello packet with very high power, so that a large number of nodes even far away in the network choose it as the parent. All data now need to be routed multi-hop to this parent, which increases delay [8,9,15]. Ping flood: attacker sends a huge number of ICMP echo request (ping) packets as fast as possible without waiting for replies to overwhelm the destination resources [9]. |
|
|
Node capture |
A particular sensor might be captured, and information stored on it is used by an adversary to penetrate the network [3,9]. |
|
|
Selective forwarding or Black hole or Neglect and Greed |
Sensor nodes are supposed to forward all data faithfully. A malicious node can advertise itself having a valid fresh shortest and stable path to the destination node. Once the node attracts the traffic toward itself, it can start attacks in different ways: If it drops all the packets through them, then it is called a Black Hole Attack. If it selectively forwards the packets, then it is called selective forwarding [3]. |
|
|
Sybil |
This attack is especially confusing to geographic routing protocols as the adversary appears to be in multiple locations at once [11,12]. |
|
|
Wormhole |
Two colluding nodes that are far apart are connected by a tunnel giving an illusion that they are neighbors when they are actually in different parts of the network. Each of these nodes receive route requests and topology control messages from the network and send those to the other colluding node via tunnel which will then replay it into the network from there. By using this additional tunnel, these nodes are able to advertise that they have the shortest path through them. This can also confuse routing mechanisms that rely on knowing distances between nodes [9,13,18]. |
|
|
Spoofed, Altered, or Replayed routing information |
The attack targets the routing information while it is being exchanged between nodes in order to disrupt traffic in the network. These disruptions include the creation of routing loops, attracting or repelling network traffic from select nodes, extending and shortening source routes, generating fake error messages, partitioning the network, and increasing end-to-end latency [5]. |
|
|
Acknowledgment spoofing |
Routing algorithms sometimes require Acknowledgments to be used. An attacking node can spoof the Acknowledgments of packets destined for neighboring nodes in order to provide false information to those neighboring nodes [10]. |
|
|
Misdirection |
A malicious node that is part of a route, send the packets in wrong direction through which the destination is unreachable [9]. |
|
|
Internet Smurf |
The attacker makes a forgery ICMP packet with broadcast destination address and then put the victim IP address as the source address. When devices on the network receive this packet, they all respond to this by sending a reply to the source IP address. If the number of machines on the network that receive and respond to these packets is very large, the victim's computer will be flooding with traffic [3]. |
|
|
Homing |
In most sensor networks, some nodes provide critical services such as being leader of a local group or cluster heads. These nodes attract an adversary’s Interest. Attacker uses traffic pattern analysis to identify these critical nodes for jamming or destroying them [3]. |
|
|
Transport |
Flooding: SYN flood |
Protocols that must maintain state at either end are vulnerable to memory exhaustion through flooding. In the classic TCP SYN flood, an adversary sends many connection establishment requests to the victim. Each request causes the victim to allocate resources that maintain state for that connection. It produces severe resource constraints for legitimate nodes [7,8]. |
|
De-synchronization |
Adversary repeatedly forges messages to one or both end points. These messages carry sequence numbers or control flags that cause the nodes to request retransmission of missed frames. This can waste energy and degrade or prevent the exchange of useful data [3,8]. |
From the above table, the collision attack in data link layer is the focus of this paper. As the table shows, few literatures focus on describing the collision attacks however none of them have implemented these attacks to measure the impacts on the performance of WSNs. We design a simulation scheme using NS2 and implement the collision attacks using different scenarios to measure the performance of the WSN network infected by these attacks.
-
III. Proposed Simulation Scheme
In this section, we describe the implementation details of the simulation scenarios and the performance metrics to evaluate these scenarios.
-
A. WSN network model
We use NS2 to design our sensor network topology and scenarios. An 800x800 meter as a 5x5 nodes grid with nodes numbered from 0 to 24 is designed as the WSN environment. An additional node25 is considered as the destination of the node0 as the source. The distance between the adjacent nodes is 150m. The topology of the WSN network is shown in Fig. 1.
|
5е> |
о> |
С5> |
@ |
|
|
53> |
<в> |
<Е> |
О |
|
|
СО |
Cj) |
О |
<о> |
О |
|
(5) |
<б) |
О |
(5D |
о |
|
CS |
Cl) |
Cl) |
Cl) |
Fig. 1. WSN simulation environment to implement the collision attack
The AODV is used as the routing protocol through the simulations to route data from the source (node0) to the destination (node25) via the leader node24. The AODV protocol calculates the best path based on the number of hops and the distance between the source and the destination. The final path chosen by the AODV in the WSN simulation environment is presented in Fig. 2.
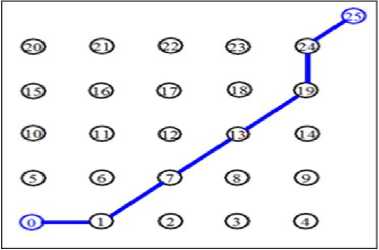
Fig. 2. Selected path by AODV in the WSN simulation environment
The other network parameters used in the simulation are presented in Table 2.
Table 2. Sensors Model Parameters
|
Parameters |
Values |
|
Channel type |
WirelessChannel |
|
Radio propagation |
TwoRayGround |
|
network interface type |
WirelessPhy |
|
MAC protocol |
Mac/802_11 |
|
interface queue type |
DropTail/PriQueue |
|
Mobility model |
Random WayPoint |
|
antenna mode |
OmniAntenna |
|
max packet in queue |
50 |
|
number of sensor nodes |
25 |
|
routing protocol |
AODV |
|
x coordinate of topology |
800 |
|
y coordinate of topology |
800 |
|
Simulation time |
100s |
B. Simulation system description
Using the WSN network model described above, we conduct our simulation scenarios in two distinct phases as follows.
-
B.1 Phase1; WSN simulation with no collision attack
The first phase represents the implementation of the WSN under normal operations without the presence of the attacker. The variable parameters for this phase are presented in Table 3.
Table 3. Network Parameters Used in Phase1
|
Parameters |
Values |
|
Packet interval |
0.02, 0.05, 0.1 |
|
Packet size |
500, 1000 |
|
Traffic type |
UDP CBR |
-
B.2 Phase2; WSN simulation under collision attack
In contrast, in the second phase, the attacker will start the collision attack with different characteristics against the WSN. The goal is to measure the severity of the damage the attacks impose to the sensor network. To start any attack, the attackers initially need to make some decisions. These decisions are particularly important to conduct the attacks as destructive as they intend to.
Most commercial servers and websites have intrusion detection systems (IDS) protecting them. These systems look for malicious activities to alert about the attacks. So transmitting huge number of packets in a short time can be detected by these systems. On the other hand, these IDS systems usually have a threshold setting. The default threshold value is usually1000 packets per second [21]. Therefore, to avoid being detected, the attacker needs to choose a proper attack rate or packet size so that while it is low enough to be under the IDSs threshold, it is high enough to be as destructive as possible. Therefore, this phase is conducted to answer three following questions:
Question1 : It is well known that since WSNs are usually battery powered, they are resource constrained. On the other hand, it is clear that transmitting larger packets demands higher energy. Based on these facts, what size of the attack packets does impose more damage to WSN while consuming less energy of the attacker? To answer this question in our simulation, the attacker launches the collision attack with three distinct packet sizes ranging from smaller sizes as 50B, 100B to bigger as 500B.
Question2 : In wireless technology the distance, location, and placement of the wireless devices have direct effect on their performance. Based on this fact, our goal is to investigate how close/far the attacker can set up his devices to compel more damage to the target WSN? To answer this question in our simulation, the placement of the attacker is in motion between three different positions providing three distinct scenarios. These positions include: near the source (node 6), near the destination (node 18), and in the middle of the main selected route (node 13). Being in each place, the attacker will transmit packets with different characteristics to provide collision.
Question3: All networks have a random pattern in term of the transmission time. Nodes can transmit whenever they have data to be sent. Therefore, the attacker is not able to figure out when to send his malicious packets to collide with the legal packets. In this case, the attacker needs to choose a proper interval time between the attack packets. So, the question is, how does the variations of the intervals between the attack packets can vary the impact of the collision attack? To answer this question in our simulation, three different intervals as 0.05s, 0.02s, and 0.01s are related to the attack packets. These intervals provide three different attack load rates equivalent to 20, 50, and 100 packets per second.
These variable parameters applied by the attacker to conduct the collision attacks are summarized in Table 4.
Table 4. Attack Parameters Used in Phase2
|
Parameters |
Values |
|
Attacker’s position |
at nodes 6, 12, 13, 18 |
|
Attack packets interval |
0.05, 0.02, 0.01 |
|
Attack packets size |
50, 100, 500 |
Designing scenarios to study a protocol, essentially involves making choices regarding to which details and parameters to implement or use. The aim of this study is to measure the amount of damage that the collision attack induces to the WSN on its best performance to offer a realistic simulation. On the other hand, as it is observed, there will be 6 and 36 distinct states based on the Phase1 and Phase2 respectively. Combination of the two phases will provide huge number of network states. Therefore, for practically reasons, we need to decide on a methodology so that while preserving the accuracy of the simulation model, it reaches practical number of states.
Thus, the implementation results of the first phase are utilized to determine the most stable network behavior which is used as the WSN environment to be targeted by the attacker in the second phase. In other words, we implement the Phase1 and then by analyzing the obtained results we select the parameters based on the most stable results. These parameters are utilized to implement the Phase2.
C. Performance metrics
In order to measure the impact of the collision attack, we investigate three metrics which are the packet lost rate, throughput, and delay which are described as follows.
End-to-End delay (D) : is considered as the time taken by a packet to travel from the sender node (T s ) until it is successfully received at the receiver node (T r ) by considering the propagation delay (T p ):
D=T r - T s + T p , where T p =distance between the source and destination / speed of light.
Throughput (T) : is computed by dividing the amount of data received at the destination node by the time taken to arrive at this node:
T = ∑ (Received Packets * Packet size * 8) / time taken
Packet lost rate (PLR): is considered as the difference between the total number of transmitted packets and the total number of successfully received packets at the destination node divided by the total number of transmitted packets:
PLR = (Transmitted Packets - Received Packets) / Transmitted Packets*100
-
IV. Experimental Results
We design four distinct experiments to answer the research questions discussed in the previous section. In this section, the results of the four experiments are presented.
-
A. Experiment 1: WSN under normal operation with no attack
In this experiment we intend to quantify the performance of the WSN under normal conditions when there is no attacking activity on the network. The results in terms of the performance metrics are presented as follows.
A.1 End-to-End delay
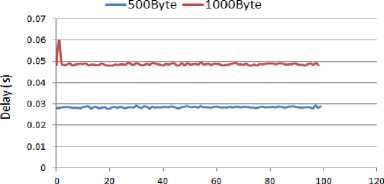
The comparison of end-to-end delay under different packet intervals and sizes in the absence of the attacker is presented in Fig. 3.
Packet interval=0.2s (no attacker)
Number of packets
Number of packets
Packet interval=O.05s (no attacker)
---500Byte ---1000Byte
0 50 100 150 200 250
Number of packets
Fig. 3. Delay for WSN with no attacks
The packet intervals of 0.2s, 0.1s, and 0.05s provide network load rates equivalent to 5, 10, and 20 packets per second respectively. Comparing the above results shows a direct relation between delay, packet size, and load rate. As the load rate or packet size increases, the delay increases too. Based on the results, the least delay is when the packet interval is 0.2s with each packet 500 bytes.
Also, the highest delay in the WSN is observed when the interval between the packets is 0.05s with each packet being 1000 bytes. The gaps observed in this graph are related to the delay of the packets that lost due to overloading the capacity of the buffer and also because the queue time exceeds the time limit.
Hence, concluded from the graphs, the best WSN performance, in term of less delay, is provided by exchanging 500 bytes packets every 0.2s.
A.2 Throughput
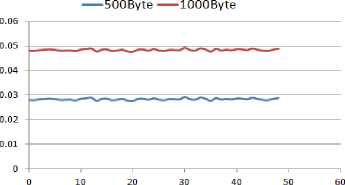
Throughput of the WSN under different load rates and traffic sizes when there is no ongoing collision attack is presented in Fig. 4.
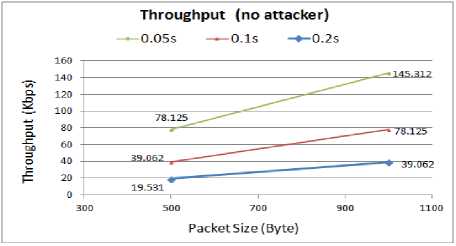
Fig. 4. Throughput for WSN with no attacks
The results prove that the WSN acquires higher throughput under a higher traffic load (lower packet interval). Comparing the three load rates shows that regardless of the size of the packets, 0.05s interval between the packets provides better WSN performance in term of higher throughput. Therefore, the best throughput is achieved by exchanging 1000 bytes packets every 0.05s.
A.3 Packet lost rate
The comparison of the packet lost rate for different network loads for normal operation of the WSN is presented in Fig. 5.
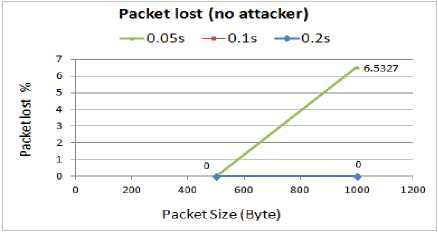
Fig. 5. Packet lost rate for WSN with no attacks
As we can see, with 0.2s and 0.1s packet intervals, all the transmitted packets are efficiently delivered to the destination in the WSN. Thus, this 100% packet reception provides zero lost packets. When the packet interval decreases to 0.05s, with 500B packets, the WSN can still achieve zero percent lost rate. However, with the same load rate when the packet size is bigger (1000B), the WSN starts dropping the packets. The results show 93.46% received packet rate during the simulation which resulting in 6.54% packet lost rate. Hence, better performance in term of less packets lost is achieved for the WSN when the packets interval is either 0.2s or 0.1s.
A.4 Selecting the most stable behavior
Now that we measure our performance metrics for normal operation of the WSN, we need to make a decision about the parameters used for the scenarios in the second phase. In order to make this decision, the results of the first phase have been summarized in Table 5.
Table 5. The Summarized Results of the Phase1 (No Attacks)
|
Packet interval |
Packet size (B) |
Delay (S) |
Throughput (Kbps) |
Reception (%) |
Lost (%) |
|
0.2 |
500 |
Low |
High |
100 |
0 |
|
0.2 |
1000 |
High |
Lower |
93 |
7 |
|
0.1 |
500 |
Low |
High |
100 |
0 |
|
0.1 |
1000 |
Avg. |
High |
100 |
0 |
|
0.05 |
500 |
Low |
High |
100 |
0 |
|
0.05 |
1000 |
Avg. |
High |
100 |
0 |
As the above table shows, the best performance of the WSN is provided by the parameters values in the first row (highlighted gray). Therefore, we implement the Phase2 of the simulation to start the collision attacks when 500B legal packets with 0.2s interval are transmitted by the legal users through the target WSN.
-
B. Experiment 2: Attacker positions at node6 (near the sender)
This experiment considers node6 as a compromised node which is taken over by the attacker to conduct the collision attack. The goal is to evaluate how destructive the collision attack can be if the attacker places in a position near the source sensor. The attacker position and the area it covers, are presented in Fig. 6.
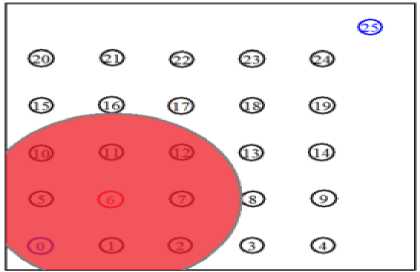
Fig. 6. Simulation environment with the compromised node6 as the attacker
-
B.1 End-to-End delay
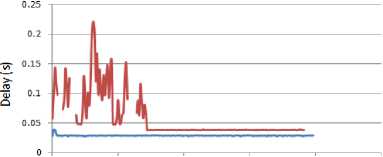
The comparison of the end-to-end delay for different attack rates when the node6 is compromised by the attacker is presented in Fig. 7.
Packet interval-0.05s (attacker is node 6)
Number of packets
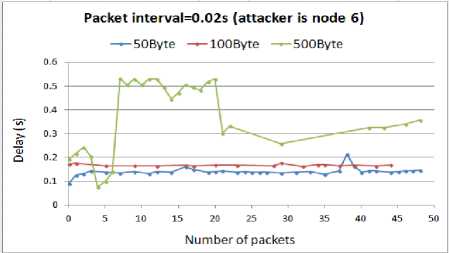
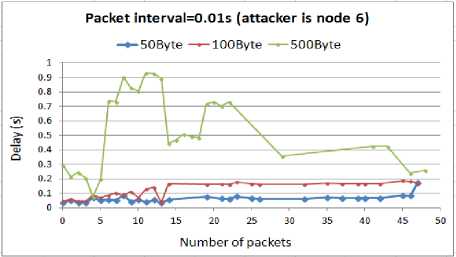
Fig. 7. Delay for WSN with compromised node6
In the above figure, we have mapped the number of packets delivered to the destination node with the delay of these packets. The attacker is node6 where the source sensor (node0) is in its coverage area. Thus, the attack packets collide with the packets that head toward the destination, resulting in the prevention of the source sensor from transmission. As it can be seen from the graph, the attack load rate has a direct impact on increasing the delay. The smaller packet intervals, 0.02s and 0.01s, induce the highest delay during the packet delivery to the destination. In these cases, as the attacker increases the size of the attack packets, the amount of delay increases particularly when the size reaches to 500B. By using these results to answer the first question of this research, we can imply that decreasing the intervals between the attack packets can efficiently extend the impact of the attack. The larger attack packets can degrade the WSN operation more than the smaller attack packets.
-
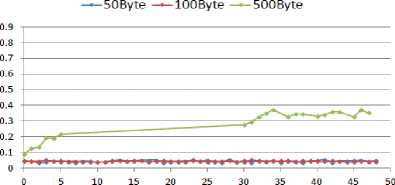
B.2 Throughput
The comparison of throughput for different attack rates when the node6 is compromised by the attacker is presented in Fig. 8.
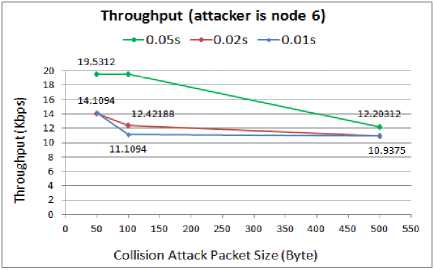
Fig. 8. Throughput for WSN with compromised node6
When the attack packet interval is 0.05s, the network can handle the smaller attack packets (50B and 100B) and throughput does not decrease. However, throughput decreases as the size of attack packets increases. The lowest performance of the WSN in term of less throughput is when the attacker transmits 500B packets at higher packet intervals, either 0.01s or 0.02. In these cases, the WSN performance degrades to about 11Kbps which is half of the normal throughput with no attacks.
-
B.3 Packet lost rate
The comparison of the packet lost rate for different attack rates when the node6 is compromised by the attacker and the amount of damage caused by the attack are presented in Fig. 9 and Fig. 10 respectively.
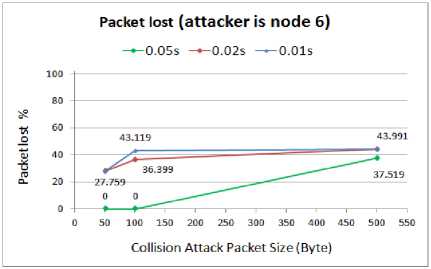
Fig. 9. Packet lost rate for WSN with compromised node6
Damage measurement (attacker is node 6)
■ 0.05s ■ 0.02s ■ 0.01s
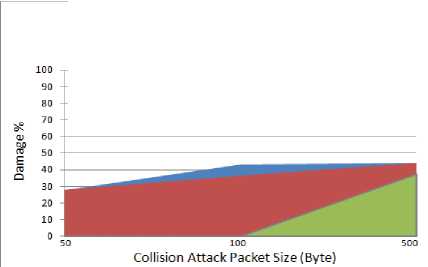
Fig. 10. Amount of damage in WSN with compromised node6
From the graphs obtained, we can conclude that for 0.02s and 0.01s attack packets intervals (50 and 100 attack packets per second respectively), the network suffers from the highest losing rate of the packets. Regardless of the attack packets size, the averages of the lost packets in these cases are similar. From these results it is concluded that to save energy and also to avoid detection, the attacker can choose a larger attack rate with smaller attack packets size or choose a smaller attack rate with larger attack packets size. This will be absolutely helpful for the attacker with limited energy resources to conduct the attack with the least energy consumption while providing massive damages.
-
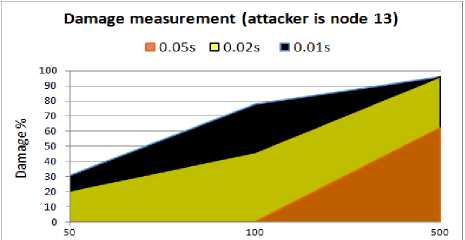
C. Experiment 3: Attacker positions at node13 (in the main route)
This experiment shows how the WSN functions when the attacker compromises the node13 and runs the collision attack from a place in the main route between the source and the destination sensor nodes. The position and coverage area by the attacker node is demonstrated in Fig. 11.
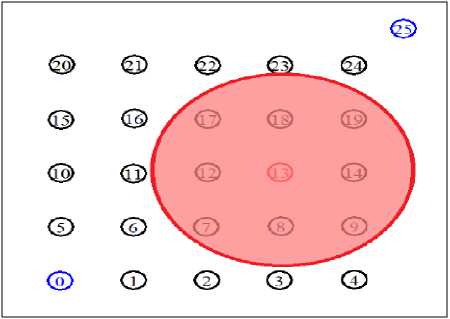
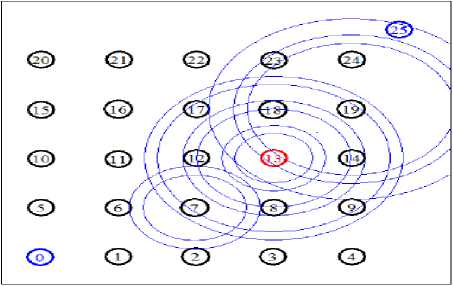
Fig. 11. Simulation environment with the compromised node13 as attacker
C.1 End-to-End delay
The comparison of delay for different attack rates when the node13 is compromised by the attacker is presented in Fig. 12.
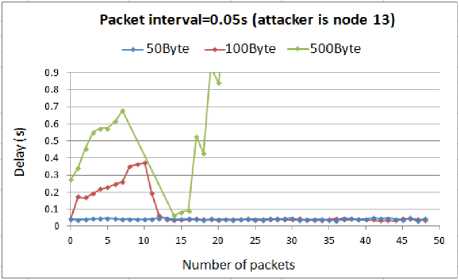
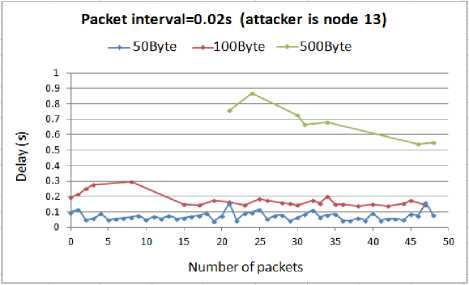
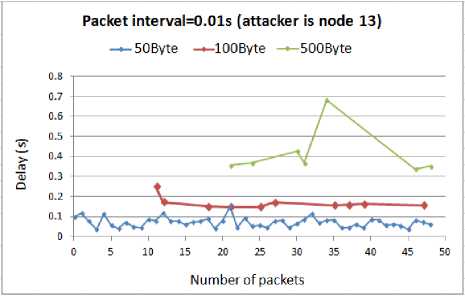
Fig. 12. Delay for WSN with compromised node13
According to the above results, as the attack rate increases the delay increases as well. There is a small difference between the delays of the smaller attack packets, 50B and 100B. As we can see, under the different attack load rates, they have a similar amount of delay. However, with 100B attack packets the graph shows gaps when there is 0.01s interval between the attack packets. The gaps exist because when the timeout of the packets expire, the packets will be lost and NS2 will not show them in the results. Like before, the highest delay belong to the 500B attack packets.
Comparing these results with the outcomes from when the attacker compromised the node6, shows that being in the route makes the attack more harmful. The amount of delay imposed to the WSN by the attacker at the node13 is much higher than being at the node6 regardless of the interval or size of the attack packets. The reason is that when the attacker is in the main route, which is used by the routing protocol (in our simulation it is AODV) to establish and maintain the connection between the sensor nodes, the malicious packets interfere with the control routing packets. In this case the attack packets collide with the routing packets resulting in the retransmission of a huge number of routing tables and control packets, hence wasting the limited system resources.
C.2 Throughput
The throughput comparison for different attack rates when the node13 is compromised is presented in Fig. 13.
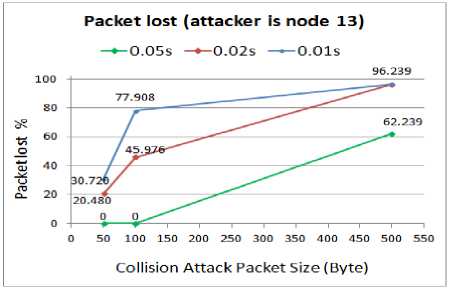
Fig. 14. Packet lost rate for WSN with compromised node13
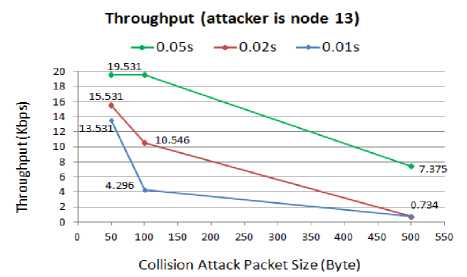
Fig. 13. Throughput for WSN with compromised node13
Collision Attack Packet Size (Byte)
Fig. 15. Amount of damage for WSN with compromised node13
According to the above results, the highest throughput for the WSN is achieved when the attacker increases the intervals between the malicious packets. In this case, with 0.05s packet interval, if the attacker transmits the smaller attack packets, either 50B or 100B, the throughput does not reduce. However, increasing the size of the attack packets will highly degrade the throughput. The WSN is slowing down to the point where it can no longer handle any data transmission. The reason is related to spending excessive time on buffering and processing of the useless fake packets. On the other hand, reducing the interval to 0.01s with 500B attack packets will practically shut down the network and bring it down to 0% throughput.
Comparing these results with the throughput outcomes when the attacker compromised the node6, confirms that being in the route makes the attack more devastating. The reason, as mentioned above, is related to the attack packets that collide with the routing packets, hence preventing from establishing or maintaining the connection between the sensor nodes to exchange data.
C.3 Packet lost rate
The comparison of the packet lost rate and the amount of damage when the node13 is compromised by the attacker are presented in Fig. 14 and Fig. 15 respectively.
From the above graphs we find that the number of lost packets during the attack is a function of the size of attack packets and their intervals. When the attacker launches the collision attack with a smaller interval (0.01s) and larger packets (500B), the attack is completely capable of shutting the WSN down, resulting in an unavailable WSN which is not accessible by the sensor nodes. A 96% packet lost rate when the 500B attack packets are transmitted with a 0.01s interval, proves the significance of the attack which completely blocks the sender node from any further activity in the WSN. Also comparing the 96% packet lost rate when the node13 is compromised with 37% packet lost rate when the node6 is compromised, confirms our previous results that if the attackers set their devices at a place in the middle of the main route between the source and destination, the attack will be a huge success rather than placing the devices near the source with the same reason as we mentioned above.
-
D. Experiment 4: Attacker positions at node18 (near the destination)
This experiment is conducted to quantify the WSN performance under collision attack starting by the attacker at position node18 which is near the destination sensor node. The position and coverage area by the attacker node is demonstrated in Fig. 16.
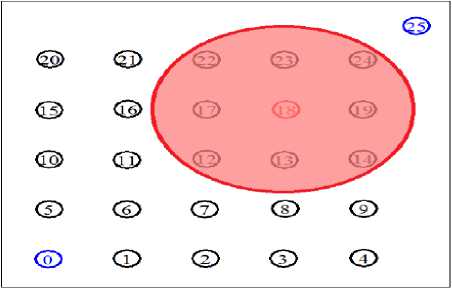
Fig. 16. Simulation environment with the compromised node18 as attacker
D.1 End-to-End delay
The comparison of delay for different attack rates when the node18 is compromised by the attacker is presented in Fig. 17.
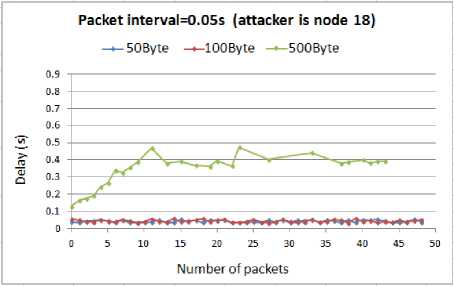
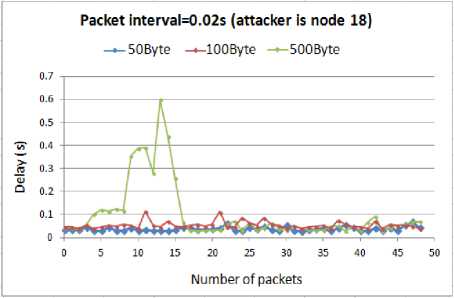
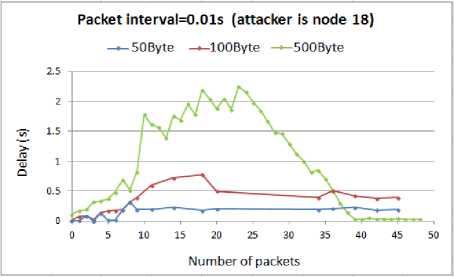
Fig. 17. Delay for WSN with compromised node18
As expected, from the above graphs it is concluded that the higher the attack rate, the more delay imposed to the WSN. However, by comparing the above results with our previous outcomes we found an exception. We observed that for the 0.05s and 0.02s attack intervals, the above results confirm all the previous outcomes that being the attacker in the route imposes the highest damage to the WSN than the other places. We expected that for all the attack rates this would be correct. However, the results show that when the interval between the attack packets is 0.01s, being near to the destination is more effective than being in the route. In this interval regardless of the size of the attack packets, the delay increases to a very higher level than when the node13 was compromised.
On the other hand, comparing the above results with the results when the attacker is near the source, indicates more performance degradation in the WSN. The reason is that when the attacker is in the coverage area of the destination, the malicious packets block it from the reception of the data so that other nodes are incapable of sending data to the destination. In contrast, being in the coverage area of the source will enable the destination node to receive data from the other nodes that are in its coverage area resulting in a better performance.
D.2 Throughput
The comparison of throughput when the node18 is compromised by the attacker is presented in Fig. 18.
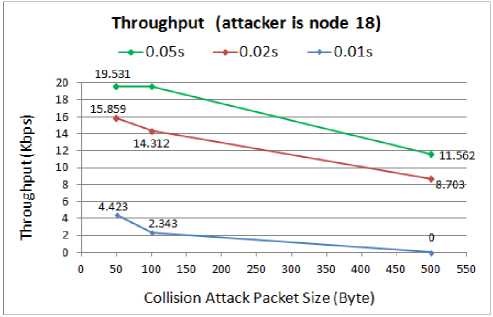
Fig. 18. Throughput for WSN with compromised node18
The above throughput graph also confirms the previous results so that by either increasing the size of the attack packets or decreasing their intervals, the throughput degrades more. For the 500B attack packets with 0.01s interval, the attacker can achieve absolute success by falling the throughput down to zero. In this case, the collision attack completely overwhelms the network and blocks the sensor nodes from any transmission. Like before, the throughput in case of 0.01s interval is less than when the compromised node is in the main route. In cases that the attackers select the larger intervals, either 0.05s or 0.02s, between the attack packets, they need to move to a position in the middle of the main route to increase the impact of the collision attack.
D.3 Packet lost rate
The comparison of the packet lost rate and the amount of damage caused by the attack when the node18 is compromised by the attacker are presented in Fig. 19 and Fig. 20 respectively.
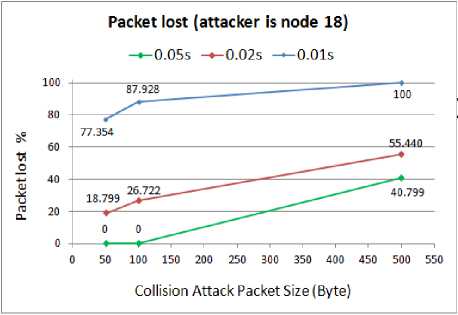
Fig. 19. Packet lost rate for WSN with compromised node18
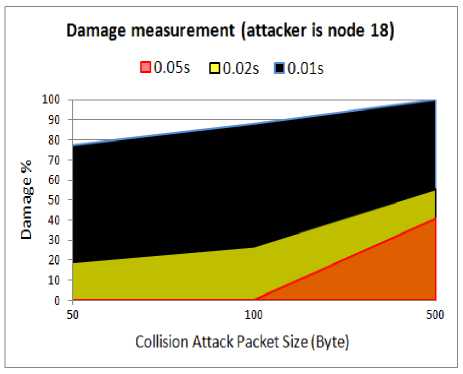
Fig. 20. Amount of damage for WSN with compromised node18
As the above results show, like before the collision attack is able to highly damage the performance of the WSN and imposes 100% packet lost. By either increasing the attack packets size or decreasing the attack packets interval, different rates of success can be achieved for the attacker.
In order to conclude this work, we use all the results and findings in our experiments to answer the three research questions as follows.
Answer to the Question1 : The answer to the first question of this research is that comparing the WSN degradation levels in terms of our metrics shows that the 500B attack packets are able to completely disable the network and prevent any authorized sensor node to exchange data in the WSN. Therefore, based on the results, it is concluded that the larger attack packets are more destructive than the smaller. However, transmission of the larger packets comes at the price of consuming more resources of the attacker while putting him in danger of being detected and identified by the IDS systems.
Answer to the Question2: The answer to the second question of this research is that from the simulation results it is concluded that the location of the attacker has a critical role to increase the efficiency of the attacks. When the attacker is in the middle of the path that connects sensor nodes to each other, the collision attack causes the highest damage to the network. After that being near to the destination and then near to the source, have the most and the least effects respectively.
Answer to the Question3 : Answer to the third question of this research was explained through the analysis of the graphs. As the interval between the attack packets decreases, the success rate of the attacker goes higher due to collision of the legal packets with the malicious packets. However, as we already discussed, the IDS systems have a detection threshold. Hence, it is important for the attacker to choose a proper interval to remain anonymous through the entire attack time.
-
V. Conclusion
This study was conducted to implement the collision attack in wireless sensor networks and evaluate the impacts of this attack on the performance of the WSNs in terms of our metrics. Through simulation of several scenarios, the performance of the WSN was measured with and without the collision attack by applying different parameters. Comparing the performance of the WSN when there is no attack with its performance under the collision attack proves that this attack is a devastating threat to wireless networks and is capable of disabling the network connectivity. The simulation results indicate that increasing the size of the attack packets and attack rate can highly degraded the performance of the WSN. We observed a severe reduction of throughput even down to 0% as the attack rate increases. The highest attack rate can effectively increase the packet lost rate dramatically up to 100%. Placing the attacker in the middle of the main route, which is generally established by the routing algorithm to connect the sensor nodes, can impose the highest damage to the WSN. The malicious attack packets destroy the routing packets which results in preventing the sensor nodes from any further data transmission.
References Damage Measurement of Collision Attacks on Performance of Wireless Sensor Networks
- R. Sharma, Y. Chaba, Y. Singh. Analysis of Security Protocols in Wireless Sensor Network, International journal of advanced networking and applications, Vol.2, No.3, pp.707-713, 2010.
- I.S. Kocher, C.O. Chow, H. Ishii, and T.A. Zia. Threat Models and Security Issues in Wireless Sensor Networks, International Journal of Computer Theory and Engineering, Vol.5, No.5, 2013.
- H.C. Chaudhari and L.U. Kadam. Wireless Sensor Networks: Security, Attacks and Challenges, international journal of networking, Vol.1, No.1, pp.04-16, 2011.
- M. Cakiroglu, A.T. Ozcerit, H. Ekiz, O. Cetin. MAC Layer DoS Attacks in Wireless Sensor Networks: A Survey, International Conference on Wireless Networks (ICWN), pp. 45-48, 2006.
- M.R. Ahmed, X. Huang, and D. Sharma. A Taxonomy of Internal Attacks in Wireless Sensor Network, international journal of World Academy Of Science, Engineering And Technology, 2012.
- M.N. Sudha, M.L. Valarmathi, G. Rajsekar, M.K. Mathew, N. Dineshraj, S. Rajbarath. Minimization of Collision in Energy Constrained Wireless Sensor Network, international jounal of Wireless Sensor Network, Vol.1, pp.350-357, 2009.
- T. Naeem and K.K. Loo. Common Security Issues and Challenges in Wireless Sensor Networks and IEEE 802.11 Wireless Mesh Networks, International Journal of Digital Content Technology and its Applications, Vol.3, No.1, pp.1-6, 2009.
- A. Pandey and R.C. Tripathi. A Survey on Wireless Sensor Networks Security, International Journal of Computer Applications, Vol.3, No.2, pp.1-7, 2010.
- K. Sharma and M.K. Ghose. Wireless Sensor Networks: An Overview on its Security Threats, International Journal of Computer Applications, Special Issue on Mobile Ad-hoc Networks MANETs, pp.42-45, 2010.
- Z. Zhang, J. Wu, J. Deng, and M. Qiu. Jamming ACK Attack to Wireless Networks and a Mitigation Approach, Proceedings of IEEE Global Telecommunications Conference Wireless Networking Symposium (GLOBECOM '08), pp.1-5, 2008.
- S. Chen, G. Yang, S. Chen. A Security Routing Mechanism against Sybil Attack for Wireless Sensor Networks, Proceedings of the 2010 IEEE International Conference on Communications and Mobile Computing (CMC '10), Vol.01, pp. 142-146, 2010,
- B. Zeng and B. Chen. SybilACO: Ant colony optimization in defending against Sybil attacks in the wireless Sensor Network, Proceedings of the 2010 IEEE International Conference on Computer and Communication Technologies in Agriculture Engineering (CCTAE'10), pp.357-360, 2010.
- Z. Zhao, B. Wei, X. Dong, L. Yao, and F. Gao. Detecting Wormhole Attacks in Wireless Sensor Networks with Statistical Analysis, WASE International Conference on Information Engineering, pp.251-254, 2010.
- P.Reindl, K.Nygard, and X.Du. Defending Malicious Collision Attacks in Wireless Sensor Networks, IEEE International Conference on Embedded and Ubiquitous Computing, 2010.
- M.S. Haghighi, K. Mohamedpour, V. Varadharajan, and B.G. Quinn. Stochastic Modeling of Hello Flooding in Slotted CSMA/CA wireless sensor networks, IEEE transactions on information forensics and security, Vol.6, No.4, 2011.
- S. Periyanayagi, V. Sumathy, and R. Kulandaivel. A Defense Technique for Jamming Attacks in Wireless Sensor Networks Based On SI, International Conference on Process Automation, Control and Computing (PACC'11), pp.1-5, 2011.
- O. Xi, T. Bin, L. Qi, Z. Jian, H. Zheng, and X. Yang. A Novel framework of Defense System Agaist DoS Attacks in Wireless Sensor Networks, IEEE International Conference on Wireless Communications, Networking and Mobile Computing (WiCom'11), pp.1-5, 2011.
- M. García and A. Población. Detection of Wormhole Attacks in Wireless Sensor Networks Using Range-Free Localization, IEEE 17th International Workshop on Computer Aided Modeling and Design of Communication Links and Networks (CAMAD'12), pp.21-25, 2012.
- L. Teng, and Y. Zhang. SeRA: A Secure Routing Algorithm against Sinkhole Attacks for Mobile Wireless Sensor Networks, IEEE International Conference on Computer Modeling and Simulation (ICCMS'10), pp.79-82, 2010.
- C. Chen, M. Song, and G. Hsieh. Intrusion Detection of Sinkhole Attacks In Large-scale Wireless Sensor Networks, IEEE International Conference on Wireless Communications, Networking and Information Security (WCNIS'10), pp.711-716, 2010.
- A. Kumar, A.Sharma, and A.Singh. Performance Evaluation of BST Multicasting Network over ICMP Ping Flood for DDoS, International Journal of Computer Science & Engineering Technology (IJCSET), Vol.2, No.12, 2011.
