Data analysis and visualization of continental cancer situation by twitter scraping

Author: Md. Hosne Al Walid, D. M. Anisuzzaman, A. F. M. Saifuddin Saif
Journal: International Journal of Modern Education and Computer Science @ijmecs
Article in issue: 7 vol.11, 2019.
Free access
With the advent of user-generated content, usability, and interoperability of web platforms, people are today more eager to express and share their opinions on the web regarding both daily activities and global issues. Cancer is often undetected, leading to serious issues which continue to affect a person's life and his surroundings. Recently Twitter has been very popular to be used to predict and monitor real-world outcomes as well as health-related concerns. Nowadays people are using social media in any situation. Even cancer patients, their friends, and family are increasingly sharing their experience in social media, which has increased the ability of patients to find others similar to their conditions to discuss treatment options, suggest lifestyle changes, and to offer support. Our work targets to link patients with a particular illness (cancer) together and to provide researchers with enriched patient data that might be very useful for future analysis of this disease. We wanted to create a meeting point for the healthcare sector and social media through our work. Our target was to collect Twitter data from different continents of the world and analyze them. We scraped tweets from over the last two years from all around the world. Then clean the data using a regular expression and then process it to prepare our own dataset. We used sentiment analysis and natural language processing to classify them into positive, negative and neutral tweets to determine which of the tweet means to have cancer and which don't. We then analyzed the prepared dataset and visualized and compared them with veritable cancer-related information to ascertain if people's tweets are allied with actual cancer situation.
Data Analysis, Data Visualization, Cancer Situation, and Twitter Analysis
Short address: https://sciup.org/15016863
IDR: 15016863 | DOI: 10.5815/ijmecs.2019.07.03
Text of the scientific article Data analysis and visualization of continental cancer situation by twitter scraping
Published Online July 2019 in MECS DOI: 10.5815/ijmecs.2019.07.03
Exploiting virtual social networks for healthcare purposes is recently named with the neologisms, Infodemiology and Infoveillance [1]. Infodemiology describes and studies health information and communication patterns for public health purpose. Infoveillance is a field of using Infodemiology data for surveillance purposes which is the use of applications where Infodemiology methods are employed [2]. Generally, data owned by healthcare industries are often accessible only with restrictions but social media data are generally publicly available, therefore they represent an enormous resource for mining interesting healthcare insights and overall situation in a geographical area.
The amount of digital health-related data is becoming more and more large, being generated by healthcare industries, social media and virtual networks, where people share their experiences and opinions about different topics, including personal health (illnesses, symptoms, treatments, side effects). The new and very useful use of social media has also led to more public disclosure of health information. For example, Lisa Bonchek Adams, a breast cancer patient, tweeted over 176,000 times with many of those tweets about her own cancer experience which helped the people a lot. There are many cancer patients, survivors, and their family members who use Twitter to find out opinions and suggestions about treatments and side effects, or as a place of support. We have visualized relationships among different features of cancers so that it can be helpful to point out specific problems and hopefully lead to a solution. Twitter has been chosen as our data source because: it has been actively used by a large number of people including patients because of the medium's ubiquity and ability to connect with health professionals and well-informed patients. Among various social networks, Twitter is the most popular micro-blogging platform which is a rich source of data for opinion mining and sentiment analysis. The lengths of tweets are restricted to 140 characters and mobile application adoption is widespread, it is generally easier to tweet about cancer compared to some other social media platforms. Every second, on average, around 6,000 tweets are tweeted on Twitter which means 500 million tweets per day and around 200 billion tweets per year.
-
II. Related Works
These have inspired us to our work. The summary of these highlighted works has been shown in Table 1.
Table 1. A summary of existing works
|
Work |
Target |
Methodology |
|
Online diagnosis of diabetes with twitter data [3] |
To develop a diabetes detecting tool at the individual level based on text analysis of social media without any medical settings. |
The feasibility of diagnosing and classifying diabetes has been investigated via machine learning techniques, Naive Bayes and Random Forest classifiers. |
|
US cancer-patient sentiments analysis by using pattern-matched Twitter [4] |
To compute the average happiness of cancer patients by using patient tweets for each cancer diagnosis. |
The tweets have been filtered by a diagnosis of cancer by using regular expression software pattern matching. The content of the tweets have been categorized and individual patients have been extracted for each cancer-specific tweet set. |
|
Analyze the Twitter in the United States for sentiment analysis of breast cancer screening [5] |
To sentiment analysis on breast cancer screening using Twitter in the United States. |
A system has been proposed where Twitter REST API has been used for the access of random subset of tweets. Tweets related to breast cancer screening published during a certain period of time have been collected by using this API and finally from each breast cancer screening tweet, some information has been extracted. |
|
Emerging topic detection from Twitter [6] |
To detect emerging topics using a keyword-based topic graph. |
A novel method has been proposed by using a keyword-based topic graph to detect emerging topics and news keywords that are popular in Twitter have been detected successfully. |
|
Real-time event detection by analyzing Tweeter data [7] |
To detect a target based on some features of tweets. |
To find the center of the event location, a system has been proposed and a probabilistic spatiotemporal model for the target event has been produced. |
|
Twitter data mining for event classification and analysis [8] |
To identify significant terms and use them for vector-space modeling of the tweets. |
An n-gram based statistical approach has been proposed to identify significant terms and used them for vector-space modeling of the tweets. |
|
Predict political elections by analyzing sentiments expressed on Twitter [9] |
To examine the predictive power of social media (especially, Twitter) using sentiment analysis methods. |
They have examined and identified convicting results in the domain of US political elections held in 2010 and also addressed the shortcomings of the used methods and outline the changes necessary for the improvement. |
|
Twitter mood predicts the stock market [10] |
To evaluate the impact of companyspecific lexicon-based twitter sentiment data. |
A system has been developed for improving the accuracy of predictions of stock exchange prices using NARX neural network. |
|
Predict the path for a disaster by mining data from the social network. [11] |
To advance disaster management by finding the direction based on Twitter data. |
A system has been developed which would be able to forecast the real-time route of the disaster after a disaster had been detected. |
|
Discovering entities' behavior through mining Twitter [13] |
To discover entities' behavior through Twitter mining. |
Two research streams have been explored: 1) analyzing firms’ behavior and 2) news readers’ behavior involving social media, in particular involving Twitter. |
|
Tweeting about mental health [16] |
To perform text analysis on Twitter public policy. |
Queries with location (obtained by IP addresses) have been used, and a probabilistic framework has been presented for quantifying spatial variation. |
|
A survey on various techniques of sentiment analysis in data mining [17] |
To perform a survey on techniques of sentiment analysis. |
Many tweets have been crawled pointing to the election in Germany, and an attempt to anticipate the results of the election has been done. |
Beside these works listed in Table I, some other works have been done on tweeter data, such as: analyzing Twitter data to find out how they spread over network [12], finding the sentiment of a sentence from a tweet [14], performing opinion mining and sentiment analysis on tweets [15], investigating the conversational aspects of retweeting on Twitter [18], predicting elections with Twitter [19], surveying the spatial variation in search engine queries [20] etc. From Table 1, we can see that a lot of works have been done on social media data (including twitter) but to the best of our knowledge, there are very few works on data analysis and visualization of continental cancer situation by twitter scraping. While there is a lot of existing work on prediction of seasonal and pandemic diseases, we wanted to make an attempt to diagnose a non-seasonal as well as a non-pandemic disease, like cancer.
-
III. System Overview
Our work stands on the basis of data analysis and visualization. The overall overview of our work is shown in Fig.1.
This work will be useful for analyzing the situation regarding cancer and where the severity is higher. As we have collected the geo-tagged tweets and analyzed with the location, authority can get an idea in which places they should emphasize more and in which cancer field the resources should be provided. Besides, we have also worked with the treatments, so towards which treatments people are approaching more and getting more benefits, diseases can be detected and improvement can be done to those fields. It can assist the medical organization in different countries to take necessary precautions and approaches because they can get an idea on which stratum of cancer they should emphasize more, which causes are leading toward cancer more because from our work we have seen that cancer types, treatments, and causes vary from countries to countries. People can avoid the causes and espouse the treatments for their betterment through our work.
needed to find out the polarity of a tweet. We have used the textblob for spelling correction. It corrects all the misspelling by itself.
-
B. Data visualization
Data visualization is the process of visualizing data, communicating information clearly and effectively. It describes and represents the abstract information in graphical form. Data visualization allows us to spot patterns, trends, and correlations that might go unnoticed in traditional reports, tables, or spreadsheets. We used Matplotlib for our data visualization. Matplotlib is a Python 2D plotting library which produces publication quality figures in a variety of hardcopy formats and interactive environments across platforms. For simple plotting, the pyplot module provides a MATLAB-like interface, particularly when combined with IPython.
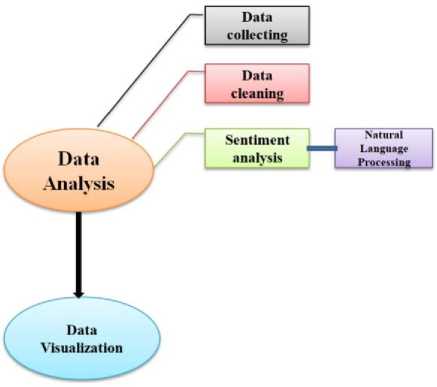
Fig.1. System Module
-
A. Data Analysis
-
IV. Implementation
Here we have described the process of our system implementation. Our first step was scraping where we have collected tweets using Twitter Scraper over the last two years. Then we have cleaned the data using a regular expression, and then we have concatenated all the json files in csv file. Finally, we have analyzed the data and visualized the data. The workflow of our system implementation is shown in Fig.2.
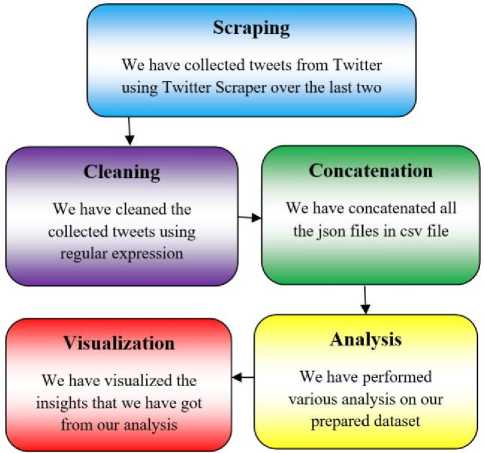
Fig.2. System Implementation
-
A. Scraping
We have used TwitterScraper to collect data from Twitter. The keywords we have searched are Cancer, Carcinoma, Melanoma, Sarcoma, Lymphoma, Teratoma, and Leukemia. We have collected tweets from the last two years using TwitterScraper. By using these keywords we have collected tweets from all over the world. We have scraped tweets from 195 countries of 7 continents. After the scrapping, we got several json files for the types that we have searched for. For each country, we got several types. For example, we have got these 7 types of cancer tweet datasets for Bangladesh:
-
1) Bangladesh_cancer_tweets,
-
2) Bangladesh_melanoma_tweets,
-
3) Bangladesh_lymphoma,
-
4) Bangladesh_leukemia_tweets,
-
5) Bangladesh_carcinoma_tweets,
-
6) Bangladesh_sarcoma_tweets, and
-
7) Bangladesh_teratoma_tweets json files.
We didn't always get all of these seven types for each country because it totally depended on the tweets people posted. We have received 7json files at the maximum that varied from countries to countries.
-
B. Cleaning
The data collected by us had many unnecessary parts and contained a lot of unnecessary information. These unstructured forms of tweets were not idle for further processing. So we have cleaned the data using Regular Expressions. Initially, we have received the tweets with unnecessary links or tags or with extra white spaces, and even sometimes we see repetitions of a particular tweet. Using RE we have removed: Links, Retweet, Tags (@Names), and Extra white spaces. We have ensured that the data is in the right format for the next stages. By using Timestamp we have separated the ‘month' from our collected data set. This way, we have cleaned our json files and got the cleaned csv files.
-
C. Concatenation
First, we have loaded the contents of the json files and then saved it as a csv file. Converting these json files into csv files was needed to retrieve simple data as lists or rows with some columns. The csv format is better than json file for better operability, because: less bandwidth needed and data processing is faster. Then we have concatenated all the csv files for one country into a one single csv file using the panda's data frame. We have implemented the process again for concatenating all csv files for all the countries of a continent into one single csv file for that particular continent.
Dataset
We have collected all the tweets, cleaned them and then prepared our own dataset. The total number of tweets of our dataset is 2, 48,648. We have further analyzed and visualized from all these two lakhs fortyeight thousand six hundred and forty-eight tweets which were related to cancer.
Adding sentiment of tweets to loaded Dataframe
We have used Textblob to perform sentiment analysis. We have accessed the tweets from the data frame one by one using a simple loop. Then we have performed the spelling correction. And finally, we have measured the polarity of the tweets to classify them into positive, negative and neutral. Textblob has a training set with preclassified reviews. When we have a new text for analysis, it uses Naïve Bayes classifier to classify the new text's polarity in positive and negative probabilities. We have added a sentiment to the tweets loaded to the data frame. We have used textblob to measure the polarity of the tweets by considering the following rules:
-
• If the polarity of the tweet i >=0.1, we have considered the tweet as a positive tweet.
-
• If the polarity of the tweet i <= -0.1, we have considered the tweet as a negative tweet.
-
• The range between 0.1 to -0.1 is considered a neutral tweet.
Tweets often contain misspelling which can be a barrier to our analysis. To get rid of this we have used the spell corrector functionality of textblod which automatically replaces the misspelling data with correct spelling.
-
D. Analysis and Visualization
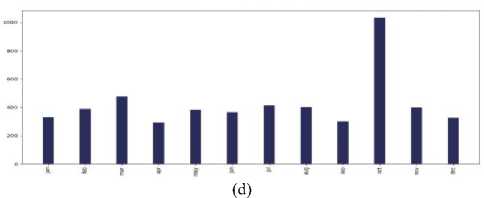
Checking and plotting different cancer types in tweets
There are over 200 different types of cancer, and each is classified by the type of cell that is initially affected. We have taken 21 cancer types for our work purpose. They are listed in Fig.3.
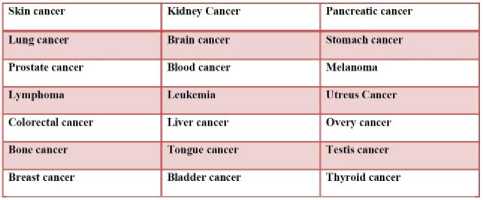
We have taken a list to hold the counts of each type of cancer. After that, we have plotted this using matplotlib. It produces a bar chart with title and xticks.
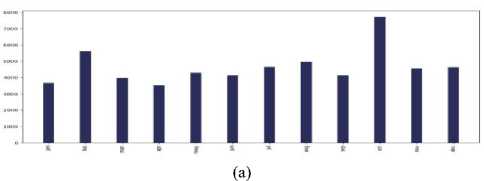
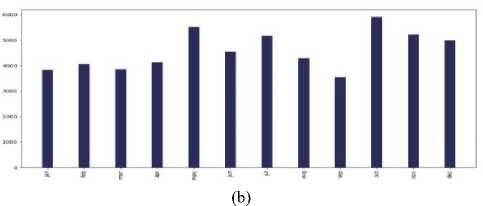
Counting the tweet distribution over months
We have created a list to hold the tweet counts in each month and visualized with matplotlib. In X-axis we have the months and in Y-axis we get the number of tweets-months. We get 12 references of the same list for 12 months.
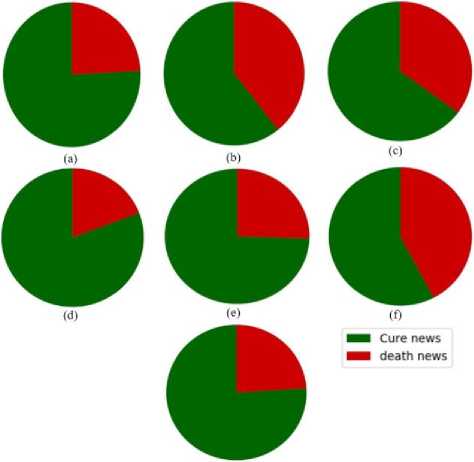
Checking cure news and death news in tweets
For cure news, we have searched for words like "treatment", "cure", "cured" etc in the data frame and counted that. By the same way we have searched for “die”, “death”, “kill”, etc for getting the death news. After that, we have created a pie chart and plotted them.
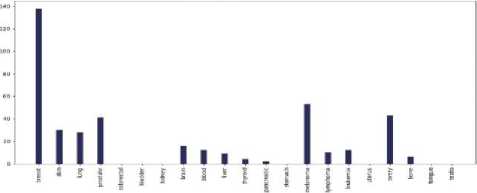
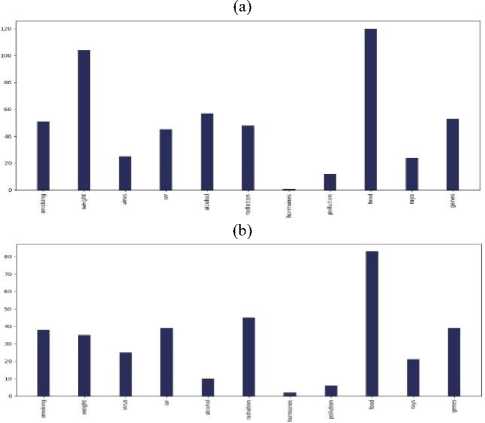
Plotting Cancer Causes in each continent
Cancer is a complex group of diseases with many possible causes. We have considered 11 causes of cancer: Smoking, Hormones, Genes, Weight, Pollution, Food, Virus, Alcohol, Rays, UV, and Radiation. We have taken a list of 11 references and counted the mentioned causes in the negative and neutral classes and then plotted them with appropriate bar graph.
Plotting Cancer Treatments in each continent
Survival rates are improving for many types of cancer, thanks to improvements in cancer screening and cancer treatment. We have used 9 popular cancer treatment names: Radiotherapy, Chemotherapy, Surgery, Targeted therapy, Hormone therapy, Stem cell transplant, Gene therapy, Cell transfer therapy, and Bone marrow transplant. We have searched for these treatments in our dataset for a particular continent and counted them. Then we have created a pie-chart showing the percentages of these treatment methods used for that continent. We have taken a list of 9 references for the 9 treatment methods and counted the mentioned treatment method in the negative and neutral classes and then plotted them with a pie chart.
(c)
(d)
-
V. Data Visualization and Result Analysis
Depending on different criteria data visualization has been done on our prepared dataset. We have analyzed our result of visualization in details here.
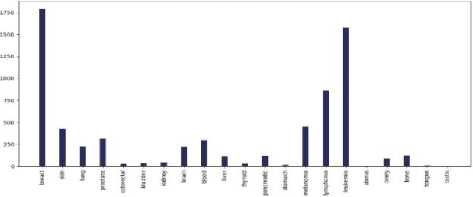
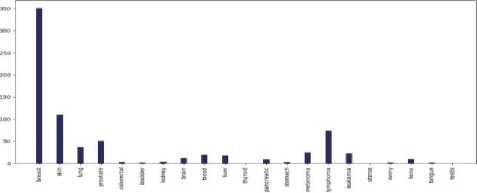
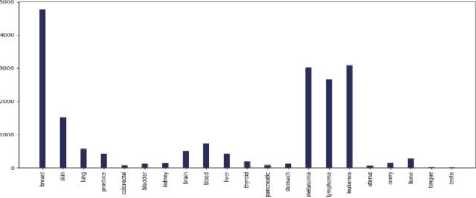
A . Visualization and Analysis of different cancer types count vs the number of tweets in each continent
(e)
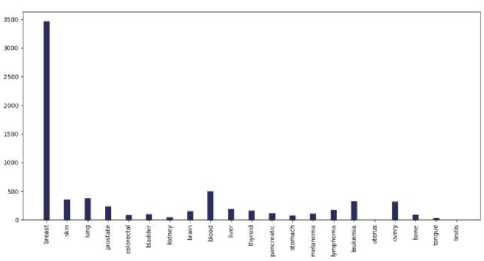
(a)
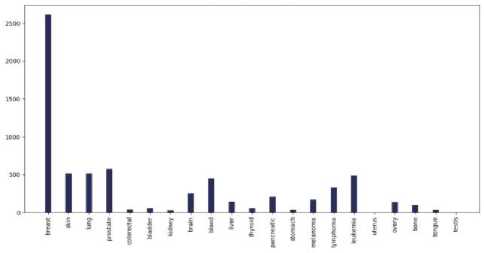
(b)
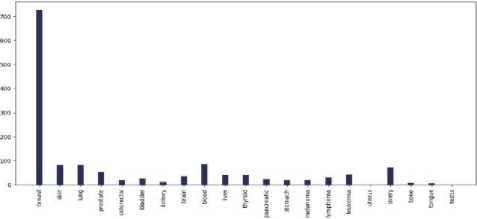
Fig.4. Different cancer types vs the number of tweets in the countries of 7 continents: (a) Asia, (b)Europe, (c) North America, (d) South America, (e) Africa, (f) Australia, and (g) sub-continental countries
(f)
Do most tweeted cancer types and authentic cancer types relate?
According to National Cancer Institute (NCI), the most common cancers (listed in descending order according to estimated new cases in 2018) are breast cancer, lung and, prostate cancer, melanoma of the skin, bladder cancer, lymphoma, kidney, leukemia, thyroid cancer, and liver cancer [21]. From our work, we can see that for each and every continent the most profound tweeted cancer type was "Breast Cancer” from each and every continent and the rest of the cancer types match approximately. As we can see both the data match moderately. So we can say that people actually post about cancer quite meticulously.
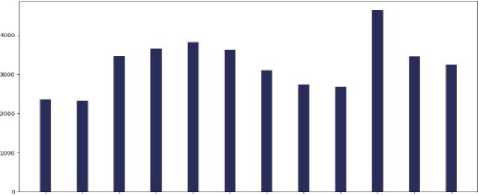
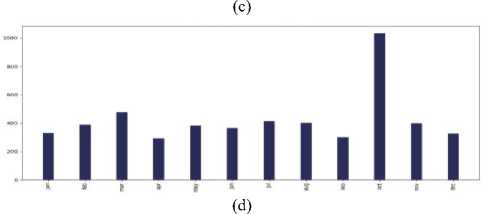
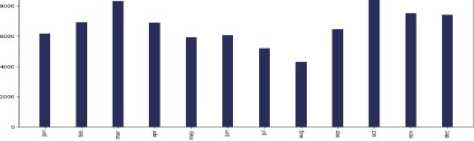
B . Visualization and Analysis of tweets over a month vs the number of tweets
1$!1Г а*££55$
(e)
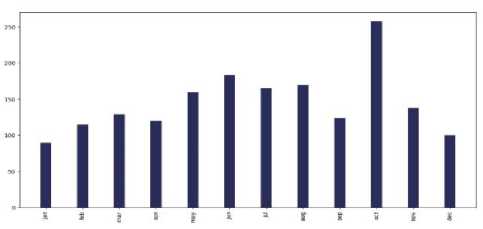
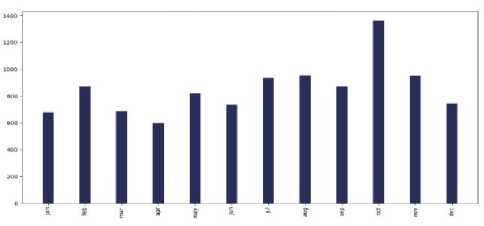
Fig.5. Months (last two years) vs the number of tweets in the countries of 7 continents: (a) Asia, (b) Europe, (c) North America, (d) South
America, (e) Africa, (f)Australia, and (g) sub-continental countries
Which month was extensive for cancer-related posts?
The interesting observation was that for each and every continent - Asia, Europe, North America, South America, Australia, Africa, and Subcontinental countries; in the month of "October" people tweeted about cancer the most. The reason behind it can be that October is celebrated as Breast Cancer Awareness Month.
C . Visualization and Analysis of cure rate vs the number of tweets in each continent
(g)
Fig.6. Percentage of tweets about cure vs death in the countries of 7 continents: (a) Asia, (b) Europe, (c) North America, (d) South America, (e) Africa, (f) Australia, and (g) sub-continental countries
Is the cure rate greater than the death rate veritably?
Annual statistics reporting from the American Cancer Society shows the death rate from cancer in the US has declined steadily over the past 2 decades. The cancer death rate for men and women combined fell 23% from its peak in 21 years (1991-2012) [22]. From our work, we have discovered that for all six continents number of tweets for the cure was more than death for cancer. For North America, Europe, and Australia the death rate was more than Asia, South America, Africa, and Sub continental countries but for each of them, the cure rate is high. Another very fascinating observation was that according to the National Cancer Institute (NCI), an estimated 1,735,350 new cases of cancer will be diagnosed in the United States and 609,640 people die from the disease in 2018. That's a 35% death rate and a 75% cure rate according to this data. Our pie chart for cure vs death rate for North America indicted the same ratio for 2016 and 2017 combined. So we can see that with our analysis is accurately relatable with the veritable statistics.
D . Visualization and Analysis Main causes of cancer vs the number of tweets in each continent
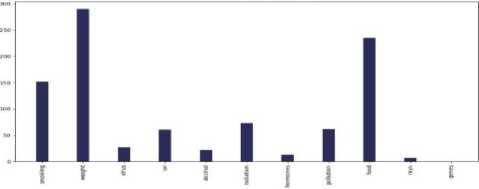
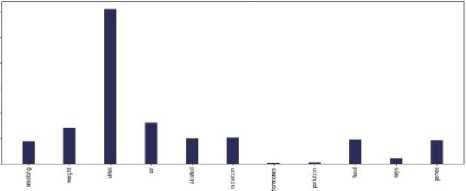
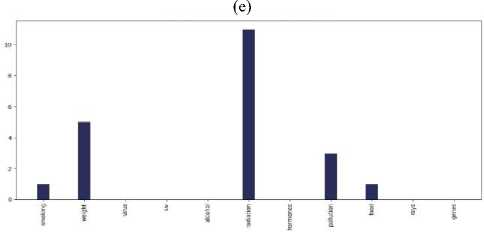
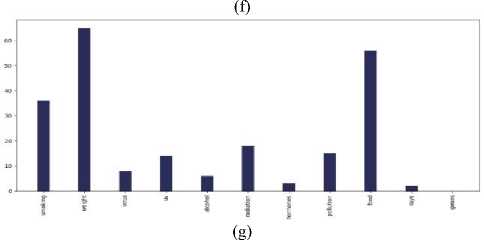
Fig.7. Main causes of cancer vs the number of tweets in the countries of 7 continents: (a) Asia, (b) Europe, (c) North America, (d) South
America, (e) Africa, (f)Australia, and (g) sub-continental countries
(c)
Do most tweeted cancer causes and authentic cancer causes relate?
According to Wikipedia tobacco/smoking is responsible for 25–30% of cancer deaths, pollution is, food is (30– 35%), infections /virus (15–20%), and radiation up to 10% [23]. Most tweets regarding main causes lie between – smoking, weight, food, virus, and radiation for each continent. The percentage varies from continent to continent but more or less they are relatable with the information of Wikipedia. According to Cancer Research UK, around 33% of cancer cases are caused by smoking worldwide [24]. Our bar chart of different continents has more or less allied with the statistics. So we can say that the tweets are relatable with actual references.
E . Visualization & Analysis Cancer treatments vs the number of tweets in each continent
Most profound treatment tweets?
Except for Australia, most tweeted treatment method was "surgery" in each continent. All the other treatment types’ like- radiotherapy, chemotherapy, targeted therapy, hormone therapy, gene therapy, etc are more or less present in each continent. The percentage varies from continent to continent and as treatment is quite distinctive.
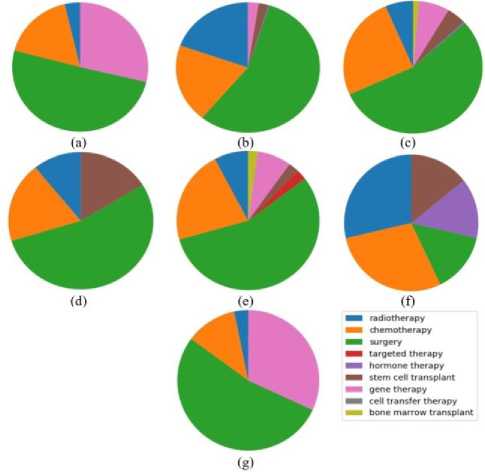
Fig.8. Percentages of common cancer treatments in the countries of 7 continents: (a) Asia, (b) Europe, (c) North America, (d) South America,
(e) Africa, (f) Australia, and (g) sub-continental countries
In our work, we have considered all of the continents of the world for collecting tweets and thus we have better surveillance of people's point of view over the cancer situation all over the world. At first, we have collected cancer-related data using twitter scraper over the last 2 years from Twitter. We have collected tweets from all over the world and cleaned the data using regular expression and apply sentiment analysis to know which of the tweets were talking about having cancer and which are not. We have further analyzed the data and visualized them using matplotlib. Then we have visualized and compared them with veritable cancer dataset to ascertain if people's tweets are allied with actual cancer situation or not.
Our work can be beneficial to people who are currently dealing with this deadly disease, going through diagnosis or chemotherapy, they can get an idea about the treatments that have worked for others. People can avoid the causes that have already led other towards cancer.
-
VI. conclusion and Future scope
"What is the prevalence of cancer across the world's population?" Our aim was to find the answer to this question. We have tried to visualize and acquire an idea about the consciousness of people about cancer. We didn't use any actual medical record hence our result is totally based on people's point of view and how they react or deal with this disease on a popular social platform. In the future, we want to create our own training and testing data set, so that we can train the classifiers. Textblob provides in-build classifiers module to create a custom classifier. By this process, we will be able to collect tweets/ data that are actually related to cancer (disease). Irrelevant tweets can be avoided in this way. We have only scraped English tweets for our work purpose. We will try to implement the translation mechanism and use other languages in the future.
References Data analysis and visualization of continental cancer situation by twitter scraping
- Eysenbach, G.: Infodemiology and Infoveillance. Am. J. Prev. Med. 40(5), S154– S158 (2011). http://dx.doi.org/10.1016/j.amepre.2011.02.006.
- Gunther Eysenbach, MD, MPH, Centre for Global Health Innovation, Consumer & Public Health Informatics Lab, University Health Network, 190 Elizabeth Street, Toronto M5G 2C4 Canada.
- Achrekar, Harshavardhan, Avinash Gandhe, Ross Lazarus, Ssu-Hsin Yu, and Benyuan Liu. "Predicting flu trends using Twitter data." In Computer Communications Workshops (INFOCOM WKSHPS), 2011 IEEE Conference on, pp. 702-707. IEEE, 2011.
- Crannell, W. Christian, Eric Clark, Chris Jones, Ted A. James, and Jesse Moore. "A pattern-matched Twitter analysis of US cancer-patient sentiments." journal of surgical research 206, no. 2 (2016): 536-542.
- Wong, Kai O., Faith G. Davis, Osmar R. Zaïane, and Yutaka Yasui. "Sentiment Analysis of Breast Cancer Screening in the United States using Twitter." In KDIR, pp. 265-274. 2016.
- Cataldi, Mario, Luigi Di Caro, and Claudio Schifanella. "Emerging topic detection on Twitter based on temporal and social terms evaluation." In Proceedings of the tenth international workshop on multimedia data mining, p. 4. ACM, 2010.
- Sakaki, Takeshi, Makoto Okazaki, and Yutaka Matsuo. "Tweet analysis for real-time event detection and earthquake reporting system development." IEEE Transactions on Knowledge and Data Engineering 25, no. 4 (2013): 919-931.
- Azam, Nausheen, Muhammad Abulaish, and Nur Al-Hasan Haldar. "Twitter data mining for events classification and analysis." In Soft Computing and Machine Intelligence (ISCMI), 2015 Second International Conference on, pp. 79-83. IEEE, 2015.
- Chung, Jessica Elan, and Eni Mustafaraj. "Can collective sentiment expressed on twitter predict political elections?." In AAAI, vol. 11, pp. 1770-1771. 2011.
- Bollen, Johan, Huina Mao, and Xiaojun Zeng. "Twitter mood predicts the stock market." Journal of computational science 2, no. 1 (2011): 1-8.
- Jain, Saloni, "Real-Time Social Network Data Mining For Predicting The Path For A Disaster." Thesis, Georgia State University, 2015
- Zhao, Yanchang. "Analysing twitter data with text mining and social network analysis." In Proceedings of the 11th Australasian Data Mining and Analytics Conference (AusDM 2013), p. 23. 2013.
- Tran, Hung Viet, "Discovering entities' behavior through mining Twitter." Ph.D. (Doctor of Philosophy) thesis, University of Iowa, 2012
- Ficamos, Pierre, and Yan Liu. "A topic-based approach for sentiment analysis on Twitter data." International Journal of Advanced Computer Science and Applications 7, no. 12 (2016): 201-205.
- Gokulakrishnan, Balakrishnan, Pavalanathan Priyanthan, Thiruchittampalam Ragavan, Nadarajah Prasath, and AShehan Perera. "Opinion mining and sentiment analysis on a Twitter data stream." In Advances in ICT for emerging regions (ICTer), 2012 International Conference on, pp. 182-188. IEEE, 2012.
- Zaydman, Mikhail. Tweeting About Mental Health: Big Data Text Analysis of Twitter for Public Policy. The Pardee RAND Graduate School, 2017.
- Zalak M. patel, Vishal P. Patel, "A Survey on Various Techniques of Sentiment Analysis in Data Mining", International Journal of Engineering Development and Research 2015 Volume 3, Issue 4 | ISSN: 2321-9939.
- Boyd, Danah, Scott Golder, and Gilad Lotan. "Tweet, tweet, retweet: Conversational aspects of retweeting on Twitter." In System Sciences (hicss), 2010 43rd Hawaii international conference on, pp. 1-10. IEEE, 2010.
- Tumasjan, Andranik, Timm Oliver Sprenger, Philipp G. Sandner, and Isabell M. Welpe. "Predicting elections with Twitter: What 140 characters reveal about political sentiment." Icwsm 10, no. 1 (2010): 178-185.
- Backstrom, Lars, Jon Kleinberg, Ravi Kumar, and Jasmine Novak. "Spatial variation in search engine queries." In Proceedings of the 17th international conference on World Wide Web, pp. 357-366. ACM, 2008.
- National Cancer Institute: Cancer Statistics. Available at:https://www.cancer.gov/about-cancer/understanding/statistics [Accessed November 15, 2018].
- American Cancer Society: Cancer Statistics Report. Available at:https://www.cancer.org/latest-news/cancer-statistics-report-death-rate-down-23-percent-in-21-years.html [Accessed November 22, 2018].
- Wikipedia: Causes of cancer. Available at: https://en.wikipedia.org/wiki/Causes_of_cancer [Accessed November 27, 2018].
- Cancer Research UK: Together we will beat cancer. Available at: https://www.cancerresearchuk.org [Accessed December 05, 2018].
