Data Content Weighing for Subjective versus Objective Picture Quality Assessment of Natural Pictures

Author: Suresha D, H N Prakash
Journal: International Journal of Image, Graphics and Signal Processing(IJIGSP) @ijigsp
Article in issue: 2 vol.9, 2017.
Free access
Estimating the visual quality of picture is a real challenge for various picture and video frame applications. The aim is to evaluate the quality of picture automatically in both subjective (human visual frame work) and objectively. The quality of picture is evaluated by comparing precision and closeness of a picture with reference or error free picture. The quality estimation can be done to achieve consistency in desired quality of picture with help of modeling remarkable physiological, psycho visual components framework and picture fidelity measure methods. In this article, the picture quality is evaluated by analyzing loss of picture information of the distortion system using differing noise models and examine the relationship between picture data, visual quality and error metric. The quality of picture & video frame assessment is really important that, every human can judge the visual quality of natural picture. The subjective quality of picture is assessed by using structural similarity metric, objective quality of picture is computed by root means squared error, mean squared error and peak signal to noise ratio and data content in picture is weighted through entropy.
Gaussian, Local Variance, Poisson, Salt and Pepper, Speckle, Structural SIMilarity, Mean Squared Error, Root Mean Squared Error, Peak Signal to Noise Ratio, Entropy
Short address: https://sciup.org/15014163
IDR: 15014163
Text of the scientific article Data Content Weighing for Subjective versus Objective Picture Quality Assessment of Natural Pictures
In recent years, digital picture (DP) / video frame (VF) handling is a noteworthy field of examination in the region of computer science and communication engineering. It is subsequently increased in developing the interest of picture and video administrations. Be that as it may, advanced picture handling experience the ill effects of inherent noise from their phase of capturing [1], compressing[2], encoding[3], communication[4], decoding and processing stages[5]. This noise appearance will change the normal arrangement of original data in DP/VF signal.
The rest of this paper is organized as follows: The section 2 discusses the detailed literature survey, section 3 illuminates proposed architecture with different noise function and comparison of picture contents. The observations and performance analysis are discussed in section 4 with SSIM, Entropy, MSE, RMSE and PSNR finally we have summarized the article in the section 5.
-
II. Literature Review
Examination of picture quality is fundamental in several areas of digital picture processing. The picture quality calculations are broadly classified into two categories, first category uses a reference or clear picture for comparison with generated picture and second category calculates data content in generated picture.
The superiority of generated picture in first category of PQA is decided by accuracy or differences generated by picture with reference picture. These computation metrics on quality of picture are divided into objective PQA computation and subjective PQA computation metric. The objective PQA computation will not consider HVF while designing metrics, instead they use pixel by pixel differences, square of their differences, absolute differences between pixels or maximum signal to noise ratio. The objective of these calculation is to have very low value for difference i.e. zero for perfect generated image and very high value for maximum signal to noise ratio i.e. infinity for perfect generated picture. The state of art calculations such as MSE, RMSE, mean absolute error (MAE) and PSNR generally used in measuring objective PQA. These category of calculation fit well for signal processing domain, but needs to be improved for picture processing classes where human can judge the visual quality of picture. The subjective PQA depends on human visual quality metric, which is hard to put into calculation[8][10] but these quality metric has been tried with structural similarity metric[18]. The subjective PQA use SSIM calculation and aim to achieve 1.0 for perfect construction image.
The quality of generated picture in second category of PQA is determined by equalizing data content in generated picture with reference picture. The calculations on these category measure statistical arbitrariness in picture surface which is calculated by EnT of a picture.
Many researchers have used the different quality metrics to prove their performance in achieving the high quality of picture. The author of [2] have discussed compression technique on DCT based picture compression in which PSNR is used to measure the performance of generated pictures over JPEG and JPEG2000. In designing mathematical model[3] for the noise in binary coding of multiplexed signals in imaging system signal to noise ratios are used in deciding performance. In designing post processing of JPEG-2000 low bit rate compression technique have been discussed in[5] to eliminate coding artifacts in which PSNR is used as a standard for deciding quality. The author of [6] have discussed the pre-processing of mammogram pictures for breast cancer detection in which picture quality is decided through MSE, PSNR, structural content(SC) and normalized absolute error(NAE). The quality of satellite pictures after their increase in resolution[10] are quantitatively compared through PSNR and picture visual content for demonstrating their superiority. The identification of enemy targets in synthetic aperture radar pictures are discussed in [11] which elaborates with more accuracy with binary image matching method for estimation of the clear target. The author of [19] increased the rate of identification of picture through unique identifier generation, which is the fusion of entropy with features of picture. For comparing the quality of super resolution picture with reference picture RMSE, MSE, PSNR are used in [21] and MSE,PSNR, EnT and Q-INDEX are used in [22]. The picture resolution up-sampling technique in [23] use PSNR with visual picture to decide the quality of generated up sampled picture.
The many researchers have used objective PQA calculation in presenting their quality results. But evaluating the quality of picture automatically in both subjective and objectively must be done to achieve the high quality of picture. The quality of picture should be assessed by objective PQA, subjective PQA and data content weighing. This paper focus on using various noise models on natural pictures and its implication on objective, subjective quality measures along with their data content.
-
III. Proposed Architecture of Experimentation
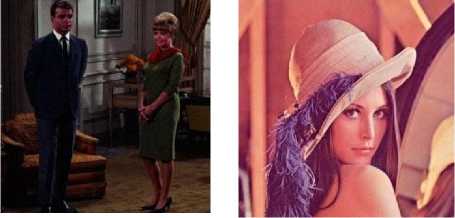
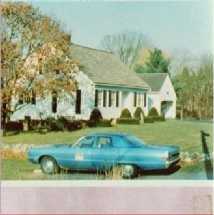
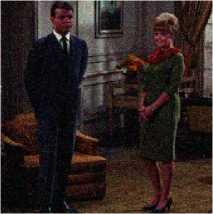
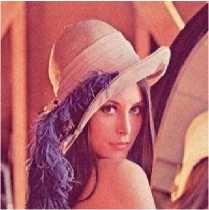
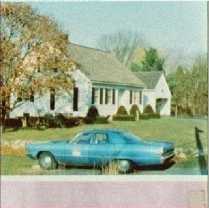
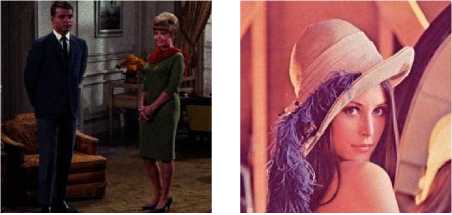
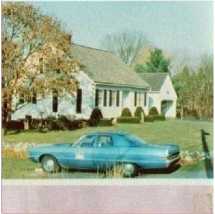
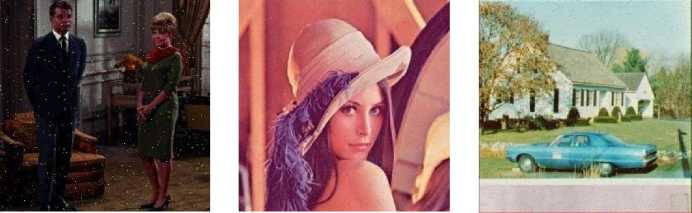
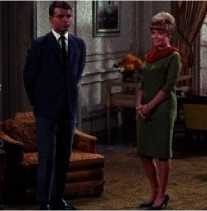
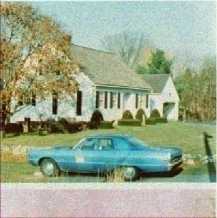
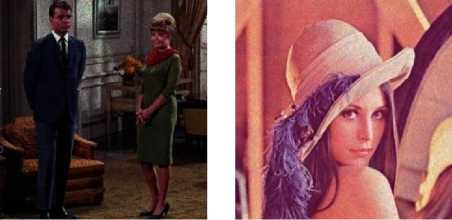
The proposed architectural design of data content weighing for subjective versus objective PQA is shown in Fig. 1. The experimentation setup receives reference natural picture (NaP) shown in Fig. 7 as an input to noise function (NoF) and results in noisy picture (NoP) as shown in (1). The data details of NaP and NoP are weighed by statistical measure of irregularity EnT, the HVF of NaP and NoP is measured by SSIM and objective quality by RMSE, MSE and PSNR.
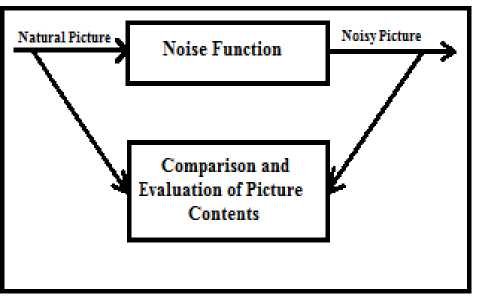
Fig.1. Proposed design of experimentation
NaP is subjected to NoF results in NoP as depicted in
N0P = N0F(NaP) (1)
The NoF considered for experimentation are Ga, Lv, Po, S&P and Sp noise types discussed in section B.
A. Notations Used
The notations used in this article are described in table 1 as follows.
G
√
-(ΝР-μ)
е ⧸ 2V
Table 1. Notations used in the article
|
Notation |
Explanation |
|
NaP |
Natural Picture |
|
NoP |
Noisy Picture |
|
HVF |
Human Visual Framework |
|
PQA |
Picture Quality Assessment |
|
Ga |
Gaussian |
|
Lv |
Local Variance |
|
Po |
Poisson |
|
S&P |
Salt and Pepper |
|
Sp |
Speckle |
|
SSIM |
Structural Similarity |
|
MSE |
Mean Squared Error |
|
RMSE |
Root Mean Squared Error |
|
PSNR |
Peak Signal to Noise Ratio |
|
EnT |
Entropy |
|
NAE |
Normalized Absolute Error |
|
SC |
Structural Content |
|
MAE |
Mean Absolute Error |
B. Noise Function
Noise function produces and describes undesirable data in digitized pictures, for example artifacts, farfetched edges, concealed lines, corners and obscured objects by disturbing background details. To minimize these undesirable impacts, prior learning of different noise function is fundamental for effective handling of NoP. Advanced noises might emerge from different sources through different sensors. The noise from sensors are modelled through probability density function (PDF)[14] or histogram. Hence the different noise models which are applied on NaP for experimental result as follows.
Gaussian(Ga) Noise:
It is a white electronic distortion during signal amplification or recognition. Ga is brought by normal sources like vibration of particles and radiation of objects. Ga aggravates the pixel values in computerized pictures. That is why Ga basically designed and characterized by normalizing histogram with pixel value.
Ga shown in (2)[14] includes mean µ and variance Va of NaP. For experimentation 0 µ noise with 0.02 and 0.03 times of Va is considered and its comparison is tabulated in table 3 & 4 respectively.
Local variance(Lv) Noise:
It is a special Ga noise[13] to a NaP. Lv of the noise function is the function of normalized image intensity value of NaP.
Poisson(Po) Noise:
The presence of this noise in picture is because of statistical property[15] in electromagnetic waves. For example, visible light, x ray and gamma ray. The gamma and x rays source radiates the number of photons. These radiated photons are measured in unit time. The radiated rays are infused into patient body from their generation, in medical imaging frameworks. The patient body make irregular change to photons in the radiated rays. Results accumulated picture will have spatial with transient irregularity. This noise is additionally termed as quantum, photon or shot noise. These noise are created from picture as opposed to add fake noise to the picture. Probability distribution function(Podf) by poisson distribution is given by (3).
Podf ( д = )= ʎ (ʎ - ) k=0,1,2,... (3)
In (3) ∂ is a positive parameter measured as a count of photons given by sensors in time interval n . ʎ is the expecting count of photons in time interval n. ∂ is directly related to the incident location irradiance. The Podf with ʎt refers to the expecting incident photon measure.
{ 255 probability 1
0 probability2 (4)NaP 1-Total probability
Speckle (Sp) Noise:
This is a multiplicative noise[17] to the picture NaP. The Sp is observed in imaging framework like laser, radar and acoustics and so forth. Speckle noise can exist comparative in an picture as Ga noise. Its likelihood follows gamma distribution, Noise function of Sp is portrayed by (5).
Sp= ɳmul*NaP+ ɳadd (5)
Where NaP is Natural Picture and ɳ will be uniformly distributed random noise where ɳmul is multiplicative and ɳadd is additive constant. For experimentation, 0 mean noise with 0.02 and 0.03 times of variance is considered.
-
C. Measurement metric of Picture
PQA tries to measure a visual quality of picture, a measure of distortion in a given picture. These distortions are inescapable part of any digital picture handling phase of acquiring, compressing, encoding, transmission, deciphering and processing stages.
Objective PQA
The objective PQA measures a contrast between two pictures and the outcome can be comprehended with level of errors between pictures. Their measure is public, effectively computable by legitimate distance metric and gives consistent understanding of picture similarity. As all result of this MSE, RMSE and PSNR turned into a convention[21][22][23] in objective PQA.
The mathematical formulation for MSE, RMSE and PSNR[9] are represented by (6), (7) and (8) respectively.
MSE
3 п-1 т-1
∑∑∑( NaP ( х , У , z )- NoP ( x , У , z )) 2
z=l y=0 x=0
wℎere S =3
m :
n:
RMSE = √MSE(7)
PSNR = 10 l°9« S(8)
Mx: Maximum valuе of gray lеvеl of ріхеl(255)
Based on various experimental observation, the objective PQA doesn't give much information to human perceived quality of picture. This prompted endeavours to make measures, whose performance would be firmly identified with the human perception of visual appearance.
Modelling Human Visual Framework
The contrast between pictures does not quantify the distortion. It attempts to characterize the model of human visual framework (HVF)[18][9]. The main correct technique for assessing the human perceived visual quality of pictures is the assessment by people.
Unfortunately, such method is not usable in progressive applications. Hence, there is a requirement for an automated technique, that would predict the human-perceived visual quality as close as expected under the above circumstances.
In this framework all parts of HVF were absolutely modeled and exact prediction of subjective picture visual quality of picture which would be most likely accomplished. Exact modeling of HVF is difficult to achieve, because HVF is very complicated framework with a lot of nonlinearities. SSIM is a measure in view of the assumption that HVF is adjusted to extract structural information from the field of perspective. With these, the change of basic structural information amongst distorted and original picture could be a good estimation of observed picture distortion. SSIM works well if it utilized locally and contrasts the pixel-to-pixel like objective PQA. SSIM is scientifically figured according to the (9) is collected by a comparison of luminance, contrast and structure of NaP and NoP in grey level. First, the luminance is compared by a function I(NaP, NoP) of mean intensities μNaP and μNoP, Contrast comparison is a function c(ΝаР, ΝоР) of standard deviations S dNaP,SdNoP and variances V aNaP , V aNoP , Finally, structure comparison is a function s(ΝаР, ΝоР)of correlation between the NaP and NoP of standard deviations S dNaP,SdNoP with dNaP,NoP .
I ( NaP , NoP )= 2µ NaP µ NoP + c µNaP+µNoP+c1
C ( NaP , NoP )= 2S dNaP S NoP + c 2-,VaNaP +VaNoP+c2
S( NaP , NoP )=SS- S , + ъ
S S + c
SSIM
=( NaP , NoP ) “c ( NaP , NoP ) ^s ( NaP , NoP ) y
Where
α>0, β>0 and γ>0
SSIM
(2µNaP µNoP + c1) (2SdNaP,NoP +c2)
(µ NaP+µNoP+c1 ) (V aNaP +VaNoP +c2)
μ NaP : Mean of NaP
μ NoP : Mean of NoP
К : Variance of NaP aNaP
Vf : Variance of NoP aNoP
S dNaP : Standard deviation of NaP
Sdpj : Standard deviation of NoP aNoP
^d.MnP : Standard deviation of NaP and NoP ,
Ci , c2 and c3 : The stabilizing variables for division with weak denominator
-
D. Evaluation of Picture Contents
Entropy(EnT) is a statistical calculation for arbitrariness[19][20] in characterizing input picture surface. EnT is characterized by (10) as
EnT= -sum(p.*log2(p)) (10)
where p contains the histogram counts
-
IV. Experimental Observations and Discussion
The NaP pictures for experimentation shown in Fig.7. The experimentation is led on dataset[24] for estimation of PQA. Table 2 is the tabulation of EnT of the input NaP pictures shown in Fig. 7 calculated as per (10).
Table 4. Statistics of Ga noise with 0 mean and 0.03 times of variance
|
Picture |
SSIM |
MSE |
RMSE |
PSNR |
EnT |
|
1.tiff |
0.8521 |
24.5115 |
4.9509 |
34.2371 |
7.1885 |
|
2.tiff |
0.9029 |
13.0878 |
3.6177 |
36.9622 |
6.4672 |
|
3.tiff |
0.7544 |
41.7774 |
6.4635 |
31.9214 |
7.8135 |
|
4.tiff |
0.8113 |
37.9993 |
6.1644 |
32.3330 |
7.5989 |
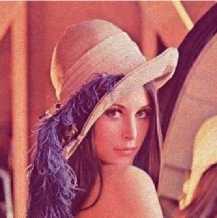
The NaP pictures shown in Fig. 7 are subjected to Lv noise with 0.01 random noise, resultant noisy pictures are displayed in Fig. 10. The pictures of Fig. 7 are contrasted with noisy pictures Fig. 10 as per (6)-(10) and tabulated in table 5.
Table 5. Statistics of Lv noise with 0.01 random noise
|
Picture |
SSIM |
MSE |
RMSE |
PSNR |
EnT |
|
1.tiff |
0.5672 |
56.9777 |
7.5484 |
30.5738 |
7.1406 |
|
2.tiff |
0.5732 |
47.5187 |
6.8934 |
31.3622 |
6.3194 |
|
3.tiff |
0.5450 |
64.1639 |
8.0102 |
30.0579 |
7.8379 |
|
4.tiff |
0.6108 |
64.1656 |
8.0103 |
30.0578 |
7.6949 |
The analysis table 5 on SSIM and PSNR reveals that even though the subjective SSIM is high but its objective PSNR is low for picture 4.tiff when compared to picture 3.tiff of subjective SSIM and objective PSNR.
The NaP pictures shown in Fig. 7 are subjected to Po noise as per (3) resultant noisy pictures are displayed in Fig. 11. The pictures of Fig. 7 are contrasted with noisy pictures Fig. 11 as per (6)-(10) and tabulated in table 6.
Table 2. Statistics of EnT for NaP
|
NaP |
EnT |
|
1.tiff |
6.8981 |
|
2.tiff |
6.2945 |
|
3.tiff |
7.7502 |
|
4.tiff |
7.4858 |
Table 6. Statistics of Po noise
|
Picture |
SSIM |
MSE |
RMSE |
PSNR |
EnT |
|
1.tiff |
0.8686 |
24.1362 |
4.9129 |
34.3041 |
7.2207 |
|
2.tiff |
0.9316 |
14.6803 |
3.8315 |
36.4634 |
6.5031 |
|
3.tiff |
0.7400 |
44.5790 |
6.6768 |
31.6395 |
7.8017 |
|
4.tiff |
0.7158 |
50.3413 |
7.0952 |
31.1116 |
7.6605 |
The analysis of table 6 on SSIM and PSNR reveals that the subjective SSIM is in-line with objective PSNR.
Table 3. Statistics of Ga noise with 0 mean and 0.02 times of variance
|
Picture |
SSIM |
MSE |
RMSE |
PSNR |
EnT |
|
1.tiff |
0.8923 |
17.1797 |
4.1448 |
35.7806 |
7.1934 |
|
2.tiff |
0.9299 |
9.0492 |
3.0082 |
38.5647 |
6.4818 |
|
3.tiff |
0.8148 |
31.3242 |
5.5968 |
33.1720 |
7.8022 |
|
4.tiff |
0.8605 |
27.9207 |
5.2840 |
33.6715 |
7.5766 |
|
Picture |
SSIM |
MSE |
RMSE |
PSNR |
EnT |
|
1.tiff |
0.7789 |
1.1612 |
1.0776 |
47.4815 |
6.9200 |
|
2.tiff |
0.7796 |
0.9008 |
0.9491 |
48.5847 |
6.3224 |
|
3.tiff |
0.7743 |
1.2777 |
1.1304 |
47.0665 |
7.7626 |
|
4.tiff |
0.8127 |
1.2608 |
1.1228 |
47.1244 |
7.4956 |
The analysis of table 7 on SSIM and PSNR reveals that even though the subjective SSIM is high but its objective PSNR is low for picture 4.tiff when compared to picture 1.tiff of subjective SSIM and objective PSNR.
Table 8. Statistics of Sp noise with 0.02 density
|
Picture |
SSIM |
MSE |
RMSE |
PSNR |
EnT |
|
1.tiff |
0.8373 |
33.9324 |
5.8252 |
32.8247 |
7.2059 |
|
2.tiff |
0.9398 |
16.7352 |
4.0909 |
35.8945 |
6.4381 |
|
3.tiff |
0.5744 |
74.6813 |
8.6418 |
29.3987 |
7.7500 |
|
4.tiff |
0.5153 |
84.6488 |
9.2005 |
28.8546 |
7.7567 |
Table 9. Statistics of Sp noise with 0.03 density
|
Picture |
SSIM |
MSE |
RMSE |
PSNR |
EnT |
|
1.tiff |
0.7848 |
41.7593 |
6.4621 |
31.9233 |
7.2142 |
|
2.tiff |
0.9174 |
21.6677 |
4.6549 |
34.7727 |
6.4375 |
|
3.tiff |
0.5073 |
82.9405 |
9.1072 |
28.9431 |
7.7192 |
|
4.tiff |
0.4558 |
91.4773 |
9.5644 |
28.5177 |
7.7286 |
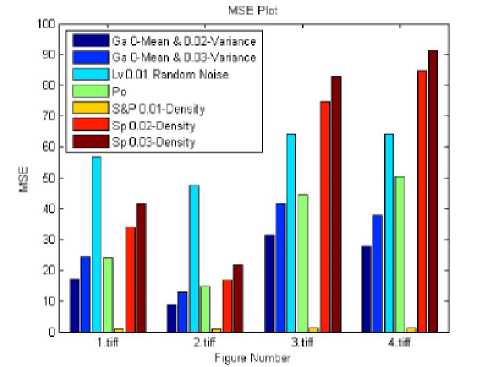
Fig.3. MSE comparison plot of table 3 - 9
Each parameter comparisons from all the tables are represented in-terms of graph in which the result of parameter of one tables with same parameter of other table as shown in the Fig 2 - 6.
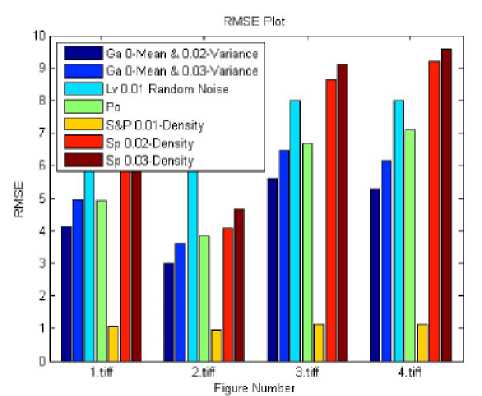
Fig.4. RMSE comparison plot of table 3 - 9
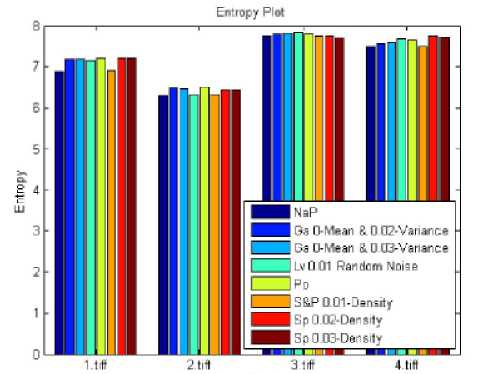
Figure Lumber
Fig.2. Entropy comparison plot of table 2 - 9
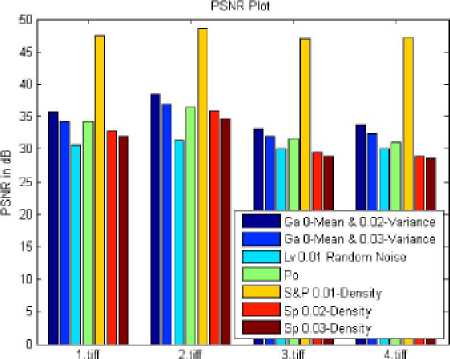
Figure Number
Fig.5. PSNR comparison plot of table 3 - 9
5ЭМ
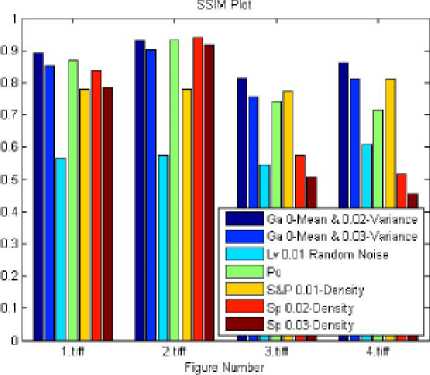
Fig.6. SSIM comparison plot of table 3 - 9
1.tiff
2.tiff 3.tiff

4.tiff

1.tiff
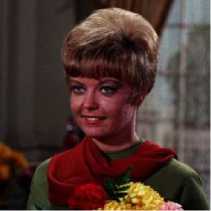
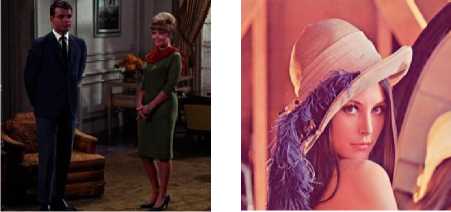
Fig.7. NaP
2.tiff 3.tiff
4.tiff

1.tiff
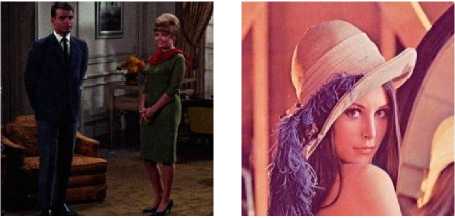
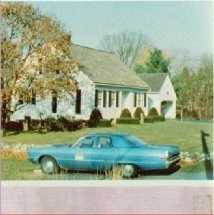
Fig.8. Noisy pictures of Ga noise with 0 mean and 0.02 times of variance
2.tiff 3.tiff
4.tiff
Fig.9. Noisy pictures of Ga noise with 0 mean and 0.03 times of variance

1.tiff
2.tiff
3.tiff
4.tiff

1.tiff
Fig.10. Noisy pictures of Lv noise with 0.01 times of random noise
2.tiff 3.tiff
4.tiff

1.tiff
Fig.11. Noisy pictures of Po noise
2.tiff 3.tiff 4.tiff

1.tiff
2.tiff
3.tiff
Fig.13. Noisy pictures of Sp noise with 0.02 density
4.tiff

1.tiff
2.tiff 3.tiff
Fig.14. Noisy pictures of Sp noise with 0.03 density

4.tiff
-
V. Conclusion
PQA is a vital issue in the field of DP /VF processing. It is still not satisfyingly comprehended and new methodologies are yet showing up. Our research work focuses on data content weighing with subjective versus objective PQA on NaP. The most utilized measures for PQA in objective and subjective domain are depicted and tested on NaP. The tests in objective domain RMSE, MSE and PSNR with subjective domain SSIM along with content weighing through EnT is demonstrated in which none of the tried strategies can be used alone for PQA functions admirably. The PQA decision should be based on combination of higher SSIM and PSNR with lower MSE and RMSE along with measurable EnT for better PQA.
References Data Content Weighing for Subjective versus Objective Picture Quality Assessment of Natural Pictures
- Ajay Kumar Boyat and Brijendra Kumar Joshi, "A Review Paper: Noise Models in Digital Image Processing," Signal & Image Processing : An International Journal (SIPIJ) Vol.6, No.2, pp. 63–75, 2015.
- Nikolay Ponomarenko, Vladimir Lukin, Mikhail Zriakhov,Karen Egiazarian, and Jaakko Astola, "Lossy Compression of Images with Additive Noise," 7th International Conference, ACIVS 2005, Antwerp, Belgium, September 20-23, pp. 381–386, 2005, DOI: 10.1007/11558484_48
- David S. Lalush, "Binary Encoding of Multiplexed Images in Mixed Noise," IEEE Transactions on Medical Imaging, vol. 27, no. 9, pp. 1323–1332, 2008, DOI: 10.1109/TMI.2008.922697.
- Claude E. Shannon, "Communication in the Presence of Noise," Proceedings of the IEEE, vol. 86, no. 2, February 1998.
- Aria Nosratinia, "Post-Processing of JPEG-2000 Images to Remove Compression Artifacts," IEEE Signal Processing Letters,vol. XX, pp. 1-1, 2002.
- R. Ramani,N.Suthanthira Vanitha,S. Valarmathy,"The Pre-Processing Techniques for Breast Cancer Detection in Mammography Images", International Journal of Image, Graphics and Signal Processing(IJIGSP), vol.5, no.5, pp.47-54, 2013.DOI: 10.5815/ijigsp.2013.05.06.
- Yubing Wang, "Survey of Objective Video Quality Measurements," The Institute for Telecommunication Science, pp. 1–7.
- Stefan Winkler and Praveen Mohandas, "The Evolution of Video Quality Measurement : From PSNR to Hybrid Metrics The Evolution of Video Quality Measurement : From PSNR to Hybrid Metrics," IEEE transactions on Broadcasting, vol. 54, no. 3, September 2008
- M. Kudelka, "Image Quality Assessment," WDS'12 Proceedings of Contributed Papers, Part I, 94–99, ISBN 978-80-7378-224-5, 2012,
- Hasan Demirel and Gholamreza Anbarjafari, "Satellite Image Resolution Enhancement Using Complex Wavelet Transform," IEEE geoscience and remote sensing letters, vol. 7, no. 1, pp. 123–126, 2010.
- Jincy.C and Rini.M.E, "Performance Analysis of Target Recognition in Synthetic Aperture Radar Images," International Journal of Advanced Research in Electrical, Electronics and Instrumentation Engineering, Vol. 5, Special Issue 2, pp. 171–175, 2016.
- S. Sakamoto and H. Mitsuoka, "Totally Mechanized Construction System for High - Rise Buildings (T-UP System)," Proceedings of the 11th ISARC, Brighton, United Kingdom, no. ii, pp. 465–472, 1994.
- "Add noise to image - MATLAB imnoise - MathWorks India." [Online]. Available: http://in.mathworks.com/help/images/ref/imnoise.html.
- R. Gonzalez and R. Woods, "Digital image processing," Prentice Hall, 2002.
- Samuel W. Hasinoff, "Photon, Poisson Noise," Computer Vision. A Reference Guide, Springer Science Business Media New York, pp. 608–610, 2014, DOI:10.1007/978-0-387-31439-6_482.
- R. H. Chan, C. W. Ho, and M. Nikolova, "Salt-and-pepper noise removal by median-type noise detectors and detail-preserving regularization," IEEE Transactions on Image Processing, vol. 14, no. 10, pp. 1479–1485, 2005.
- Jyoti Jaybhay and Rajveer Shastri, "a Study of Speckle Noise Reduction Filters," Signal & Image Processing : An International Journal (SIPIJ), vol. 6, no. 3, pp. 71-80, 2015, DOI : 10.5121/sipij.2015.6306.
- Zhou Wang, Alan C. Bovik, Hamid R. Sheikh and Eero P. Simoncelli, "Image Quality Assessment : From Error Visibility to Structural Similarity," IEEE transactions on image processing, vol. 13, no. 4, pp. 1-14, April 2004.
- Je-Ho Park and Changwon Kang, "Entropy Based Image Identifier Generation," in 2014 International Conference on IT Convergence and Security (ICITCS), 2014, pp. 1–2, DOI: 10.1109/ICITCS.2014.7021766.
- "Entropy of grayscale image - MATLAB entropy - MathWorks India." [Online]. Available: http://in.mathworks.com/help/images/ref/entropy.html.
- Suresha D, Prakash H N,"Natural Image Super Resolution through Modified Adaptive Bilinear Interpolation Combined with Contra Harmonic Mean and Adaptive Median Filter", International Journal of Image, Graphics and Signal Processing(IJIGSP), Vol.8, No.2, pp.1-8, 2016.DOI: 10.5815/ijigsp.2016.02.01
- G.Rohith and A. Vasuki, "A Novel Approach to Super Resolution Image Reconstruction Algorithm from Low Resolution Panchromatic Images," in 3rd International Conference on Signal Processing, Communication and Networking(ICSCN), 2015, no. x.
- Hasan Demirel and Gholamreza Anbarjafari, "IMAGE resolution enhancement by using discrete and stationary wavelet decomposition.," IEEE Transactions on Image Processing, vol. 20, no. 5, pp. 1458–1460, 2011.
- "SIPI Image Database - Misc." [Online]. Available: http://sipi.usc.edu/database/database.php?volume=misc. [Accessed: 25-Feb-2016].
