Data mining based framework for effective intrusion detection using hybrid feature selection approach

Author: B.A. Manjunatha, Prasanta Gogoi, M. T. Akkalappa
Journal: International Journal of Computer Network and Information Security @ijcnis
Article in issue: 8 vol.11, 2019.
Free access
Building strong IDS is essential in today’s network traffic environment, feature reduction is one approach in constructing the effective IDS system by selecting the most relevant features in detecting most known and unknown attacks. In this work, proposing the hybrid feature selection method by combining Mutual Information and Linear Correlation Coefficient techniques (MI-LCC) in producing the most efficient and optimized feature subset. Support Vector Machine (SVM) classification technique being used in accurately classifying the traffic data into normal and malicious records. The proposed framework shall be evaluated with the standard benchmarked datasets including KDD-Cup-99, NSL-KDD, and UNSW-NB15 datasets. The test results, comparison analysis and reference graphs shows that the proposed feature selection model produces optimized and most important features set for classifier to achieve stated accuracy and less false positive rate compared with other similar techniques.
Mutual Information, Linear Correlation Coefficient, Feature Selection, KDD-cup-99, UNSW-NB15
Short address: https://sciup.org/15015705
IDR: 15015705 | DOI: 10.5815/ijcnis.2019.08.01
Text of the scientific article Data mining based framework for effective intrusion detection using hybrid feature selection approach
T The complexity of current network and the intrusion of malicious traffic by intruders are critical challenges in cyber security. The hackers keen in finding the new targets and inventing sophisticated tools to sneak-in and break the cyber defense system. Development of effective, efficient and flexible IDS system is essential for today’s traffic pattern apart from traditional security models. The aim of this work is to develop an anomaly-based IDS that is accurate in detecting attacks, with low false alarm rate, and able to handle large-scale data.
Proposing the optimized feature selection techniques by using the Mutual Information and Linear Correlation Coefficient techniques in producing the most optimized features set for classification. Mutual Information method quantifies the information available on two random variables aka features and attack class types in IDS system. Similarly, Correlation Coefficient method produces the subset by eliminating the redundant or correlated data with other features [5].
The rest of the paper described as follows. Section 2 provides the detailed literature survey for the proposed model, several papers are reviewed and analyzed for the related work, and specific baseline paper [2] chosen for the proposal. The design and implementation of proposed model is discussed in Section 3, this block also contains the algorithms and flowcharts defined for the model, system requirements, implementation approach, etc. Results are outlined in Section 4 and discussed in detail about the feature numbers, accuracy result, comparison summary, etc. Section 5 is on conclusion part and further enhancements options involved with the proposed system.
-
II. Related Work
Numerous research has been carried out in enhancing the IDS by implementing the efficient feature selection techniques, classification algorithms, and system evaluation by using the various offline and real time network traffic data including the decades old KDD’99 and to the recent UNSW-NB15 dataset [21, 22]. Related models and authors proposals, their design, results and comparison analysis are discussed below in building the IDS system.
Feature or attribute selection process extracts the reduced and most accurate features in classifying the network data thereby increasing the accuracy, detection rate and performance of the system. The feature selection algorithms are categorized into filter, wrapper and hybrid. Filter method identifies and extracts a feature subset by given evaluation criteria, wrapper method by utilizing the learning algorithms, and the hybrid by using the combination of both.
Authors Mohammed A. Ambusaidi and Priyadarsi Nanda proposed filter based feature selection approach [2] and were successful in reducing the feature subset to 19 out of 41 by adapting the Mutual Information technique. Similarly, author achieved 17 features by using the Linear Correlation Coefficient technique. The performance accuracy achieved 99.9% for the given dataset. The feature selection was performed for the UNSW NB15 dataset by authors Tharmini Janarthanan and Shahrzad Zargari [1]. Author’s utilized Weka machine learning techniques to analyze the features, the experimental results prove the reduced feature set, and improvement in performance. Nour Moustafa, Jill Slay discussed about the significant features of KDD Cup 99 and UNSW-NB15 datasets in their work [2,9,22]. The author’s uses the Association Rule Mining algorithm for their work, and the comparison results shows that the accuracy is better in KDD-Cup-99, and low false alarms rate with UNSW-NB15 dataset. Wanfu Gao, Liang Hu, Ping Zhang, et.al, notices the ignorance of the dynamic change of selected features with the class, and addresses this issue by implementing the DCSF (Dynamic Change of Selected Features) technique [14] by using the conditional Mutual Information techniques.
Information Gain (IG) based feature reduction along with Random Forest and Partial Decision Tree classification are adapted in building the IDS system by authors Zheni Stefanova, Kandethody Ramachandran [12]. Results shows that the IG method reduced the features to 11 {20, 22, 18, 17, 19, 7, 9,15,11,16, 21} from 41 original features, and performance accuracy above 95%. Similarly, Mohamed Bennasar, Yulia Hicks and Rossitza Setchi’s proposed Normalized Joint Mutual Information Maximization (NJMIM) and Joint Mutual Information Maximization (JMIM) methods for feature selection and there by building the IDS system [3]. Author proves that the new method maximizes the candidate feature information, which involves in producing the selected feature for subset.
The Mutual Information based greedy feature selection technique by Battiti [3] produces the best optimal subset, but it also opens debate on the value associated with the parameter β. These limitations are discussed and modifications are adapted by N. Hoque, D. K. Bhattacharyya, J. K. Kalita [6]. The combination of feature-feature and feature class mutual information is used to find most relevant and optimized subset.
-
B. Mazhar et. al [2], propose the hybrid model for feature selection by combining the filter and wrapper based approaches [5]. The threat detection and prevention is done by authors Sanjay Kumar, Ari Viinikainen, and Timo Hamalainen [11] with their Machine Learning Classification Model in building the Network Based Intrusion Detection System. Similarly, author B. Seijo-Pardo, et. al [15] propose homogeneous and heterogeneous approaches in reducing the features for IDS system. Author thinks that the combination of the outputs of several model is better than the individual model [8]. Mariem Belhor and Farah Jemili proposed Genetic Fuzzy System (GFS) model in optimizing the
IDS classification problems [16], these models able to produce better accuracy results. The proposed method achieved 21 features and classification accuracy of 98.7 percent.
Based on the above review, the feature selection is very critical task in achieving the objective, with increased accuracy and detection rate. Some techniques have good detection accuracy with moderate level of feature selection capability, more research needs to be done in feature selection area in achieving the goals.
This paper, along with experimental results represents proposed method has improved feature numbers along with classification accuracy. Section III defines the enhancement work by combining the MI and Linear Correlation Coefficient techniques. The system shall be evaluated for KDDCup99, NSL KDD and UNSW-NB15 data records [9,21,22]. Proposed system shall be implemented using the Netbeans environment - Java programming language, Java MI, LCC, Weka, and SVM packages in building the IDS system. In section IV, the system results are presented, and also are reviewed with other existing models.
-
III. Proposed System
In the proposed model, Mutual Information theory concepts and Linear Correlation Coefficient techniques are combined in selecting the most relevant features with minimum redundancy. The Mutual Information techniques analyses the relation between the features and class labels, then the subset features are directed to linear correlation coefficient techniques to find correlations between the selected features in fine-tuning the final feature set. Finally, the SVM classification component, classifies the dataset specific to attack class types. The independent algorithms built and validated for the MI-FS, LCC-FS, and combinational MI-LCC-FS and LCC-MI-FS techniques. In phase 1 of the hybrid model, initial subset is defined, and directed to phase 2 to get the most relevant and non-redundant features.
-
A. System Flow
Intrusion Detection System consists of data input, data preprocessing, feature reduction and classification phases. As described in the proposed system framework flow as shown in Fig.1, KDD-Cup-99, NSL-KDD and UNSW-NB15 datasets will be used to build and evaluate the system [10]. The data pre-processing performs the data encoding and data normalization operations, are needed for fast and accurate processing of the dataset. Symbols in the original dataset were encoded with respective numeric values in the data encoding phase, and data normalization puts data in normalized range from 0 to 1, so the biasing of the bigger and smaller values of data will be eliminated in the dataset. Min-max normalization technique is used in our proposed model for data normalization, equation (1) below is used to perform normalization for the encoded dataset. In the feature selection process, all four feature selection techniques including MI-FS, LCC-FS, MI-LCC-FS and LCC-MI-FS are implemented and evaluated for the best optimal subset. The proposed algorithms were briefly described and discussed along with other functionality in the following sections.
Z - Z min
Znorm =------------ (1)
Z max - Z min
Z is original and Znorm is normalized value, Zmin and Zmax are the minimum and maximum values in Z.
-
B. Attribute Selection
The original feature set may not be appropriate in detection of anomaly because it will increase the points of interest utilize, data dimensionality and CPU usage [19]. More features increase the training time required, and difficult in processing the task. Attribute / feature selection reduces the dataset size by eliminating the redundant and irrelevant features and their corresponding data records. The Mutual Information and Linear Correlation Coefficient based techniques are considered here in producing the optimized feature subset.
-
C. MI-FS - Mutual Information (MI) based Feature Selection:
This method evaluates the dependency between the features and output classes, and produces non negative value output, value 0 means variables are independent. Mutual Information concepts are derived from the Shannon’s information theory, to quantify information available across two random variables [18]. Let two continuous random variables given as X = {x1, x2, ..., xn} and Y = {y1, y2, ..., yn}, where n will be the dataset records size, the resulted Mutual Information value across the variables X and Y is derived from the following equation 2.
I ( X , Y ) = H ( X) + H (Y ) - H ( X , Y ) (2)
H(X) and H(Y) are information entropies, measures the uncertainty of two random variables for the variables X and Y . H(X,Y) is joint entropy for the given random variables of X and Y. The Mutual Information for the two discrete variables are defined by the following equation (3).
I ( X , Y ) = -J J P ( x , y ) log P ( X , У ) dxdy (3)
xy p ( x ) p ( y )
where,
p(x) and p(y) are marginal density functions p(x,y) is joint probability density function
The summation notation of the same is as below equation (4).
From n number of features, C attack class labels, D dataset, and feature set F = {f1, f 2, · · · f n} , this method reduces the original feature set to subset S by calculating Mutual Information across candidate feature fi and class labels C .
-
D. LCC-FS - Linear Correlation Coefficient based Feature selection:
The correlation coefficient measures the linear dependence between the two random variables, used when data network records are linearly associated. For any two random variables, their correlation coefficient indicates the magnitude of the relationship between the two variables and it is equal to the quotient of their covariance and the product of their standard deviations. The correlation coefficient p(X,Y) for two discrete random variables X = {x1, x2, . . . , xn} and Y = {y1, y2, . . . , yn} for the dataset samples is given by the below equation (5) [5].
p ( X , Y ) = - XY ax^y
E i n = i ( xi - X )( yi - Y )
J E :.(xi - X ) 2 Z n = 1 ( yi-Y ) 2
where cov(X, Y) is covariance between random variables σx and σy are the standard deviations
The correlation coefficient value is within the range [0, 1], the relationship is strong when value of correlation coefficient p (X, Y) is closer to 1 or -1, and similarly relationship is weak if the value is nearer to zero. The data related with appropriate feature set and class labels are used in calculating the correlation of the given input. Many researchers consider the correlation among traffic samples to distinguish normal traffic from abnormal.
-
E. Hybrid Model:
In MI-LCC-FS hybrid model, output of the subset processed from the MI [Algorithm 1] is passed on to the LCC process [Algorithm 2] in finding the most optimized feature set. The MI-FS reduces the original feature set to optimized set by applying the calculation of mutual information across candidate feature fi and class labels C . The Mutual Information MI (C, fi) is calculated for preprocessed dataset records by using the JavaMI package library. The redundancy term which is the right hand side of the equation (6) will be used in maximizing the term and achieving the minimum redundancy. MI-FS selects the feature that maximizes I(C; fi), that is the class C carries the amount of feature information f and is corrected by deducting the amount proportional to the MI with the feature selected before.
The MI-FS is an enhanced version of Battiti’s MIFS, which eliminates the parameter β by the reciprocal of number of subset involved. The reduced feature subset list helps in the phase 2 and also minimizes the search range from original set to the features preselected.
g fi ∈ F ; I1I ∑ MR (6)
MI(C; fi) contains the quantity of knowledge that candidate feature fi carries about the class label C. Equation (7) [7] is used to calculate Minimum Redundancy (MR) of candidate feature fi and selected feature fs .
MI ( fi ; fs )
MR =
MI ( C ; fi )
In MR term, if fi and fs are comparatively very dependent with respect to MI(C; fi), the feature fi contribute to the redundancy.
Similarly, Zcorr equation (8) [8]is used to select a feature that maximises the LCC(fi;C) and to produce most relevant and non-redundant features.
Zcorr = argmax( LCC ( C ; fi )) - ∑ MR
LCC ( fi ; fs )
MR =
LCC ( C ; fi )
Where, LCC(X,Y) the correlation coefficient for two discrete random variables X = {x1, x2, . . . , xn} and Y = {y1, y2, . . . , yn} for the dataset samples is given by the below equation (10).
n ( xi - X )( yi - Y )
LCC ( X , Y ) = i = 1 (10) ∑ i n = 1 ( xi - X ) 2 ∑ i n = 1 ( yi - Y ) 2
The goal of the combined approach is to get the best and optimized subset of features S = {s1, s2, ..., s|S|}, where |S| is the number of selected features. The initial feature set output Fs shall be directed to Phase 2 for to achieve the optimized feature subset.
In addition to the KDD-Cup-99 dataset, the NSL-KDD and UNSW-NB15 dataset records are used to find the optimal feature set and for the classification.
Algorithm1 MI-LCC-FS: MUTUAL INFORMATION TO LINEAR CORRELATION COEFFICIENT BASED FEATURE S ELECTION TECHNIQUE.
if(MI((fi;C)=0) then discard fi,
Nf =Nf -1;
end fi = argmax (MI),
F = F – fi
Fs = Fs U fi argmax(MI) = 0;
Nf = Nf - 1;
end while F != NULL do
Calculate ZMI in Equation (6) to find fi, where fi∈F, i=1,2,3... Nf if(ZMI > 0) then
Fs = Fs U fi;
Nf = Nf - 1;
end end end
{Fs, is feature subset, and Nf is feature count from MI-FS method which will be passing onto LCC method to get optimal subset list}
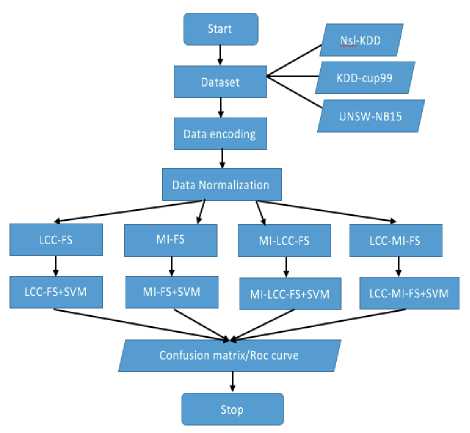
Fig.1. Hybrid Feature Selection System framework
The first for loop in above algorithm finds the Mutual Information across class label C and the candidate feature fi. In the second for loop, the MI of zero values and associated candidate feature fi shall be discarded, as those data shall not contribute onto the subset list. The positive values of MI data will be evaluated and stored for the further processing. The while loop removes the redundant features from the relevant features selected from the previous blocks, it uses the equation (6) to calculate the ZMI. The loop shall be executed for all remaining candidate features fi. MR term in above equation is relative minimum redundancy for the feature fi against feature fs, candidate feature fi belongs to complete subset F and selected feature fs belongs to subset features S. If the calculated value of MI (C; fi) is 0, then the current candidate feature fi must be discarded without further computation. The features selection process will be validated by ZMI value.
-
• If ZMI = 0, feature fi shall be removed from subset S, this is because the candidate feature fi is irrelevant to the given class C .
-
• If ZMI >0, feature fi shall be added to the subset list, this is because candidate feature fi is relevant and is important to the class C .
-
• If ZMI <0, feature fi shall be removed, this causes reduction in MI because 2nd term is larger than the first term.
The intermediate subset features list Fs will be sorted and associated data records will be pass onto LCC-FS in phase 2 in fine tuning to get the final optimized feature set.
Phase 2 of the MI-LCC-FS described in the Algorithm 2, uses the Zcorr equation in (8) to eliminate the redundant and irrelevant features from the initial subset list Fs . The LCC(fi.C) term computes the correlation between the candidate feature fi and class label C shall be computed using the equation (10) in the first for loop and stores the result for further usage. The non-zero data of LCC (fi; C) shall be extracted to form the initial feature. The while loop in the algorithm evaluates the equation [8] for to fine tune the relevant features and to eliminate the redundant features from the initial subset. This loop shall execute and evaluate for all remaining candidate and selected features. Like in ZMI, phase 2 feature finalization shall be validated based on Zcorr value. The fi shall be removed from subset S if Zcorr is zero, fi shall be added when Zcorr is above zero. Similarly, feature fi shall be removed if Zcorr is below zero, this is because feature fi is redundant to the class C , and provides duplicated information.
The subset features list S will be sorted and associated data records will be pass onto SVM classification task for classification activity.
Similarly, in LCC-MI-FS hybrid model, phase 1 is LCC-FS and phase 2 shall be MI-FS. MI techniques evaluated and extracts most optimal subset from LCC output.
Algorithm2 MI-LCC-FS: PHASE2 CONTINUE...
{Phase2: Final Optimized Feature Subset Selection by using LCC-FS method}
Nf =Nf -1;
end while (F != NULL) do
Calculate Zcorr in Equation(8) to find fi, where fi∈F, i =1,2,3... Nf if(Zcorr > 0) then
S = S U fi;
Nf =Nf-1;
end end
Result: S - Optimal subset,
Sort S according to the Zcorr of each selected feature.
Return S end
{The output Subset - S - will be used for classification activity}
-
F. Classification
After subset of features is chose optimally from feature selection process, the Support Vector Machine(SVM) technique is applied to categorize the data records [4,13]. SVM is invented by Vapnik and Chervonenk, is a supervised learning algorithm, it is one of the powerful technique for classification. The dataset created out of the selected features and their respective class labels were used to build the training model for the classification. SVM is effective for large number of features and data, represents the data in space, with clear gap data is divided into separate categories. New incoming data is then similar into same space or it belong to other category based on which side of the gap they fall. This SVM handles binary classification problems, builds multiple classifiers for multiple classes. Uses one-versus-all and one-versus-one techniques in dealing with multiple classes. Divides M classes into M binary problems, and handled by separate binary classifier as shown in Fig.2. The classification as normal and attacks, and subclass for attack types when test dataset is applied to the proposed model. SVMs achieves significantly higher search accuracy than traditional query.
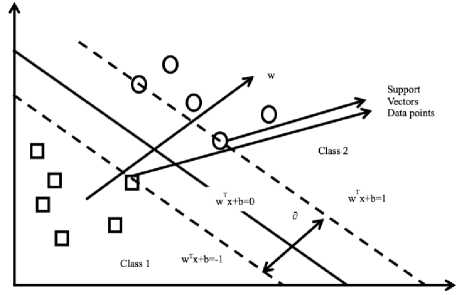
Fig.2. SVM margins of boundaries
SVM can be implemented by using the LIBSVM libraries. We just need to call the functions with appropriate parameters in building the system. In the proposed system, classification model reads the labelled dataset generated after feature selection process and builds a hyperplane in the given dataset space to distinguish data into multiple classes as shown in Fig.2.
If linear separation occurs among the training examples, then there occurs a pair (w,b) that fulfills either one of equation (11)(12).
w T xi + b > 1ifyL = 1 (11)
w T Xj + b < - 1 if y = - 1 (12)
In equation value leads to positive class or negative class as shown in equations (11) (12).
In proposed model, for multiple classes across the multiple dataset records, multiple binary SVMs to be created. So, to distinguish between normal data and abnormal data is applied to the proposed IDS technique called one versus all in the SVM method. If classifier determines that the records as abnormal, attack types are determined to find the exact predictions. The confusion matrix presents actual versus predicted classes for the classification results as shown in below equations.
Confusion Matrix
|
Predicted attack |
Predicted normal |
|
|
Actual attack |
TP |
FN |
|
Actual normal |
FP |
TN |
Different performance metrics are derived from the results of confusion matrix variables. Following are terms used in find the performance of the classifier.
TP is True positive, FP is False positive, FN is false negative and TN is True negative in the confusion matrix are used to find the accuracy in equation (13), detection rate in equation (14), false positive rate in equation (15) as shown.
-
• Classification Accuracy: Ratio of correctly
classified instances and the total number of instances.
Accuracy
TP + TN
TP + TN + FP + FN
-
IV. Results and Analysis
The proposed IDS system was built by using the Java programming language, NetBeans IDE program development environment, and JavaMI, WEKA libraries. The feature reduction and attack classification was performed for the KDD-Cup-99, NSL-KDD and UNSW-NB15 datasets. The test set-up, system execution, and results analysis will be performed in this section. The results are updated in the tabular format along with respective graphs, also the results are compared with the other existing methods to prove that the proposed method performs better than the existing models. The system is evaluated by using the Quad Core Intel Pentium-class processor, with 16GB of RAM and 2TB hard disk capacity as faster processor with huge memory is necessary for the high-end computing in real world.
-
A. Test Environment
The proposed system is evaluated for the complete training dataset records of specific type. The dataset will be located in appropriate folder for the system to read and load upon selecting the dataset type. The whole 10% of KDD-Cup-99 training dataset (4,94,021 data records) used for evaluation, similarly for NSL-KDD and UNSW NV15 dataset, the complete training dataset is used with the size of 1,25,973 and 82,332 records respectively ([20], unsw, kddcup99). In evaluating the feature list for attack types, entire attack type records are filtered out and applied for the validation. The numeric mapping of the dataset symbols in Encode.java file transforms data into numerical value for easy and fast processing. Total number of attack class labels and features are configured as per the dataset. The feature evaluation shall be performed for MI-FS, LCC-FS, MI-LCC-FS and LCC-MI-FS techniques.
-
B. Results Review
The section contains the optimal feature subset list and performance results for the proposed MI-FS, LCC-FS, MI-LCC-FS and LCC-MI-FS models [15]. The Accuracy, TPR and False Positive Rates are evaluated and presented for respective dataset and model [17]. The results are also compared with the related existing models.
-
• Detection Rate (DR) / True Positive Rate (TPR): Ratio of number of effectively
distinguished/detected attacks and the aggregate number of attacks.
TP
Detection Rate =
TP + FN
-
• False positive rate (FPR): Ratio between number of normal records distinguished as attacks and to the aggregate number of normal records.
FPR =
FP
TN + FP
-
C. Feature Subset Review
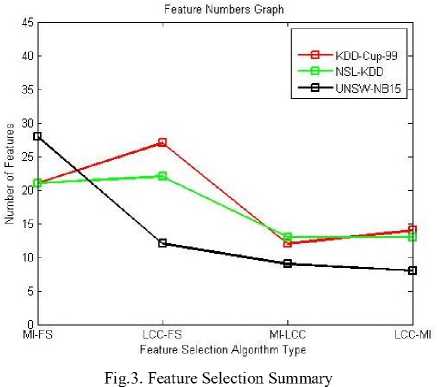
As mentioned in the Table 1, for the KDD-Cup-99 dataset, the number of selected features obtained is 21, 27, 12 and 14 respectively for MI-FS, LCC-FS, MI-LCC-FS and LCC-MI-FS methods. Based on the results provided, the proposed hybrid model produces minimal number of features compared with the existing baseline model (comparison results provided in the next section).
|
Table 1. Feature list results for the KDD-Cup-99 dataset |
||
|
Algorithm |
No. of |
|
|
/model |
features |
|
|
MI-FS |
21 |
31, 11, 32, 35, 1, 22, 23, 30, 28, 25,24, 38, 37, 39, 26, 40, 27, 34, 29, 36 |
|
LCC-FS |
27 |
7, 36, 28, 9, 35, 33, 1, 32, 21, 23, 34, 22, 2, 30, 29, 6, 13, 11, 0, 8, 17, 4, 5, 12, 16, 10, 14 |
|
MI-LCC-FS |
12 |
36, 28, 35, 33, 1, 32, 23, 34, 22, 30, 29, 11 |
|
LCC-MI-FS |
14 |
11, 32, 35, 1, 22, 23, 30, 33, 28, 34, 29, 36, 7, 21 |
|
Table 2. Feature list results for the NSL-KDD dataset |
||
|
Algorithm /model |
No. of features Features list |
|
|
MI-FS |
21 28, 38, 37, 25, 24, 33, 11, 32, 31, 34, 39, 40, 27, 26, 35, 30, 1, 29, 36, 22, 21 |
|
|
LCC-FS |
22 36, 7, 35, 1, 30, 28, 34, 9, 21,0, 39, 33, 27, 26, 40, 29, 6, 13, 17, 4, 8, 5 |
|
|
MI-LCC-FS |
13 36, 35, 1, 30, 28, 34, 21, 39, 33, 27, 26, 40, 29 |
|
|
LCC-MI-FS |
13 28, 33, 34, 39, 40, 27, 26, 35, 30, 1, 29, 36, 21 |
|
Table 3. Feature list results for the UNSW-NB15 dataset
|
Algorithm /model |
No. of features |
Features list |
|
MI-FS |
28 |
12, 42, 20, 21, 22, 23, 3, 32, 9, 1, 39, 2, 36, 10, 33, 34, 38, 40, 11, 25, 24, 37, 27, 0, 16, |
|
17, 18, 19 |
||
|
LCC-FS |
12 |
35, 12, 34, 41, 31, 36, 33, 40, 10, 9, 32, 2 |
|
MI-LCC-FS |
9 |
12, 34, 36, 33, 40, 10, 9, 32, 2 |
|
LCC-MI-FS |
8 |
12, 32, 9, 2, 36, 10, 33, 34 |
Table 4. Attack Category feature list for the KDD-Cup-99 and NSL KDD dataset
|
KDD-Cup-99 |
NSL-KDD |
|||||||
|
Category |
MI-FS |
LCC-FS |
MI-LCC |
LCC-MI |
MI-FS |
LCC-FS |
MI-LCC |
LCC-MI |
|
DOS |
17 |
19 |
8 |
12 |
17 |
18 |
8 |
12 |
|
Probes |
16 |
9 |
7 |
6 |
18 |
11 |
6 |
8 |
|
R2L |
20 |
12 |
8 |
7 |
19 |
13 |
8 |
8 |
|
U2R |
18 |
12 |
10 |
8 |
19 |
12 |
7 |
9 |
|
Table 5. Attack Category feature list for the UNSW NB15 dataset. |
|
|
Classification Normal type |
fuzzers analysis backdoor dos exploit generic reconnaissance shellcode worm |
|
MI-FS 25 |
26 19 22 25 27 24 25 21 23 |
|
LCC-FS 22 |
25 22 14 10 16 14 10 19 9 |
|
MI-LCC-FS 13 |
14 11 11 8 9 10 7 13 6 |
|
LCC-MI-FS 15 |
15 14 10 7 12 10 8 11 6 |
The MI and LCC combined hybrid approach produces the best optimized result of 12 features, the features including 36, 28, 35, 33, 1, 32, 23, 34, 22, 30, 29, and 11 for the KDD-Cup-99 dataset. Similarly, for NSL-KDD dataset have 13 features (36, 35, 1, 30, 28, 34, 21, 39, 33, 27, 26, 40, 29), and 9 total number of features for
UNSW-NB15 dataset (12, 34, 36, 33, 40, 10, 9, 32, 2) [16] as shown in Table 1, 2, 3.
The features specific to attack class category are listed in the Table 4 and 5. The feature selection summary is also represented in pictorial representation in Fig.3.
Table 6. Classification performance summary - Accuracy for the KDD-Cup-99 dataset
|
Classification type |
Normal |
Dos |
Probe |
U2R |
R2L |
|
MI-FS-SVM |
99.2 |
99.9 |
99.9 |
99.9 |
99.9 |
|
LCC-FS-SVM |
99.7 |
99.9 |
99.9 |
99.9 |
99.9 |
|
MI-LCC-FS-SVM |
99.1 |
99.9 |
99.9 |
99.9 |
99.9 |
|
LCC-MI-SVM-FS |
99.2 |
99.9 |
99.9 |
99.9 |
99.9 |
Table 7. Classification performance summary - Accuracy for the NSL-KDD dataset
|
Classification type |
Normal |
Dos |
Probe |
U2R |
R2L |
||||
|
MI-FS-SVM |
96.8 |
99.7 |
99.6 |
99.9 |
99.9 |
||||
|
LCC-FS-SVM |
95.2 |
99.5 |
99.4 |
99.9 |
99.9 |
||||
|
MI-LCC-FS-SVM |
94.5 |
99.4 |
99.4 |
99.9 |
99.9 |
||||
|
LCC-MI-SVM-FS |
94.5 |
99.4 |
99.4 |
99.9 |
99.9 |
||||
|
Table 8. Classification performance summary - Accuracy for the UNSW-NB15 dataset |
|||||||||
|
Classification type Normal fuzzers |
analysis backdoor dos exploit generic reconnaissance shellcode |
worm |
|||||||
|
MI-FS-SVM 81.8 |
92.4 |
99.3 99.3 |
95.4 |
85.9 90.3 |
95.5 |
99.8 |
99.7 |
||
|
LCC-FS-SVM 79.5 |
91.6 |
99.1 99.2 |
94.9 |
85.3 93.8 |
95.5 |
99.5 |
99.9 |
||
|
MI-LCC-FS-SVM 63.8 |
92.6 |
99.1 99.2 |
95.0 |
83.5 82.3 |
95.7 |
99.5 |
99.9 |
||
|
LCC-MI-SVM-FS 75.8 |
91.6 |
99.1 99.2 |
94.9 |
84.2 91.5 |
95.7 |
99.5 |
99.9 |
||
|
Table 9. Classification performance |
summary - FPR for the KDD-Cup-99 dataset |
||||||||
|
Classification type |
Normal |
Dos |
Probe |
U2R |
R2L |
||||
|
MI-FS-SVM |
0.008826 |
2.0E06 |
2.64E05 |
0.0 |
0.0 |
||||
|
LCC-FS-SVM |
0.001393 |
0.0 |
1.02E05 |
2.02E06 |
0.0 |
||||
|
MI-LCC-FS-SVM |
0.010437 |
1.01E05 |
8.12E06 |
0.0 |
0.0 |
||||
|
LCC-MI-SVM-FS |
0.008889 |
0.0 |
1.22E05 |
0.0 |
0.0 |
||||
|
Table 10. Classification performance summary - FPR for the NSL KDD dataset |
|||||||||
|
Classification type |
Normal |
Dos |
Probe |
U2R |
R2L |
||||
|
MI-FS-SVM |
0.062834 |
4.76E05 |
0.001357 |
0.0 |
0.0 |
||||
|
LCC-FS-SVM |
0.074381 |
5.56E05 |
8.19E05 |
2.38E05 |
0.0 |
||||
|
MI-LCC-FS-SVM |
0.088572 |
0.0 |
0.001277 |
0.0 |
0.0 |
||||
|
LCC-MI-SVM-FS |
0.088572 |
0.0 |
0.001277 |
0.0 |
0.0 |
||||
|
Table 11. Classification performance |
summary - FPR for the UNSW NB15 dataset |
||||||||
|
Classification type Normal |
fuzzers |
analysis backdoor dos |
exploit generic |
reconnaissance |
shellco wor de m |
||||
|
MI-FS-SVM 0.0288 |
0.0393 |
0.0 0.0 |
0.0 |
0.0393 0.0 |
0.0 |
0.0 |
0.0 |
||
|
LCC-FS-SVM 0.3047 |
0.0172 |
0.0 0.0 |
0.0016 |
0.1058 0.0239 |
0.0111 |
0.0 |
0.0 |
||
|
MI-LCC-FS-SVM 0.5387 |
0.0 |
0.0 0.0 |
0.0 |
0.0731 0.1096 |
0.0 |
0.0 |
0.0 |
||
|
LCC-MI-SVM-FS 0.383 |
0.0169 |
0.0 0.0 |
0.0018 |
0.1081 0.0234 |
0.0 |
0.0 |
0.0 |
||
|
Table 12. |
Comparison Results - |
Feature list for the KDD-Cup-99 dataset |
|||||||
|
Model |
KDD-Cup-99 |
NSL-KDD |
UNSW-NB15 |
||||||
|
FMIFS([2]) |
19 |
18 |
- |
||||||
|
FLCFS([2]) |
17 |
22 |
- |
||||||
|
FMIFS( Р = 0.3) ([2]) |
25 |
23 |
- |
||||||
|
FMIFS(0 = 1) ([2]) |
25 |
28 |
- |
||||||
|
MI-FS |
21 |
21 |
28 |
||||||
|
LCC-FS |
27 |
22 |
12 |
||||||
|
MI-LCC-FS |
12 |
13 |
9 |
||||||
|
LCC-MI-FS |
14 |
13 |
8 |
||||||
|
Table 13. Comparison Results |
– Accuracy – for KDD Cup 99 dataset. |
||||||||
|
System |
Normal |
Dos |
Probe |
U2R |
R2L |
||||
|
FMIFS+LSSVM([2]) |
99.8 |
99.9 |
99.9 |
99.9 |
99.9 |
||||
|
Bayesian network([2]) |
98.8 |
98.9 |
99.5 |
48.0 |
98.9 |
||||
|
MI-FS+SVM |
99.2 |
99.9 |
99.9 |
99.9 |
99.9 |
||||
|
LCC-FS+SVM |
99.8 |
99.9 |
99.9 |
99.9 |
99.9 |
||||
|
MI-LCC-FS+SVM |
99.1 |
99.9 |
99.9 |
99.9 |
99.9 |
||||
|
LCC-MI-FS+SVM |
99.2 |
99.9 |
99.9 |
99.9 |
99.9 |
||||
Table 14. Comparison Results for NSL-KDD dataset
|
System |
Accuracy |
DR |
FPR |
|
FMIFS+LSSVM ([2]) |
99.9 |
98.9 |
0.2 |
|
C4.5 with linear correlation based([2]) |
99.1 |
- |
- |
|
MI-FS+SVM |
99.2 |
99.5 |
0.062 |
|
LCC-FS+SVM |
98.8 |
97.5 |
0.07 |
|
MI-LCC-FS+SVM |
98.6 |
97.4 |
0.088 |
|
LCC-MI-FS+SVM |
98.6 |
97.4 |
0.088 |
-
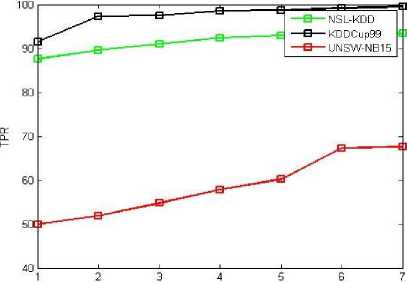
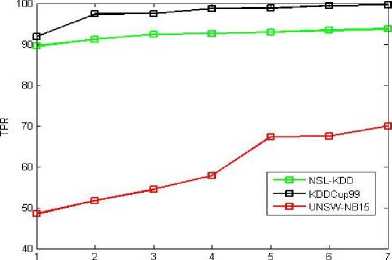
D. Performance Review:
The classification performance evaluation shall be done for all three given datasets. The performance matrix for system accuracy, True Positive Rate (TPR) and False Positive Rate (FPR) are listed in the below Fig 4-14. Equations (13), (14) and (15) are used to evaluate these terms. Here, all four proposed feature selection methods give effective and efficient features for the classification algorithm. These accuracy, TPR and FPR Roc graphs explains MI-FS method gives better accuracy results compare to all other methods in the ROC graph Fig. 4, 5, 6. Among all TPR ROC graph Fig 7-10 MI-FS method give better TPR ROC graph for all three datasets. Among all FPR ROC graph Fig 11-14 MI-LCC-FS method give better FPR ROC graph for all three datasets. Multiple tests were performed in summarizing the performance results for the MI-FS, LCC-FS, MI-LCC-FS and LCC-MI-FS methods using the SVM classification algorithm are as shown in Table 6-8.
The ROC curve graphs are plotted for the dataset instances of the 10% training data. The original dataset is divided along with all attack types in producing the accuracy, TPR and FPR values. Here, we used all proposed methods (MI-FS, LCC-FS, MI-LCC-FS and LCC-MI-FS) and all the three datasets (KDD-CUP-99, NSL-KDD and UNSW-NB15 dataset) as shown in ROC graph Fig. 4-14.
As we noticed in the above tables and graphs, the MI-LCC-FS technique have substantial performance results on accuracy, detection rate and FPR.
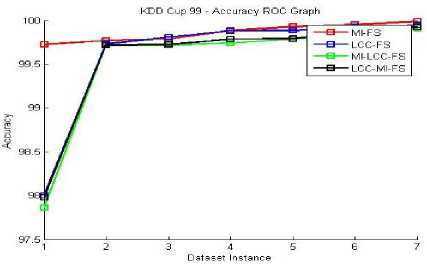
Fig.4. KDD-Cup-99 - Accuracy RoC Graph
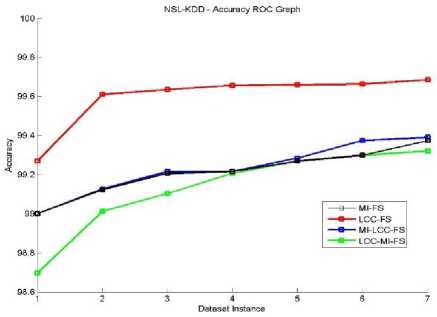
Fig.5. NSL-KDD Accuracy RoC Graph
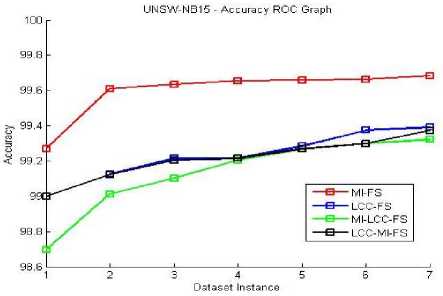
Fig.6. UNSW-NB15 Accuracy RoC Graph
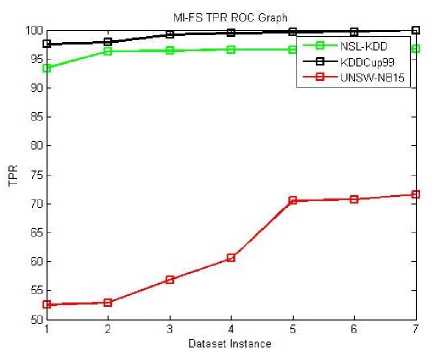
Fig.7. MI-FS TPR ROC Graph
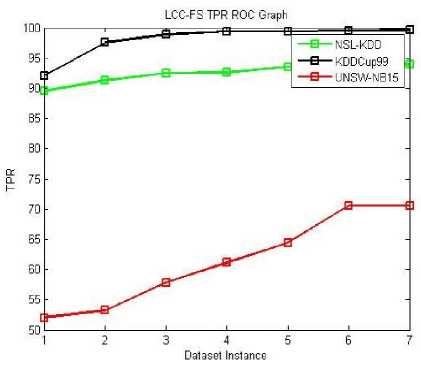
Fig.8. LCC-FS TPR ROC Graph
МНЙЙЗ TPR RCiSfiMii
Dataset Instance
Fig.9. MI-LCC-FS TPR ROC Graph
LCC-MI-FS TPR ROC Graph
Dataset Instance
Fig.10. LCC-MI-FS TPR ROC Graph
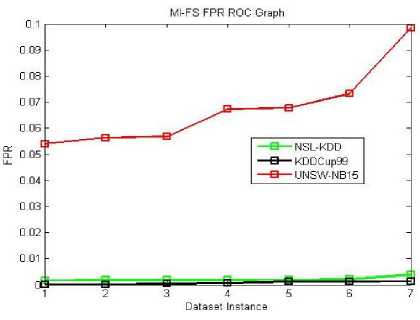
Fig.11. MI-FS FPR ROC Graph
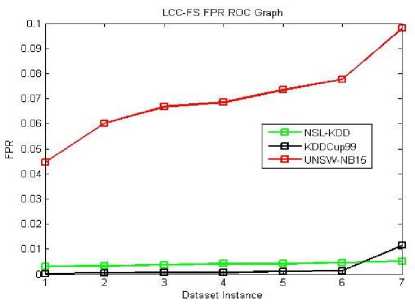
Fig.12. LCC-FS FPR ROC Graph
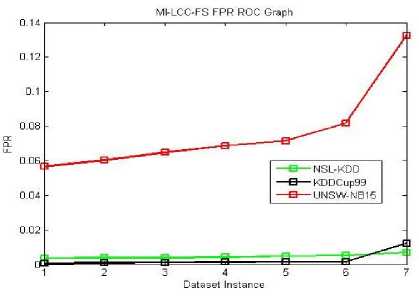
Fig.13. MI- LCC-FS FPR ROC Graph
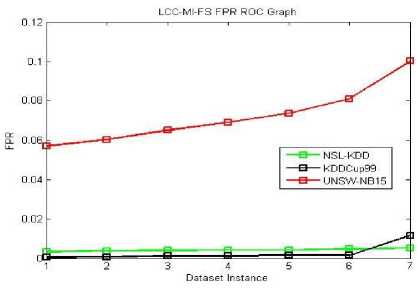
Fig.14. LCC-MI-FS FPR ROC Graph
The proposed system records lowest False Positive Rate, improved substantially from existing systems.
-
E. Comparative Study:
The Feature selection summary results and performance results show tremendous improvements in the proposed model. In this section, the results shall be compared and reviewed with baseline and other existing models [19]. The existing Mutual Information and Liner Correlation Coefficient are considered here to review and validating the results. Following Tables 12-14 show the results comparison with other models for the respective datasets.
The comparison results with the existing models shows that the proposed system is outperforms in number of features, accuracy, detection rate and FPR. The feature subset number shows that the 12, 13, and 8 number of features selected in case of MI-LCC hybrid model for three dataset types. Similarly, 14, 13 and 8 features in case of LCC-MI model. The performance comparison also achieved improvements with the proposed model.
Overall summary, all four models show improvements in the accuracy and FPR. Accuracy results are above 99.1%, hybrid approach is 99.7% for KDD-Cup-99, etc. Similarly promising improvement of accuracy for NSL KDD and UNSW NB15 dataset. Records lowest False Positive Rate, improved substantially from existing systems.
-
V. Conclusion and Future Work
The efficient and effectiveness of IDS depends on robust feature selection and classification algorithms. Proposed hybrid feature selection model (MI-LCC-FS, LCC-MI-FS are enhanced feature selection models) extracts the best optimal feature subset among FMIFS, FLCFS, FMIFS( в = 0.3), FMIFS( в = 1), MI-FS, LCC-FS, MI-LCC-FS and LCC-MI-FS methods. The MI-FS and LCC-FS are existing systems and are used to build hybrid technique. The system was built and evaluated for KDD-CUP-99, NSL-KDD and UNSW-NB15 dataset records, 10% of training data was considered for testing and results were evaluated and consolidated. The feature summary tables show that the MI-LCC-FS combination approach provides the best optimal feature subset number with 12 and 13 features among 41 originals for the KDD-Cup-99 and NSL-KDD datasets respectively. Similarly, for UNSW-NB15 dataset, 9 total number of features obtained among the 45 features. The classification performance figures also display satisfactory and are improved compared with the baseline model. Proposed framework model has improved performance results, higher accuracy and very low to negligible FP rate.
References Data mining based framework for effective intrusion detection using hybrid feature selection approach
- M.A Ambusaidi, P. Nanda, “Building an intrusion detection system using a filter-based feature selection algorithm”, IEEE Transactions on Computers, 65(10): pp. 2986 – 2998, 2016.
- B. Mazhar Tayel and S. K. Mohamedeen, “Study of hybrid intrusion detection system”, International Conference on Innovative Trends in Computer Engineering (ITCE), pp.115 – 121, 2018.
- R. Battiti, “Using mutual information for selecting features in supervised neural net learning”, IEEE Transactions on Neural Networks, Issue. 5, Vol. 4, pp. 537–550, 1994.
- N. Kwak and. C. H. Choi, “Input feature selection for classification problems”, IEEE TRANSACTIONS ON NEURAL NETWORKS, 13(1):143-159, 2002.
- M. B. Shirzad and M. R. Keyvanpour, “A feature selection method based on minimum redundancy maximum relevance for learning to rank”, AI and Robotics (IRANOPEN), pp.1-5, 2015.
- S. SobinSoniya and S.M.C Vigila, “Intrusion detection system: Classification and techniques”, International Conference on Circuit, Power and Computing Technologies [ICCPCT], pp. 1-7, 2016.
- T. Janarthanan and S. Zargari, “Feature selection in unsw-nb15 and kddcup’99 datasets”, IEEE 26th International Symposium on Industrial Electronics (ISIE), pp. 1881-1886, 2017.
- N. Moustafa and J. Slay, “ The significant features of the UNSW-NB15 and the KDD99 data sets for Network Intrusion Detection Systems” , 25-31, 2015.
- W. Gao, L. Hu, and P. Zhang, “Class-specific mutual information variation for feature selection”, Pattern Recognition, Issue. 79, pp. 328-339, 2018.
- Canadian Institute for Cybersecurity, Nsl kdd dataset http://www.unb.ca/cic/datasets/nsl.html,
- Z. Stefanova and K. Ramachandran, “Network attribute selection, classification and accuracy (nasca) procedure for intrusion detection systems”, IEEE International Symposium on Technologies for Homeland Security (HST), pp. 1-7, 2017.
- M. Bennasar, YuliaHicks, and R. Setchi, “Feature selection using joint mutual information maximization”, Expert Systems with Applications, Issue. 42, Vol. 22, pp. 8520-8532, 2015.
- S. Kumara, A. Viinikaineny, and T. Hamalainenz, “Machine learning classification model for network based intrusion detection system”, 11th International Conference for Internet Technology and Secured Transactions (ICITST), 242-249, 2017.
- N. Hoque, D. K. Bhattacharyya, and J. K. Kalita, “A mutual information-based feature selection method”, Expert Systems with Applications, Issue. 41, Vol.14, pp. 6371-6385, 2014.
- B. Seijo-Pardo, I. Porto-Díaz, V. Bolón-Canedo, and A. Alonso-Betanzos, “Ensemble feature selection: Homogeneous and heterogeneous approaches, Knowledge-Based Systems, 118: pp. 124-139, 2017.
- H. Nkiama, S.Z.M Said, and M. Saidu’s, “A subset feature elimination mechanism for intrusion detection system”, (IJACSA) International Journal of Advanced Computer Science and Applications, 7(4), 2016.
- H. Lu, J. Chen, “A hybrid feature selection algorithm for gene expression data classification”, Neurocomputing, 256: 56–52, 2017.
- F. Amiri, M. M. R. Yousefi, A. CaroLucas, Shakery, and NasserYazdani, “Mutual information-based feature selection for intrusion detection systems”, Journal of Network and Computer Applications, Isssue. 34, Vol. 4, pp. 1184-1199, 2011.
- M. A. Ambusaidi, X. Upasana, “A novel feature selection approach for intrusion detection data classification”, International Conference on Trust, Security and Privacy in Computing and Communications, IEEE, Electronic ISBN: 978-1-4799-6513-7, 2014.
- M. S. Pervez and D. M. Farid, D. M, “Feature selection and intrusion classification in nslkdd cup 99 dataset employing svms”, The 8th International Conference on Software Knowledge Information Management and Applications (SKIMA 2014), 1–6, 2014.
- http://kdd.ics.uci.edu/databases/kddcup99/kddcup99.html, Kddcup99 public dataset.
- https://www.unsw.adfa.edu.au/unsw-canberracyber/ cybersecurity/ adfa-nb15-datasets/
