Data mining to prediction student achievement based on motivation, learning and emotional intelligence in MAN 1 Ketapang

Author: Muhammad U. Fahri, Sani M. Isa
Journal: International Journal of Modern Education and Computer Science @ijmecs
Article in issue: 6 vol.10, 2018.
Free access
The problems that exist in the school decline in student achievement ahead of class III, especially before approaching the national exam. If the learning achievement of third-grade students can be known earlier then the school can perform the actions necessary for students to achieve good learning achievement. This research uses two methods of data mining, Neural Network Model Multilayer Perceptron, and Decision Tree. For comparison, this study also uses t-statistic test, t-test and to compare precision/recall using Roc Curve. Neural Network Model Multilayer Perceptron Positive performance vector accuracy: 88.64% and Negative: 14.07%, precision (positive guidance class) positive 88.00% and negative 16.88%, recall (class: Ordinary guidance) positive 84.50%, and negative 21.73%. Decision Tree Positive performance vector accuracy: 84.82% and Negative: 15.24%, precision (positive guidance class) positive 86.55% and negative 18.52%, recall (class: ordinary guidance) positive 84.00% and negative 23.85%. Experiments conducted in this study aims to prove that data mining can predict student achievement by finding the best data mining method between the multilayer perceptron neural network and Decision tree to be implemented into integrated information system between student motivation data, student learning interest, and intelligence emotional students.
Data Mining, Neural Network, Decision Tree, Student Motivation, Student Learning, Intelligence Emotional
Short address: https://sciup.org/15016773
IDR: 15016773 | DOI: 10.5815/ijmecs.2018.06.07
Text of the scientific article Data mining to prediction student achievement based on motivation, learning and emotional intelligence in MAN 1 Ketapang
Published Online June 2018 in MECS DOI: 10.5815/ijmecs.2018.06.07
Currently to dig the added value of information that has not been known manually from a database. By extracting patterns from the data in order to manipulate the data into more valuable information obtained by extracting and recognizing the important or interesting patterns of data contained in the database. Data mining is necessary to do especially in managing very large data to facilitate the activities of recording a transaction and for data mining process in order to provide accurate information for its users
Learning achievement cannot be separated from learning activities because learning is a process while learning achievement is the result of the learning process. For a child, learning is an obligation. Success or failure of a child in education depends on the learning process experienced by the child.
In fact, in the process of teaching and learning in schools are often found students who cannot achieve learning achievement equivalent to the ability of intelligence. There are students who have high intelligence skills but have relatively low learning achievement, but there are students who, despite their relatively low ability, can achieve relatively high learning achievement. That is why the level of intelligence is not the only factor that determines one's success because there are other factors that effect. According to Goleman, intellectual intelligence (IQ) contributes only 20% to success, while 80% is a contributing factor of other forces, including emotional intelligence or Emotional Quotient (EQ).
Data mining, in general, can be used to predict what will happen in the future. Research (W, 2007) shows data mining can be used to predict credit risk status of Bank X as a result of C5.0 algorithm 87, 72%, CART 87, 27% and CHAID 87, 15%.
Research (Sappaile, 2007) indicates that students' learning motivation can influence student's learning achievement, (Rohim, 2011) shows that interest in learning can affect student's learning achievement and research (Thaib, 2013) there is a relationship between emotional intelligence and student's learning achievement.
Madrasah Aliyah Negeri Ketapang (MAN) is an institution that has a large number of data/information, this information that will be very useful for the development of something useful. The data commonly owned by schools in large numbers and will always increase each year, among others, student achievement data, student interest data, and student emotional intelligence data. From the data held in school, the data has not been utilized properly as a consideration for the school. Therefore, with the existence of data mining can be one solution to mine the pile of data to make the value or information more useful.
The problems that exist in the school decline in student achievement ahead of class III, especially before approaching the national exam. With the decrease of school learning achievement, the school makes the policy of students who start to enter class III (Semester V) whose performance decreases must be guided more extra. Because extra guidance is only done since class III (Semester V) feels too late to know will the achievement of student achievement. If the learning achievement of third-grade students can be known earlier then the school can perform the actions necessary for students to achieve good learning achievement.
The final hope is that all third-grade students from various background factors can be maximized in improving their learning achievement. Based on the above explanation, the focus of this study is to predict student achievement by using data mining method based on students' learning motivation, student learning interest and emotional intelligence of students at MAN 1 Ketapang.
Research Objective is to show data mining Neural Network Model Multilayer Perceptron can predict student achievement at MAN 1 Ketapang and View Comparison of Accuracy level of Multilayer Perceptron and Decision Tree Neural Network in predict student achievement at MAN 1 Ketapang.
-
II. Research Method
-
2.1 Framework Think
-
-
2.2 Data Selection
The framework contains the steps that will be taken in conducting this research based on the stages of KDD. This research is divided into the following steps:
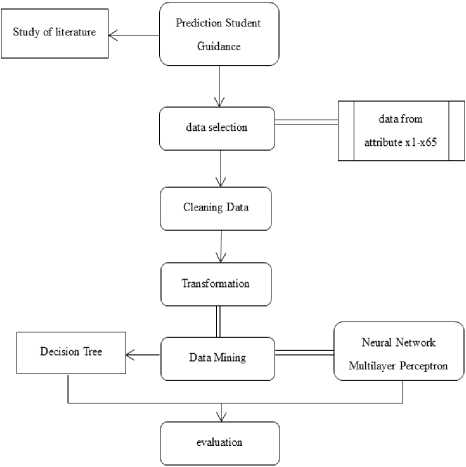
Fig.1. Framework Think
In this research, the research used as many as 65 attributes and 1 labels obtained from students' motivation data, learning interest and emotional intelligence of MAN 1 Ketapang students and data from Counseling Guidance Teachers about grade 3 students (Semester V) who need guidance. The attributes used by researchers are:
Table 1. Data Attribute
|
< |
(/) to 3 |
Indicator |
Name |
|
X1 |
|||
|
X2 |
I |
Student Motivation |
Al Quran Hadith |
|
X3 |
Aqidah Akhlak |
||
|
X4 |
Fikih |
||
|
X5 |
History of Islam |
||
|
X6 |
Pancasila and civic education |
||
|
X7 |
Indonesian |
||
|
X8 |
Arabic |
||
|
X9 |
Mathematics |
||
|
X10 |
Indonesian History |
||
|
X11 |
English |
||
|
X12 |
Art and culture |
||
|
X13 |
Sports physical Education and health |
||
|
X14 |
Workshops and Entrepreneurship |
||
|
X15 |
Interest to learn |
Average Interest Interest Learning |
|
|
X16 |
Average Interests Value |
||
|
X17 |
Total Extracurricular |
||
|
X18 |
Sick |
||
|
X19 |
Permission |
||
|
X20 |
without explanation |
||
|
X21 |
Emotional Intelligence |
Attitudes of Al Quran Hadith |
|
|
X22 |
Attitudes of Aqidah Akhlak |
||
|
X23 |
The attitude of Fiqh |
||
|
X24 |
Attitudes History of Islamic Culture |
||
|
X25 |
Education Attitudes Pancasila and Citizenship |
||
|
X26 |
Indonesian Attitude |
||
|
X27 |
Arabic Attitude |
||
|
X28 |
Math Attitude |
||
|
X29 |
The Attitudes of Indonesian History |
||
|
X30 |
English Attitude |
||
|
X31 |
The attitude of Cultural Art |
||
|
X32 |
Attitude of Physical Education, Sport and Health |
||
|
X33 |
Attitude and Entrepreneurship Attitude |
||
|
X34 |
II |
Student Motivation |
Al Quran Hadith |
|
X35 |
Aqidah Akhlak |
||
|
X36 |
Fikih |
||
|
X37 |
History of Islam |
||
|
X38 |
Pancasila and civic education |
||
|
X39 |
Indonesian |
||
|
X40 |
Arabic |
||
|
X41 |
Mathematics |
||
|
X42 |
Indonesian History |
||
|
X43 |
English |
||
|
X44 |
Art and culture |
||
|
X45 |
Sports physical Education and health |
||
|
X46 |
Workshops and Entrepreneurship |
||
|
X47 |
Interest to learn |
Average Interest Interest Learning |
|
|
X48 |
Average Interests Value |
||
|
X49 |
Total Extracurricular |
||
|
X50 |
Sick |
||
|
X51 |
Permission |
||
|
X52 |
without explanation |
||
|
X53 |
Emotional Intelligence |
Attitudes of Al Quran Hadith |
|
|
X54 |
Attitudes of Aqidah Akhlak |
||
|
X55 |
The attitude of Fiqh |
||
|
X56 |
Attitudes History of Islamic Culture |
||
|
X57 |
Education Attitudes Pancasila and Citizenship |
||
|
X58 |
Indonesian Attitude |
||
|
X59 |
Arabic Attitude |
||
|
X60 |
Math Attitude |
||
|
X61 |
The Attitudes of Indonesian History |
||
|
X62 |
English Attitude |
||
|
X63 |
The attitude of Cultural Art |
||
|
X64 |
Attitude of Physical Education, Sport and Health |
||
|
X65 |
Attitude and Entrepreneurship Attitude |
||
|
Y |
V |
Student Tutoring |
|
Table 1 shows that there are 65 regular attributes and 1 label.
In MAN Ketapang there are 3 majors are Religion, Science, and IPS by selecting the student story data in table 2.
Table 2. Sampling
|
majors |
Semester |
Many Sampling Students |
|
Agama |
I – IV |
36 Person |
|
IPA |
I – IV |
36 Person |
|
IPS |
I – IV |
34 Person |
Table 2 is a sample of the research that will be conducted by taking 3 majors at once, with a total of 106 student students.
-
2.3 Cleaning Data
-
2.4 Transformation
-
2.5 Data Mining
-
2.5.1 Neural Network Model Multilayer Perceptron
Data from attributes X1 to X65 will be done cleaning duplicate data checks inconsistent data and fix errors in the data. data cleaning research is done by replacing missing value with the average method
This research uses Rapidminer application, Transformation value X1 s / d X65 by normalizing data into 0 to 1 range 1. Transformation is done because in this research using sigmoid activation function for neural network multilayer perceptron. data in normalization to the range 0.1 - 0.9 got more accurate results.
This research uses two methods of data mining, namely:
Using a number of folds 10 with the Neural Network data mining method:
Hidden Layer: 1
Training Cycles: 500
Learning Rate: 0.3
Momentum: 0.2
-
2.5.2 Decision Tree
-
2.6 Evaluation
As a comparison of research also use a decision tree. Using a number of folds 10 with the method of data mining decision tree
Criteria: Gain Ratio
Maximal Depth: 20
Confidence: 0.25
Minimal Gain: 0.1
As an evaluation material comparison of two methods of data mining. there are two cross-validations (Folds: 10) between the neural network and the Decision tree. Then produce performance vector accuracy. For comparison, this study also uses t-statistic test, t-test and to compare precision/recall using Roc Curve.
-
III. Results and Analysis
-
3.1 Data Selection
-
-
3.2 Cleaning Data
From data set, from data analysis one or more data deviate to other data. In this case, prior to data processing, the researcher first whether the deviant data had to be discarded or can be maintained. Data were collected based on research attribute where X1 - X65 and label Y Student Guidance Class III (Semester V), the data is imported into the application rapidminer. Attribute name of the student in exclude and label of student guidance (Y) used as a label. With a total example set (106 example, 1 Special Attribute, 65 Regular Attribute).
v «ЕХТВА си t ОАКСЕ eORltNARY CUttAHCE
73 77 81 85
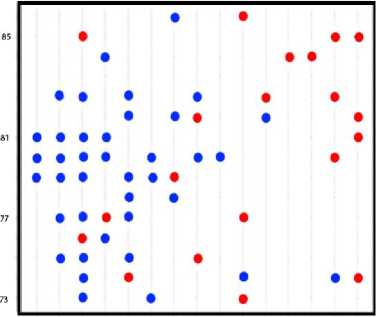
Fig.2. Examples of data distribution
In Fig. 2 is a sample of the distribution of data (attributes X2 and X3 to label Y)
Cleaning data is done to replace missing value:
Attribute filter type: all
Default: average
After done Cleaning the data obtained example set (106 example, 1 Special attribute, 65 regular attributes). data already in cleaning, the data with all missing 0
-
3.3 Transformation
-
3.4 Data Mining
-
3.4.1 Neural Network Model Multilayer Perceptron
Attribute filter type: all
Method: range transform
Min: 0.1
Max: 0.9
The data in the transform becomes the range 0.1 - 0.9 because the data using binary sigmoid activation. all data has been normalized to a range of 0.1 s / d 0.9.
The researcher used two cross-validations, the first for cross-validation (Validation NN) neural network with a number of folds 10 sampling type stratified sampling and the second using cross-validation (Validation Dt) with a number of folds 10 sampling type stratified sampling.
Cross-validation with 90% training data and 10% testing data.
Hidden layers: 1
Training cycles: 500
Learning rate: 0.3
Momentum: 0.2
Fig. 4 shows the comparison of predicted results between the usual guidance class and the extra tutoring class in which the usual guidance predictions got the frequency of 43 and the extra-buck guidance prediction of 61.
-
3.4.2 Decision Tree
-
3.4.2.1 Performance Vector
3.4.1.1 Performance Vector
-
-
3.4.1.2 Improved Neural Network
3.4.1.3 Example Set Neural Network
Table 4. Confusion Matrix Decision Tree
Table 3. Confusion Matrix Neural Network
|
True extra guidance |
True ordinary guidance |
Class Precision |
|
|
predictions of extra guidance |
55 |
7 |
88.71% |
|
predictions of ordinary guidance |
5 |
39 |
88.64% |
|
Class Recall |
91.67% |
84.78% |
In Table 3 the accuracy of positive vector performance: 88.64% and Negative: 14.07%, precision (normal guidance class) positive 88.00% and negative 16.88%, recall (class: Ordinary guidance) positive 84.50% and negative 21.73%
Of the neural network wherein the study there are 1 hidden layers, 42 nodes, 1 threshold and 2 classes (class of ordinary guidance and extra guidance).
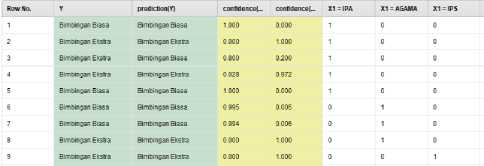
Fig.3. Example Set
In Fig. 3 above the sample from the example set that has been done with Y as the label and Prediction (Y) as the result of the testing prediction.
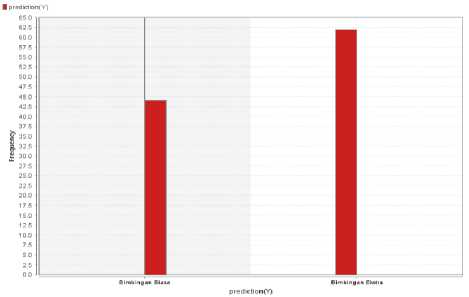
Fig.4. Prediction Comparison
|
true extra guidance |
True ordinary guidance |
Class Precision |
|
|
predictions of extra guidance |
51 |
7 |
87.93% |
|
predictions of ordinary guidance |
9 |
39 |
81.25% |
|
Class recall |
85.00% |
84.78% |
In Table. 4 Accuracy of positive vector performance: 84.82% and Negative: 15.24%, precision (class guidance regular) positive 86.55% and negative 18.52%, recall (class: Normal guidance) positive 84.00% and negative 23.85%.
-
3.4.2.2 Tree ( Decision Tree )
Shows the decision tree where the determinant factor X5 is the first-semester student motivation on the history of Islamic culture.
Decision Tree
X5 > 82.500
| X1 = IPS > 0.500: Extra guidance {Extra guidance=1, Ordinary guidance=1}
| X1 = IPS ≤ 0.500: Ordinary guidance {Extra guidance=0, Ordinary guidance=28}
X5 ≤ 82.500
| X7 > 85.500: Ordinary guidance {Extra guidance=0, Ordinary guidance=6}
| X7 ≤ 85.500
| | X4 > 86.500: Ordinary guidance {Extra guidance=0,
Ordinary guidance=2}
| | X4 ≤ 86.500
| | | X14 > 85.500: Ordinary guidance {Extra guidance=0, Ordinary guidance=2}
| | | X14 ≤ 85.500
| | | | X2 > 82.500
| | | | | X5 > 76.500: Ordinary guidance {Extra guidance=0, Ordinary guidance=4}
| | | | | X5 ≤ 76.500: Extra guidance {Extra guidance=3, Ordinary guidance=0}
| | | | X2 ≤ 82.500
| | | | | X14 > 73.500: Extra guidance {Extra guidance=54, Ordinary guidance=1}
| | | | | X14 ≤ 73.500
| | | | | | X1 = IPS > 0.500: Extra guidance {Extra guidance=2, Ordinary guidance=0}
| | | | | | X1 = IPS ≤ 0.500: Ordinary guidance
{Extra guidance=0, Ordinary guidance=2}
-
3.4.2.3 Example Set Decision Tree
-
3.5 Evaluation
-
3.5.1 Performance Vector
-
A sample from the example set that has been done with Y as a label and Prediction (Y) as a result of the testing prediction.
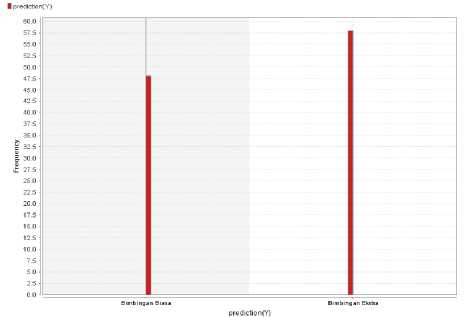
Fig.5. Prediction Comparison
Fig.5 shows the comparison of predicted results between the usual guidance class and the extra tutoring class in which the usual guidance predictions got a frequency of 48 and an extra guidance prediction of 58.
From the above process, results are determined values for things or objects that are based on certain references to specify a particular purpose.
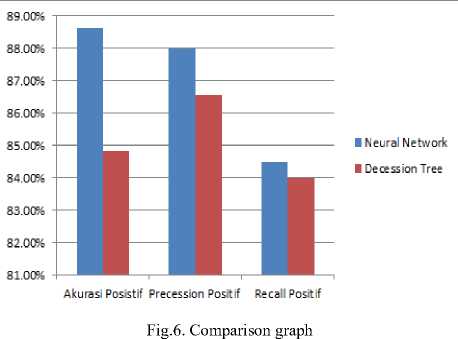
Table 5. Accuracy Comparison of Predictions
|
Type |
Accuracy Positive |
Precession Positive |
Recall Positive |
|
Neural Network |
88.64% |
88.00% |
84.50% |
|
Decision Tree |
84.82% |
86.55% |
84.00% |
-
3.5.2 Test statistics t-test
Comparative test to assess the difference between a certain value and the average. as a test procedure t-test on rapidminer with alpha: 0.05.
Table 6. Pairwise T-Test ( T-Test)
|
A |
B |
C |
|
0.896 +/- 0.122 |
0.848 +/- 0.152 |
|
|
0.896 +/- 0.122 |
0.446 |
|
|
0.848 +/- 0.152 |
In Table 6 Probability for random values with the same result, values smaller than alpha = 0.05 indicating a significant difference between the actual average value. The probability for random values with the same result: 0.446. A smaller value of alpha = 0.050 indicates no significant difference between the Validation neural network and Decision tree values.
List of performance values:
Validation Neural Network = 0: 0.896 +/- 0.122
Validation Decision Tree = 1: 0.848 +/- 0.152
-
3.5.3 ROC Curve
Displaying performance information of classification algorithms in graphical form using Receiver Operating Characteristic (ROC). process compare ROCs in rapidminer to find the value of precision-recall curve with:
Number of folds: 10
Split ratio: 0.7
Comparing the precision/recall between Neural Network and Decision Tree. Her visual results are as follows:
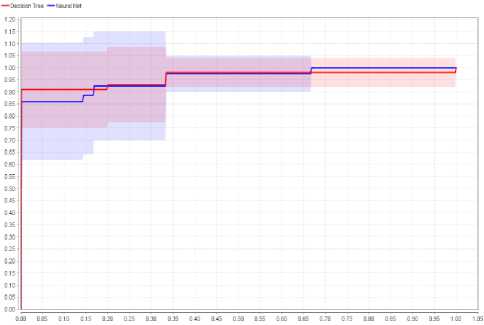
Fig.7. Visualization Performance Algorithm
In Fig. 7 can be read with, if the baseline approaches from 0,0 then it is ugly and if the curve is point 1 then good. From the graph of ROC visualization above can be concluded the performance of neural network algorithm and decision tree are both good.
-
IV. Conclusion
Experiments conducted in this study aims to prove that data mining can predict student achievement by finding the best data mining method between the multilayer perceptron neural network and Decision tree to be implemented into integrated information system between student motivation data, student learning interest, and intelligence emotional students.
From the experimental results, it is found that data prediction model with the multilayer perceptron neural network method has better prediction performance than a model with Decision tree approach. In this study, predictive performance of each model in predicting student achievement or more specifically that grade 3 students (semester V) received regular guidance or extra guidance, measured in Neural network multilayer perceptron and Decision tree where the multilayer perceptron neural network model gets value of accuracy, precession and recall higher than the Decision tree
The performance of a better multilayer perceptron neural network model compared to the Decision tree model, which is both based on computational intelligence, is due to the Neural network multilayer perceptron model having better generalizations than the Decision Tree model as a result of the prediction.
Therefore, from this research, it can be concluded that multilayer perceptron neural network method is highly recommended for use in integrated information system between student motivation, student learning interest and students' emotional intelligence at MAN Ketapang in predicting students from early (first semester) so that students entering class III the school side can give special treatment in order to pass the student up to class III to be more mature in facing national exam.
With Neural network multilayer perceptron research will then be created an application of artificial intelligence that will be implemented to school with integrated with student motivation data, student learning interest and emotional intelligence of students.
Acknowledgment
Mr. Sani Muhammad as a supervising lecturer, who always provide direction, support and motivation during the preparation of this research.
References Data mining to prediction student achievement based on motivation, learning and emotional intelligence in MAN 1 Ketapang
- Arisandi, R., & Latifah, M. (n.d.). Analisis Persepsi anak terhadap gaya pengasuh orangtua, kecerdasan emosional, aktifitas dan prestasi belajar siswa kelas XI di SMA negeri 3 Sukabumi. Departemen ilmu Keluarga dan konsumen, Fakultas Ekologi Manusia IPB.
- Daniati, E. (n.d.). Klasifikasi Kelompok Penjamin Mutu Pada Karyawan perusahaan XYZ dengan KNN dan J48. Nusantara Of Engenering, Vol 2.
- Daud, F. (2012). Pengaruh Kecerdasan Emosional (EQ) dan Motivasi belajar terhadap hasil belajar biologi siswa SMA 3 negeri kota palopo. Jurnal Pendidikan dan Pembelajaran, Volume 19, Nomor 2.
- Fitri, S. (2014). Perbandingan Kinerja Algoritma Klasifikasi Naive Bayesian, Lazy IBK, Zero - R, Dan Decisson Tree-J48. Jurnal Dasi, Vol.15 No 1.
- Hamdu, G., & Agustina, L. (2011). Pengaruh motivasi belajar siswa terhadap pestasi belajar ipa di sekolah dasar. Jurnal Penelitian Pendidikan, Vol 12. No 1.
- Hermawati, N. W. (2012). Pengaruh Model pembelajaran ikuiri terhadap penguasaan konsep biologi dan sikap ilmiah siswa ditinjau dari minat belajar siswa. Artikel Program Studi Pendidikan Sains Program Pascasarjana Universitas Peneididikan Ganesha.
- Lesmana, I. P. (2012). Pengembangan Decisson Tree J48 untuk diagnosis Penyakit diabetes melitus. Seminar Nasional Teknologi Informasi & Komunikasi Terapan.
- Mawarsih, S. E., Susilaningsih, & Hamidi, N. (2013). Pengaruh Perhatian orang tua dan motivasi belajar terhadap presatasi belajar siswa SMA Negeri Jumapolo. Jupe UNS, Hal 1 s/d 13.
- Mayadewi, P., & Rosely, E. (2015). Prediksi Nilai Proyek Akhir Mahasiswa Menggunakan Algoritma Klasifikasi Data Mining. Seminar Nasional Sistem Informasi Indonesia, 2.3.
- Meinanda, M. H., Annisa, M., Muhandri, N., & Suryadi, K. (2009). Prediksi Masa studi sarjana dengan Arficial Neurel Network. Internetworking Indonesia Journal, Vol 1/No 2.
- Purnamasary, D., Henharta, J., Sasmita, Y. P., Ihsani, F., & Wicaksana, I. W. (2013). Get Easy Using Weka. Makasar: Dapur Buku.
- Rohim, A. (2011). Pengaruh minat belajar terhadap prestasi belajar siswa pada bidang studi PAI. Jurusan Pendidikan agama islam fakultas ilmu tarbiyah dan keguruan.
- Sappaile, B. I. (2007). Hubungan kemampuan penalaran dalam matematika dan Motivasi berprestasi terhadap prestasi belajar matematika. Jurnal Pendidikan dan Kebudayaan, 069.
- Siagian, R. E. (n.d.). Pengaruh Minat dan Kebiasaan Belajar Siswa terhadap Prestasi belajar Matematika. Jurnal Formatif 2, 121-131.
- Susanto, H., & Sudiyanto. (2014). Data mining untuk memprediksi prestasi siswa berdasarkan sosial ekonomi, motivasi, kedisiplinan dan prestasi masa lalu. Jurnal Pendidikan Vokasi.
- Syarif, I. (2012). Pengaruh Model Blended Learning Terhadap Motivasi dan Prestasi Belajar Siswa SMK. Jurnal Pendidikan Vokasi, Vol 2 , Nomor 2.
- Thaib, E. N. (2013). Hubungan Antara prestasi belajar dengan kecerdasan emosional. Jurnal Ilmiah Didaktika, VOL . XIII No.2.
- Thaib, E. N. (2013). Hubungan antara prestasi belajar siswa dengan kecerdasan emosional. Jurnal Ilmiah Didaktika, 2.
- W, Y. Y. (2007). Perbandingan performansi algoritma decision tree c5.0, cart, dan chaid: kasus prediksi status resiko kredit di bank x. Seminar Nasional Aplikasi Teknologi Informasi.
- Wasti, S. (2013). Hubungan Minat Belajar dengan hasil belajar mata pelajaran tata busana di madrasah aliyah negeri 2 Padang. Program Studi Pendidikan Kesahjahtraan Keluarga Fakultas Teknik Universitas Negeri Padang.
