Decision support system to determine promotional methods and targets with k-means clustering

Author: Yazid, Ema Utami
Journal: International Journal of Information Engineering and Electronic Business @ijieeb
Article in issue: 2 vol.10, 2018.
Free access
Promotion becomes one of the important aspects of institutions of college. The number of competitors demanding the marketing must be fast and accurate in formulating strategies and decision making. Data warehouse and data mining become one of the means to build a decision support system that can provide knowledge and wisdom quickly to be taken into consideration in promotion strategy planning. Development of this system then does the process of testing with the number of data 6171 rows of student enrollment taken directly from a transactional database. The data is done ETL process and clustering with the k-means clustering algorithm, then the data in each cluster is done grouping and summarization to get weighting. After that just done ranking to produce wisdom, one of them determine the list of schools that will be the target roadshow. The analysis also produces several patterns of student enrollment, namely the registrant pattern from the wave of registration and favorite or non-favorite school categories. In addition, the results of system design in this study can be developed easily if requires added external data. Such as data of SMK/SMK school graduates in the area or data of students enrolling in other universities. This is one of the superiority of semantic-based data warehouses.
Promotion, enrollment, data mining, k-means clustering, data warehouse, semantic
Short address: https://sciup.org/15016124
IDR: 15016124 | DOI: 10.5815/ijieeb.2018.02.02
Text of the scientific article Decision support system to determine promotional methods and targets with k-means clustering
Published Online March 2018 in MECS
The management and utilization of new student enrollment data need to be optimized. Each year, The pile of data generated from the new admissions system continues growing, but the data will be trash if there is no further utilization. In line with the difficulties of the management STMIK Amikom Purwokerto in formulating promotional strategies, such as determining the method of promotion and determining the target roadshow to high school / vocational school, the pile of the data can be reprocessed to be the solution of the problem [1]. The determination of the roadshow target becomes a very important thing because this activity requires a lot of cost and human resources. Therefore it needs to be optimized in choosing the target roadshow so that the activities undertaken can minimize the cost but get the benefits as big as possible.
The development of technology is very rapid, especially on the handling of data on a large scale. The data warehouse is one of the technologies that can be selected in the case [1]. The data warehouse is a data storage that is managed separately from the transactional database and it is possible to be integrated with various applications [2]. Several methods in data warehouse development have also been done. such as the development of semantic-based data warehouses that are being extracted using ontology methods. Semantic-based data warehouses are developed because they see some weaknesses in traditional data warehouse such as stages to generate OLAP reports that must go through several processes such as landing zone, staging area, integrated store, and analytic layer, Whereas it’s previously already through the ETL process (extract, transform, load) [1]. Semantic-based data warehouses can handle different data sources, both internal and external sources, where external data handling has many challenges such as characteristics, structural, and heterogeneous syntax [3][4][5][6].
In the utilization of registration data as a formulation of promotional strategy not only requires data warehouse but also requires other methods. One of The methods that can be used in data analysis in large scale is data mining. Data mining can do several things including classification, clustering, and predictive. A combination of methods is also often done to obtain optimal results. Such as clustering fusion with classification to know the student’s ability in effort on the student placement at the campus which is based on the ability of each student [7].
Marketing party can utilize the pile of the data as a supporter in making a decision such as determining promotional methods and promotional targets. The decision support system to determine the location of the roadshow at Telkom University is one of the executors. This research uses Weighted Sum Model (WSM) method to determine the weight of each school, then the weighting result is done ranking to know some recommended roadshow targets [8]. Based on the existing problems, this research will be built decision support system to determine the target roadshow and promotion methods appropriate. The data source is taken from the transactional database of the PMB system which is then processed into a data warehouse and integrated with data mining for data analysis. The structure of the paper is organized as follows: Section II presents the related work, the method used is presented in section III. Section IV present result and discussion, section V present the conclusion and future work, and references presented in the end section.
-
II. Related Work
Related research as an ingredient to map the current research position, so as to know the extent of research on decision support system in the field of education conducted, and know the technology and methods used. The decision support system in the field of marketing at the university has been done by Ammar Naufal, Amelia Kurniawati, and Muhammad Azani Hasibuan [8]. This study aims to determine the target roadshow to be conducted Telkom universities. The problem of roadshow activities carried out requires a lot of costs, so it is impossible all schools visited. Therefore Telkom university wants schools that become the roadshow target have been done the selection, and only taken some of the most potentials. The method used is the Weight Sum Model (WSM) and produces a decision support system that can weight the criteria at each school, and automatic reattachments are made for some schools that can be recommended.
Other related research is about the utilization of data warehouse. Ekasari Nugraheni et al. [6] uses a semantic approach in building a data warehouse to address heterogeneous data, uniformity of data, and incomplete data sources required in the data warehouse. With this approach, the problem in the transformation process can be solved. Incomplete data can be retrieved from external sources by taking an external ontology, and then made a new dimension to suit the needs.
Pooja Thakar et al. [7] create a model to predict students' abilities. Most failures of students in academic education caused there is no match between the ability of students and material provided or not placed on the appropriate campus. Models built using clustering and classification can predict the ability of each student with a good degree of accuracy. This model can also handle large, multi-variant, unbalanced and heterogeneous data sets.
Research now builds a decision support system by combining semantic data warehouse with k-means clustering. The data source was obtained from the transactional database of the new student’s admission system (SPMB). This system aims to determine the pattern of applicants who enter the university seen from the origin of the school, local origin, and can determine the recommended roadshow target for the marketing.
-
III. Method
There are two methods used in this research, the first is the ontology method, to build the semantic-based data warehouse, and the second is data mining methods, using k-means clustering algorithm for data analysis.
-
A. Data Warehouse
The data warehouse is a very important early stage to perform data mining operations. Data sourced from the data warehouse has a higher level of quality because it has a time control that can distinguish between new data and existing data, also through data cleaning steps such as deleting duplicate rows of data, standardizing attribute values, replacing missing values and others [2] [9].
Different sources of data stored in different places with different data formats make the data analysis process very difficult. Need an automatic system, which can uniform data format so that data can be easier to be analyzed. The semantic data warehouse can be one of the problem solutions because it has standardization in storage, that is in RDF format, as well as easy to read by machine [10].
Ontology is a symbolic representation of object knowledge, object classes, object properties, and relationships among objects to represent a knowledge of application domains [11]. Tools for implementation of this method using protégé 5.2. The output form of this process is an owl file with RDF format.
Numerous applications and ontologies have been developed based on the temporal models with the objectives of incorporating time into RDF and OWL structures. After defining time, is understanding and knowing how to process the stored information based on temporal models and then selecting an appropriate language to query and extract new knowledge from the knowledge base [12].
-
B. Data Mining
Knowledge Discovery in Databases (KDD) is an automatic, exploratory analysis and modeling of large data repositories. KDD is the organized process of identifying valid, novel, useful, and understandable patterns from large and complex data sets. Data Mining (DM) is the core of the KDD process, involving the inferring of algorithms that explore the data, develop the model and discover previously unknown Patterns [13][14].
Data mining problems can be broadly categorized into supervised or unsupervised learning models. Supervised or directed data mining tries to infer a function or relationship based on labeled training data and uses this function to map new unlabeled data. Supervised techniques predict the value of the output variables based on a set of input variables. Unsupervised or undirected data mining uncovers hidden patterns in unlabeled data. In unsupervised data mining, there are no output variables to predict. The objective of this class of data mining techniques is to find patterns in data based on the relationship between data points themselves. An application can employ both supervised and unsupervised learners [15].
Clustering allows a wide variety of definitions of similarity, some of which are not clearly defined in closed form by a similarity function. A clustering problem can often be defined as an optimization problem, in which the variables of the optimization problem represent cluster memberships of data points, and the objective function maximizes a concrete mathematical quantification of intragroup similarity in terms of these variables [16].
The Clustering algorithm is one of the most popular algorithms because of its simplicity, flexibility, and scalability. However, it involves many iterations for distance computation between points and cluster centers and due to increased cost per iteration, the scalability of the algorithm gets hampered. Improving the algorithm in this aspect is a focus of many optimization types of research [17].
K-means clustering is a widely accepted method of data clustering, which follow a partitioned approach for dividing the given data set into non-overlapping groups. Unfortunately, it has the pitfall of randomly choosing the initial cluster centers. Do to its gradient nature, this algorithm is highly sensitive to the initial seed value. A novel kernel-based algorithm is an algorithm for initializing the k-means clustering. The idea is to select an initial point from the denser region because they truly reflect the property of the overall data set. Subsequently, we are avoiding the selection of outliers as an initial seed value [18].
Decision Support Systems (DSS) deal with semistructured problems. Such problems arise when managers in organizations are faced with decisions where some but not all aspects of a task or procedure are known. To solve these problems and use the results for decision-making, requires the judgement of the manager using the system [19].A. Newel [20] depicts human decision-making as a three-stage process. These stages are:
-
• Intelligence. The identification of a problem (or opportunity) that requires a decision and the collection of information relevant to the decision.
-
• Design. Creating, developing and analyzing alternative courses of action.
-
• Choice. Selecting a course of action from those available.
The decision process and the knowledge discovery process are dependent on each other. Knowledge discovery, on one hand, enables accumulation of knowledge and as a result, facilitates better decision process. On the other hand, decisions set rules and directions which influence objectives for knowledge discovery. The use of data mining within information systems consequently means the semantic integration of data mining and decision support [21].
According to the previous researchers, this study uses semantic data warehouse with ontology method. Various advantages offered, such as the ability to handle various data sources and the speed of ETL process is faster than the traditional data warehouse. K-means clustering algorithm is used in the process of analysis. The dataset is taken from the semantic data warehouse.
-
IV. Result And Discussion
The data warehouse is one of the most important stages in the process of data mining (pre-processing). The dataset to be processed using the previous data mining algorithm performs the ETL process (extract, transform, load) because the better the quality of the dataset the better the analysis by data mining. The process of updating data from the transactional database to the data warehouse is done periodically upon completion of the student registration. Integration data warehouse and data mining to produce a decision support system that can analyze the enrollment data. The result of the analysis is expected to help the marketing to make decisions in formulating promotion strategy. The development of a system can’t be separated from the design of the system architecture. The system architecture is used as a global overview of the system which is a container for the design of processes and data. The design of semantic data warehouse system and data mining analysis can be described in the following figure 1.
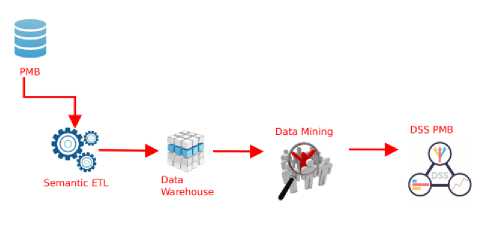
Fig.1. Architecture System
Architecture does not include applications currently running system because the system will be built does not have functional linkages with the PMB system.
The process starts with retrieving data from the transactional database. Uniform format and duplicate data on database transaction will be done ETL process by using the semantic technique. The results of data on the ETL process is then loaded into the semantic data warehouse. Data warehouse by using ontology methods are not contained in SQL or MYSQL databases but are stored in RDF format (OWL file). Distribution of data from OWL to OLAP schema using SPARQL query. The data on the OLAP schema is ready to be done reporting or done the process of using data mining algorithm.
The overall design of the system to be built is shown in Figure 2.
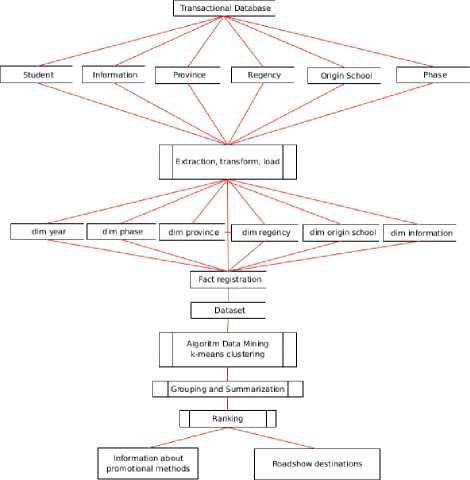
Fig.2. Design system
Starting from taking data from the database of PMB taken some tables that are prospective student table, information, province, district, the origin of school and information. The data from the tables are processed (extract, transform, load) ETL and collected in snowflake format consisting of registration fact, dim year, wave dimension, dim from school, province, district, and dim inform. From the facts and dimensions are generated a data set that will be processed in data mining, which then produces an information that is used as a support in decision making.
Data warehouse design is built using snowflake schema approach. The design of snowflake schema can be seen in figure 3.
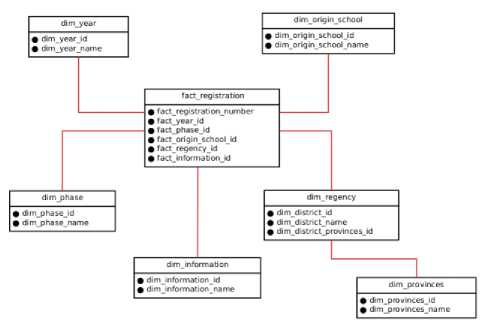
Fig.3. Snowflake schema
The design of this model contains six tables, consisting of one fact table and five-dimensional tables. The fact table contains important components that can assist in management decision making, then dimensional tables are used to describe the components in the fact tables.
In accordance with the design of snowflake schema, the design is implemented using ontology method and with the help of protégé 5.2.0 tools. The first step is to create a class of facts and class of dimensions according to the design of snowflake schema which consists of the registration fact class, the dimension of the year, the dimension of the school origin, the district dimension, the provincial dimension, the phase dimension, and the information dimension. The class can be seen in figure 4.
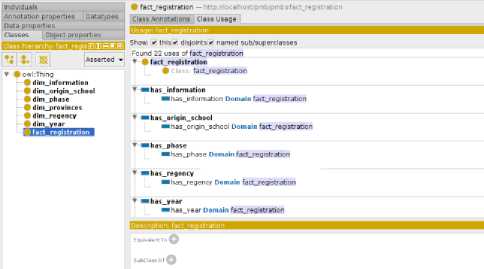
Fig.4. Class in protege
The second step creates object properties to explain the relationships between classes. Example instance class fact_registration with class instance dim_origin_school. This explains the relation/relationship between the two classes. The usual notation made using the word has... and is...of, the example in the school's original dimension has_origin_school and is_origin_school_of.
The third step is to create the data properties that are the contents of each class. The example of the class in the dim_school_origin has the property data of dim_origin_school_id and dim_origin_school_name, as well as with other classes. The same property data of each class can be associated with Equivalent To. For example fact_origin_school_id in class fact_registration equivalent to dim_origin_school_id in class dim_origin_school.
The next step is mapping from the source database to OWL. Mapping is to specify the data or field to be entered in OWL as a semantic data warehouse, and also can change the data type according to the need. Each class both dimension class and fact class is done the mapping. Mapping contains source and target data structures. An example of the mapping of the school's original dimension, the source data is taken from the school table in the source database and targeted to the data schema in the OWL file.
In the OWL file, the data is stored in RDF format and consists of several objects property, data property, classes, and individual’s, as shown in figure 5. Data on the transactional database is stored in the individuals section after going through the semantic ETL process. Then it can be updated periodically when there is data changes in database transactional. Data can be updated automatically and each data has a time value that distinguishes data in each period.
c/owl:ObjectProperty* cowl:ObjectProperty rdf:about®"http://localhost/pmb/pmb#has_phase"* crdfs:domain rdf:resource="http://localhost/pmb/pmb#fact registration"/* crdfs:range rdf:resource®"http://localhost/pmb/pmb#dim phase"/* c/owl:ObjectProperty* cowl:Objectproperty rdf:about®"http://localhost/pmb/pmb#has_infоrmation"* crdfs:domain rdf:resource®"http://localhost/pmb/pmb#fact_registration"/> crdfs:range rdf:resource®"http://localhost/pmb/pmb#dim_information,7> c/owl:ObjectProperty* cowl:0bjectProperty rdf:about®"http://localhost/pmb/pmb#has_regency"* crdfs:domain rdf:resource="http://localhost/pmb/pmb#fact_registration"/* crdfs:range rdf:resource®"http://localhost/pmb/pmb#dim regency"/* c/owl:ObjectProperty* cowl:0bjectProperty rdf:about®"http://localhost/pmb/pmb#has_provinces"> crdfs:domain rdf:resource®"http://localhost/pmb/pmb#dim_regency"/* crdfs:range rdf:resource®"http://localhost/pmb/pmb#dim_provinces'7> c/owl:ObjectProperty* Fig.5. Data Format in OWL File The output of the semantic data warehouse is an OWL file which is then integrated with the data mining algorithm. OWL files are linked by using Jena API and then parsed using the Java programming language. The dataset is then processed using a data mining algorithm and grouping and summarization are used to obtain the expected information. The process of data mining is done in accordance with the provision of the k-means clustering algorithm.
•
Find the value of k, and T = 0.1. Then specify the initial centroid by choosing randomly from the dataset.
•
Calculate the distance of each data to the nearest centroid by using Euclidean distance. The nearest Centroid will be the cluster followed by the data. This is Euclidean distance formula,
d
(
x
,
y
)
—
|
x
-
y
|
=
n Z (X- y.)2
=
1
•
Based on the total on each cluster followed on the old cluster, it can be calculated the value of the objective function (F), if the objective value is above the set threshold (F> T), then proceed to the next iteration. If the objective value is below the set threshold (F After the clustering process is done, the next step to do the validity of the cluster results. Validity is done using the Davies-Bouldin Index (DBI) matrix, the validity of this matrix is to evaluate how well the clustering has been done by calculating the quantity and feature derivative of the data set. The following cluster validity stages:
•
Count Sum of Square Between cluster (SSB)
SSB.j — d(ci,cj)(3)
•
Calculate Ratio (R)
SSW
+
SSW
Ri i - —ij i,j i,j
•
Calculate the Davies-Bouldin Index (DBI)
1KDBI = Z max( Ri, j )
K^
i
*
j
The smaller the DBI value (non-negative ≥ 0) the better the cluster. The existing data in the OWL scheme is then called for an analytical process with the k-means clustering algorithm. Stages of data preparation existing in the data mining scheme are no longer necessary because the stage has been done when extraction from the data warehouse. This is an advantage if the process of data mining analysis performed on existing data in the data warehouse. Integration OWL file with k-means clustering can be seen in figure 6. The integration uses Jena API. Apache Jena is an open source Semantic Web framework for Java. It provides an API to extract data from and write to RDF graphs. The graphs are represented as an abstract "model". A model can be sourced with data from files, databases, URLs or a combination of these. A Model can also be queried through SPARQL.
Ifiasicrofl/lguratorconflguret
■ NullAppender( ));
Model m - Mode I Factory createOntologyftodel(OntMadet$pec OWL MEM RULE INF); m read {in, null, "RDF/XML"); String query ‘PREFIX ; "PREFIX owl: chttp://ww. *\n" "PREFIX rdf: <>' i" "PREFIX xsd: <>\n" "PREFIX xml: <>v. ‘ ■ "PREFIX rdfs: < scheea#>\n" "SELECT * WERE {?pdf a :fact_registration; :factreglsterno ?register no;* ■ " :fact year id Tyear id; :fact phase id /phase id;" - " :fact regency Id /regency id; :fact origin school Id /origin school Id;" ■ " :fact information id /information id}*;
Query
Q = Oueryfactory create(query);
QueryFxecufion tie OweryExecutjonFactory. createfq, m); ResultSet rs qe execSelectl); ■ (rs hasNext{)) { Querysolution next rs next));
String
originschool next getLiteral(H?origin_$chool_id") getValue() toString();
String
regency next getLiteralf"/regency id") getValiref} toStringf);
String phase next getLlteral(“?phase_id") getValuef) toStringf);
String
infonaatian next getLite rail"/information id") getValuef) toStringt);
double[] point w doubleM);
point!G]
Dotib
!e parseDouble(orlgin school);
point!1]
Double
parseDouble(regency);
point!?]
PcwPIp
parseDoubletphase):
point(3] Doubts parseDouble(information); newData Data(point!У), point[I]. point{2], point[3|); tempCataSet add(newData); Fig.6. Integration OWL file with k-means clustering The first stage determines the initial centroid taken from the dataset, is showed in figure 7. Then calculate the distance between objects by using Euclidean distance. Fig.7. Initial centroid
•
Count Sum of Square Within cluster (SSW)
m
i
SSW = — + Z d (Xj, c.) (2)
m
i j
-
1
Then for the distance calculation using the Euclidean distance itself is in figure 8. Math .роИ (c .getmCO - d. getmCO) Math .pow( (c .getmA () - d.getmA()) Fig. 8. Euclidean distance Sample source code calculation of distance and data placement on each cluster shown in Figure 9. if(distance < minimum){ minimum = distance; cluster = j; } " } tempData.cluster(cluster); if(tempData.cluster!) != cluster){ tempData.cluster(cluster); isStillMoving = true; Fig. 9. Calculation of distance and cluster determination The amount of data used as a trial in this study as many as 6171 rows of data. Before deciding to use a semantic ETL-based ontology, firstly testing performance against semantic ETL. Testing is done by comparing the performance of traditional data warehouse. The data testing scenario is divided into sections, including 1000 rows of data, 2500, 4500, and 6,171. The data sharing is done to test the level of consistency of the ETL process speed. The number of 1000 data here as the smallest data used in the test and 6.171 is used as the largest data. The process is done gradually from the smallest amount of data to the largest number. The first stage with 1000 rows of data, semantic data warehouse speed is 3.683 seconds and traditional data warehouse 5.3 seconds. The next process of data is added to 2500 rows of data, ETL shows the speed of semantic data warehouse is 4.613 seconds and traditional data warehouse 8.7 seconds. The next stage of data is added to 4500 rows of data, the speed of the ETL process on the semantic data warehouse is 5.192 seconds and traditional data warehouse 17.7 seconds. The last stage is the total data as much as 6171 rows of data show semantic data warehouse speed is 6.617 seconds while the traditional data warehouse 24.2 seconds. So with the difference in speed performance between the semantic data warehouse and traditional data warehouse, it was decided to use semantic data warehouse using ontology method. Related components that underlie the testing process such as infrastructure, data sources, and the amount of data performed under the same conditions. With regard to infrastructure, the computer specifications used are as follows:
•
Storage using SSD
•
RAM 6 GB
•
OS using Linux Ubuntu 16.04
•
VGA 820 M 2GB
•
Core I5
Then the data source used is taken from the same database, and the same number of rows is 6171. The results of the clustering process turned out to produce 4 clusters as the best number. Each cluster is then grouped and summarization. The results of each cluster for the origin of the district and school origin are shown in tables 1, 2, 3, and 4. Table 1. Cluster 1 origin regency and school
No
Regency
Amount
School Origin
Amount
1
Banyumas
264
SMK Muhammadiyah Majenang
12
2
Cilacap
127
SMK Telkom Purwokerto
7
3
Brebes
75
SMK N 1 Kaligondang
7
4
Purbalingga
61
SMK Ma'arif 1 Kroya
7
5
Banjarnegara
31
SMK Ma’arif NU Bobotsari
7
…………..
…..
Table 2. Cluster 2 origin regency and school
No
Regency
Amount
School Origin
Amount
1
Banyumas
810
SMK Kesatrian Purwokerto
111
2
Cilacap
360
SMA N 3 Purwokerto
87
3
Purbalingga
236
SMA N Baturaden
62
4
Banjarnegara
131
SMK Bakti Purwokerto
59
5
Brebes
94
SMK N 2
Banyumas
55
…………..
…..
Table 3. Cluster 3 origin regency and school
No
Regency
Amount
School Origin
Amount
1
Banyumas
1670
SMK N 1 Purwokerto
161
2
Purbalingga
363
SMK Wiworotomo Purwokerto
158
3
Cilacap
349
SMA
Muhammadiyah 1 Purwokerto
122
4
Brebes
130
SMK N 2 Purwokerto
100
5
Banjarnegara
53
SMK YPT 2 Purbalingga
97
…………..
…..
Table 4. Cluster 4 origin regency and school
No
Regency
Amount
School Origin
Amount
1
Banyumas
333
SMK N 1 Bukateja
21
2
Cilacap
189
SMK Karya Teknologi Jatilawang
18
3
Brebes
139
SMA N 1
Kedungreja
17
4
Purbalingga
114
SMA N 1 Wangon
17
5
Banjarnegara
87
SMK N 2 Purbalingga
15
…………..
…..
Each cluster has different analysis conclusions. The results of the analysis form a pattern of applicants from the side of their school. Based on school category variables consisting of favorite, medium, and nonfavorite schools, each cluster is divided into each category. Clusters 1 and 4 are almost uniformly composed of registries from non-favorite schools. Cluster 2 consists of middle-class schools and cluster 3 consists of favorite category schools and with large numbers. As for the cluster results of the wave and promotional methods used are shown in tables 5, 6, 7, and 8. Table 5. Cluster 1 phase dan information
No
Phase
Amount
Information
Amount
1
I
229
brochure
613
2
II
217
friends/relations
97
3
III
173
internet
26
4
Exclusive
122
others
4
5
tv
1
Table 6. Cluster 2 phase dan information
No
Phase
Amount
Information
Amount
1
I
727
brochure
1508
2
II
512
friends/relations
185
3
III
298
internet
38
4
Exclusive
210
others
11
5
tv
5
Table 7. Cluster 3 phase dan information
No
Phase
Amount
Information
Amount
1
I
1065
brochure
2294
2
II
709
friends/relations
271
3
III
454
internet
63
4
Exclusive
409
others
7
5
tv
2
Table 8. Cluster 4 phase dan information
No
Phase
Amount
Information
Amount
1
I
442
brochure
873
2
II
305
friends/relations
129
3
III
185
internet
34
4
Exclusive
114
others
7
5
tv
3
Based on clusters in tables 5, 6, 7, and 8 there can be found a registrant pattern from the wave of registration and what information media they use. From the wave of registration can be used to determine the status of universities based on community appraisal, but this pattern will be valid if this data is compared with data of high school / vocational graduates who enter at other universities in the area. So which is bigger than the percentages of the number of graduates who enroll in other universities with STMIK Amikom Purwokerto. If the percentages that register to STMIK Amikom Purwokerto already exceed 50% then the next step is to see the results of each cluster. Seen from each cluster, more students enrolled in wave I and II, especially on cluster 3, when viewed from the origin of their school they mostly come from schools with favorite categories. Other information that can be obtained from each cluster is about the information media they use to know the registration information. From all clusters, it can be seen that the brochure media is more widely used by students, compared to internet and tv. The design of the built system can automatically determine the list of schools that will be the destination of the roadshow. By grouping and summarization on each cluster then done ranking will be taken some schools that will be recommended to be a target roadshow. The number of recommended schools can be determined by the user as needed. In this research, the decision support system in determining the roadshow target can run well and produce some patterns found from the registrant. So besides the target roadshow generated, the analysis of the resulting cluster is also useful for the marketing in preparing the promotion strategy. Patterns of registries such as the origin of registrants based on favorite and non-favorite category schools may also be taken into consideration. In addition, more information media dominated by brochure media, it can be concluded that students tend to like specific information, they don’t need to bother themselves looking for information on the web or other media on the internet. Future research can be added other data sources such as data of registrants who enter at other universities in the area. The data source can be taken from an external source and then made a new dimension to the semantic data warehouse built on this research. This is one of the advantages of data warehouse semantics, it is easy to integrate different data sources with different data types.
V.
Conclusion and Future Work
References Decision support system to determine promotional methods and targets with k-means clustering
- Ambara M. P., Sudarma M., and Kumara I. N. S., “Semantic Data Warehouse Design System With Ontology And Rule Based Methods To Process Academic Data XYZ University in Bali”, Elektro Technology, Vol. 15, No 1, 2016.
- Han J., Kamber M., Pei J., Data mining concepts and techniques, USA: Third Edition, Morgan Kaufmann Publisher, 225 Wyman Street, Waltham, MA 02451; 2012.
- Kardina A., Diana N. E., “Visualitation of Ontology-Based Data Warehouse for Malaria Spread Incidences Using Protege”, Journal of Information System, Vol. 12, 2016.
- Khouri S., Abdellaoui S., and Nader F., “Avoiding Ontology Confusion in ETL Processes”, Springer, pp. 119-126, 2015.
- Ta’a A. and Abdullah M. S., “Goal-Ontology Approach for Modelling and Designing ETL Processes”, Elsevier, 942-948, 2011.
- Nugraheni E., Akbar S., and Saptawati G. A. P., “Framework of Semantic Data Warehouse for Heterogeneous and Incomplete Data”, IEEE, 2016.
- Pooja Thakar, Anil Mehta, Manisha, "A Unified Model of Clustering and Classification to Improve Students’ Employability Prediction", International Journal of Intelligent Systems and Applications(IJISA), Vol.9, No.9, pp.10-18, 2017. DOI: 10.5815/ijisa.2017.09.02.
- Naufal A., Kurniawati A., and Hasibuan M. A., “Decision Support System of SMB Telkom University Roadshow Location Prioritization With Weighted Sum Model Method”, IEEE, 2016.
- Kotu Vijay and Deshpande Bala. Predictive Analytics and Data Mining: Concepts and Practice with RapidMiner. Morgan Kaufmann Publisher, 225 Wyman Street, Waltham, MA 02451, USA, 2015.
- Niinimaki M. and Niemi T., “An ETL Process for OLAP Using RDF/OWL Ontologies”, Journal on Data Semantics XIII, LNCS 5530, pp. 97-119, 2009.
- Lim S. C. J. and Liu Y., “Ontology in Design Engineering: Status and Challenges”, International Conference on Engineering Design (ICED15), 2015.
- Bahareh Bahadorani, Ahmad Zaeri,"Comparison of Time Concept Modeling for Querying Temporal Information in OWL and RDF", International Journal of Information Technology and Computer Science(IJITCS), Vol.9, No.7, pp.26-34, 2017. DOI: 10.5815/ijitcs.2017.07.03.
- Ye Nong, Data mining: Theories, Algorithms and Examples,Taylor & Francis Group, LLC, 2012.
- Maimon O. and Rokach L., Data mining and Knowledge Discovery Handbook, USA: Second Edition, Springer Science+Business Media, LLC, 233, Spring Street, New York, NY 10013, USA, 2010.
- Kotu V. and Deshpande B., Predictive Analytics and Data Mining: Concepts and Practice with RapidMiner, USA: Morgan Kaufman is and imprint of Elsevier 225 Wyman Street, Waltham, MA 02451, USA, 2015.
- Anggarwal C. C., Data mining, Springer International Publishing Switzerland, 2015.
- Preeti Jain, Dr. Bala Buksh, "Accelerated K-means Clustering Algorithm", International Journal of Information Technology and Computer Science(IJITCS), pp.39-46, 2016. DOI: 10.5815/ijitcs.2016.10.05
- Ajay Kumar, Shishir Kumar, "Density Based Initialization Method for K-Means Clustering Algorithm", International Journal of Intelligent Systems and Applications(IJISA), Vol.9, No.10, pp.40-48, 2017. DOI: 10.5815/ijisa.2017.10.05
- Averweg, U. R. F., Decision-making support systems: Theory & practice, Durban, South Africa, 2012.
- Newell, A. and Simon, H.A., Human Problem Solving. Englewood Cliffs, NJ: Prentice-Hall, 1972.
- Jao, C. S., Decision Support Systems, Publisher Intech India, 2010.
