Decoupling in environmental and economic development of regions-participants of cross-border cooperation

Author: Zabelina Irina A.
Journal: Economic and Social Changes: Facts, Trends, Forecast @volnc-esc-en
Section: Environmental economics
Article in issue: 1 (61) т.12, 2019.
Free access
Moving towards “green” economy is currently a priority direction for the development of many countries, including Russia. One of the key aspects of the concept of green economy is achieving decoupling or misalignment of economic growth rates, resource consumption and negative environmental impact. The purpose of the article is to analyze the decoupling of negative environmental impact and resource consumption in economic activity in border regions of the Russian East and the entities of the Baikal region with cross-border economic relations with China. The research novelty lies in identifying the possible impact of cross-border position on environmental and economic development of the areas under review. Long-term experience of cooperation with the neighboring state demonstrates that prospects are followed by environmental problems since the economy of Siberian and Far Eastern regions is consistently focused on raw materials. The decoupling coefficient is calculated to identify the misalignment between economic growth rates and environmental pollution...
Economic development, negative environmental impact, natural resources, environmental capacity, decoupling, regions of cross-border cooperation
Short address: https://sciup.org/147224133
IDR: 147224133 | UDC: 504.062 | DOI: 10.15838/esc.2019.1.61.15
Text of the scientific article Decoupling in environmental and economic development of regions-participants of cross-border cooperation
Currently, the need and possible ways to shift towards “green” economy, which is aimed at improving people’s welfare and quality of life, as well as reducing risks to the environment and its degradation [1, p. 1], is widely discussed in works of Russian and foreign researchers [2– 8, etc.]. One of the key aspects of the concept of “green” economy is achieving the effect of decoupling, which is the misalignment of economic growth rates, on the one hand, and resource consumption and negative environmental impact, on the other hand [9, p. 62]. There are two types of decoupling: resource decoupling and impact decoupling [10, p. 4]. Resource decoupling involves reducing the consumption of primary resources (energy, water, minerals, etc.) per unit of economic result. In this case, we are talking about the “dematerialization” of economy and improving efficient use of resources in production of economic benefits. Impact decoupling implies an increase in production volume while reducing the environmental burden (pollutant emissions into the atmosphere, wastewater discharge, waste generation, etc.).
A large number of research works are devoted to studying the decoupling effect. Some of them focus on analyzing the relations between economic growth and degree of environmental pollution at the national level [11, 12]. The works by Russian authors pay much attention to the study of trends in economic development, resource consumption and environmental pollution at the level of federal districts [3], regions, and separate industries [13–16].
The purpose of the article is to analyze the effects of decoupling of the negative environmental impact and resource consumption in economic activity of border regions of the Russian East and the entities of the Baikal region with crossborder economic relations with China. For many of them, the problem of the impact of economic development on the environment and public health is particularly relevant since the total environmental load in these areas (for example, per capita or unit of economic result) significantly exceeds the average Russian level [17]. The current form of crossborder relations with the neighboring state, within the framework of which projects are implemented in Eastern regions mainly in mineral extraction and processing, together with the prospects poses certain threats [18]. The proximity to China and its interest in importing fuel and energy, mineral and forest resources for own production ensure the focus of economies of most Eastern regions-participants in cross-border cooperation on resources. The predominant development of the primary sector of the economy, characterized by a low degree of mineral processing does not ensure an increase in population’s welfare corresponding to economic growth. Moreover, there are cases when Chinese companies do not fulfill the terms of license agreements. For example, LuNeng Mining Group1 engaged in iron ore extraction at the Berezovsky Deposit in Zabaykalsky Krai have repeatedly pushed the deadline for constructing a mining processing plant. Currently, open-cast ore is exported to China, while Russian citizens hired for this purpose receive monetary remuneration in the territory of the neighboring state. Thus, China has greater benefit from this cooperation while the positive effects from implementing joint projects for the border territory of Russia are not so obvious.
Research methods and sources of information
Decoupling can be interpreted in terms of indicators of environmental capacity [9]. They reflect the degree of natural resource consumption (for example, energy intensity, water capacity, etc.) and pollution (ecointensity) per unit of economic output, which is most often used as the main measure of level of economic development – GDP (at the regional level – GRP). The concept of impact decoupling is directly related to eco-intensity, which is studied in a large number of works by Russian and foreign researchers [19–21, etc.]. In order to identify the misalignment between economic growth rates and environmental pollution, the decoupling coefficient is used, which is calculated according to Formula (1) [12]:
Dt
= 1
—
Et/
Eo / /Г о
where E0 and Et – indicators characterizing the negative environmental impact in the reference and current period; Y0 and Yt – indicators characterizing the economic result in the reference and current periods, respectively.
The Dt coefficient shows the change in ecointensity ( E / Y ) relative to the beginning of the study period. Its negative value indicates the absence of decoupling. The positive value of Dt indicates contrasting trends in economic development and anthropogenic impact: the increase in value added is accompanied by a decrease in environmental load on the environment. It is noteworthy that this condition is weaker than the criterion used in the model of P. Victor [6] for assessing the performance of eco-economic development from the perspective of the concept of “green” growth. However, the decoupling rates of economic development and environmental pollution indicate to shift towards “green” economy [18, 22].
The resource management efficiency in the process of creating economic benefits can be assessed through one of private indicators of environmental intensity – energy intensity, i.e. energy costs per unit of final product [23]. The indicator is calculated according to Formula (2):
V
E = Q , (2)
where V – energy resources consumed in production process; Q – output (can be expressed both in natural and in cost form).
The present paper uses the following official data of the Federal State Statistics Service, Territorial unit of the Federal State Statistics Service in Zabaikalsky Krai, PAO Territo-rial’naya generiruyushchaya kompaniya no. 14 (PAO TGK-14), AO Inter RAO –
Elektrogeneratsiya, branch of AO SO UES Trans-Baikal regional dispatching department (RDD) (values are reduced to comparable form):
– Gross Regional Product (GRP);
– contribution of main economic activities (MEA) to GRP;
– pollutant emissions from stationary sources;
– polluted wastewater discharges;
– produced electric and thermal energy (kWh) and energy resources consumed by generation facilities (coal, fuel oil and electric energy in terms of conventional fuel using appropriate coefficients2) in the model region (Zabaikalsky Krai).
The time frame of the research is determined by the availability of statistics on economic activities, which are presented for the period from 2005 to 2016. Two time intervals were covered:
-
1) 2005–2016 – to identify the decoupling in Russia and the regions of cross-border cooperation with China;
-
2) 2009–2016 – to assess the possible impact of the border position on the eco-economic development of the Eastern regions.
The assessment of energy intensity of electric and thermal energy generation in Zabaikalsky Krai was carried out for the period from 2009 to 2017.
Research results and their analysis
Impact decoupling. The analysis of the impact of economic activities on the environment in regions of cross-border cooperation shows that the situation cannot be characterized as quite good. During 2005–
2016, pollutant emissions from stationary sources in the Amur and Irkutsk oblasts and the Republic of Buryatia increased. The formation of such type of environmental load in Eastern regions is provided by thermal power plants operating mainly on solid fuel. Despite the fact that the main volume of electric energy in the Irkutsk Oblast is generated at a relatively atmosphere-friendly water power plant of Angarskii cascade, the share of power generation accounts for more than 40% of total pollutant emissions from stationary sources3.
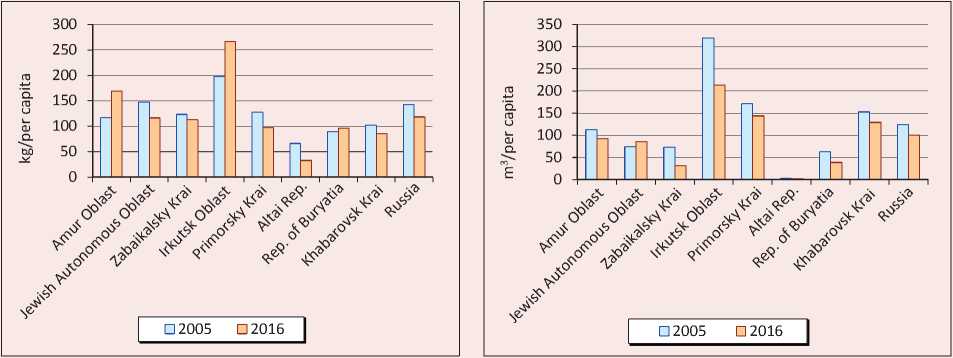
Figure 1 presents per capita indicators of environmental load in Russia and Eastern regions. In some of them, especially in the Irkutsk Oblast, the average Russian values for certain types of negative impact are significantly exceeded. Moreover, during the period under review in the Jewish Autonomous Oblast, the Republic of Buryatia, the Amur and Irkutsk oblasts there was an increase in total pollution.
To identify decoupling in the development of national and regional economies we calculated Dt coefficient. In all Russian regions, misalignment of trends in economic development and environmental pollution is manifested in relation to the discharge of contaminated wastewater ( Tab. 1 ). In the period from 2005 to 2016, the Dt coefficient is positive, the value varies from 0.17 (Jewish Autonomous Oblast) to 0.70 (Zabaikalsky Krai). However, it is noteworthy that the relatively favorable situation in many regions may be explained by an insufficiently high quality of monitoring wastewater discharges into water bodies, rather than a really reduced negative impact. For example, in Zabaikalsky Krai cases of violations of environmental
Figure 1. Per capita indicators of environmental load in Russia and regions of cross-border cooperation with China
-
a) contaminated wastewater discharge
-
b) atmospheric pollutant emissions from stationary sources
Calculated according to: Russian regions. Socio-economic indicators. Available at: http://www.gks.ru/wps/wcm/connect/ rosstat_main/rosstat/ru/statistics/publications/catalog/doc_1138623506156 (accessed: 14.06.2018).
Table 1. Impact decoupling coefficient (Dt) in regions of cross-border cooperation with China and Russia
|
Region/country |
Contaminated wastewater discharge |
Pollutant emissions from stationary sources |
Emissions of most common pollutants from stationary sources |
|||||||||||
|
Sulphur dioxide |
Carbon oxide |
Nitrogen oxide |
Solid waste |
Hydrocarbons, including volatile organic compounds |
||||||||||
|
s |
s |
|||||||||||||
|
Amur Oblast |
0.39 |
0.15 |
-0.07 |
-0.11 |
0.21 |
-0.03 |
-0.07 |
-0.01 |
-0.87 |
-0.69 |
0.10 |
-0.07 |
-5.07 |
-2.52 |
|
Jewish Autonomous Oblast |
0.17 |
-0.002 |
0.43 |
-0.01 |
0.42 |
0.15 |
0.28 |
-0.05 |
0.59 |
-0.08 |
0.49 |
0.01 |
0.38 |
-0.002 |
|
Zabaikalsky Krai |
0.70 |
0.67 |
0.36 |
0.20 |
0.12 |
0.17 |
0.41 |
0.18 |
0.35 |
0.26 |
0.46 |
0.25 |
0.12 |
0.18 |
|
Irkutsk Oblast |
0.63 |
0.40 |
0.25 |
0.15 |
0.18 |
0.13 |
-0.003 |
-0.09 |
0.002 |
0.22 |
0.56 |
0.36 |
0.61 |
0.32 |
|
Primorsky Krai |
0.39 |
0.23 |
0.45 |
0.23 |
0.59 |
0.33 |
0.40 |
0.10 |
0.31 |
0.18 |
0.45 |
0.32 |
-1.77 |
-1.42 |
|
Altai Republic |
0.39 |
-0.16 |
0.60 |
0.38 |
0.58 |
0.38 |
0.61 |
0.33 |
0.53 |
0.13 |
0.64 |
0.46 |
– |
– |
|
Republic of Buryatia |
0.44 |
0.15 |
0.02 |
0.01 |
-0.22 |
-0.10 |
0.17 |
-0.004 |
-0.09 |
0.11 |
0.18 |
0.15 |
-4.08 |
-3.52 |
|
Khabarovsk Krai |
0.33 |
0.20 |
0.34 |
0.11 |
0.46 |
0.30 |
0.07 |
-0.04 |
0.15 |
-0.05 |
0.57 |
0.37 |
-0.59 |
-0.59 |
|
Russia |
0.38 |
0.21 |
0.37 |
0.22 |
0.36 |
0.22 |
0.44 |
0.24 |
0.18 |
0.10 |
0.54 |
0.37 |
0.23 |
0.18 |
Compiled from: National accounts. Available at: (accessed: 23.05.2018); Environmental protection in Russia. Available at: ru/statistics/publications/catalog/doc_1139919459344 (accessed: 24.05.2018). Main indicators of environmental protection. Available at: http: // (accessed: 23.05.2018).
legislation are regularly recorded: illegal discharge of untreated wastewater by resource users4 takes place. Moreover, many operating treatment facilities are almost dilapidated and do not ensure proper quality of wastewater treatment5.
There is no decoupling regarding emissions from stationary sources in some regions (the Republic of Buryatia, the Amur and Irkutsk oblasts, Primorsky and Khabarovsk krais). This is most obvious when analyzing the situation in the context of most common pollutants. During the period of active development of cross-border relations with China (2009– 2016) in some regions, the Dt coefficient takes negative values. This indicates that economic development is accompanied by intensified air pollution. In the Jewish Autonomous Oblast such a situation is observed in terms of total pollutant emissions, emissions of carbon monoxide, nitrogen oxides, and hydrocarbons.
The prospects for socio-economic development of Eastern territories are mainly associated with the expansion of mining, fuel and logging, and a significant part of the Russian-Chinese projects planned and already being implemented in Russian regions is focused primarily on the extraction and primary processing of mineral resources [18, 24]. Thus, an important aspect of the present research is the analysis of eco-economic development of the following economic activities: mineral extraction (Section C of the all-Russian MEA classifier operating in the study period), processing (Section D) and production and distribution of electric energy, gas and water (Section E). The results were visualized through a box plot [12], which demonstrates the distribution of the decoupling coefficient by analyzed MEA among the regions under review (Fig. 2). This type of data representation shows several values at the same time: the first and third quartiles (the lower and upper surface of the rectangle separated by 25 and 75% of the sample), the median (a marker inside the rectangle), the minimum and maximum values, and outliers (separate points that stand out from the total sample).
In terms of the negative impact on the atmosphere in most Eastern regions decoupling is recorded in the development of all three types of economic activities. In 2005–2016, the median value in all cases is over zero (see Fig. 2a ). This suggests that at least 50% of all test values are positive.
However, it does not exist in some entities. For example, the minimum value of the Dt coefficient in mining – in the Jewish Autonomous Oblast ( Dt =-2.41), where the contribution of Mining in the region’s gross value added in recent years has steadily increased. In 2017, industrial production index in mining grew 4.7 times compared to 20166. This is explained by higher iron ore concentrate output due to the operationalization of the Kimkano-Sutarskii mining and processing plant, whose construction was among key projects of the
Figure 2. Impact decoupling coefficient ( D t ) distribution among regions of cross-border cooperation: pollutant emissions from stationary sources

-1
-2
-3
-4
-5

Zabaikalsky Krai
о
Ф О it
Ф о о
О)
Section C Section D
Section E
-1
-2
-3
ф Q
-4
-5


Amur Oblast
Zabaikalsky Krai
Section C
Section D
Section E
a) 2005 and 2016
b) 2009 and 2016
Compiled from: National accounts. Available at: accounts/# (accessed: 23.05.2018); Environmental protection in Russia. Available at: rosstat_main/rosstat/ru/statistics/publications/catalog/doc_1139919459344 (accessed: 24.05.2018). Main indicators of environmental protection. Available at: catalog/doc_1140094699578 (accessed: 23.05.2018).
Cross-Border Cooperation Program7. Now this enterprise is one of the main sources of atmospheric pollutants in the Jewish Autonomous Oblast8. In another border region – the Amur Oblast – the misalignment of economic growth and negative impact on the atmosphere has not been revealed in all sectors, while rapid development of border relations with the dynamically developing China does not change the situation. The value of decoupling coefficient is negative for all MEA ( Tab. 2 ).
Data in Table 2 suggest that the eco-economic development of processing industries in some regions was characterized by lack of decoupling (Zabaikalsky Kai, the Amur Oblast, republics of Altai and Buryatia). The minimum Dt value (indicated by a dot in Figure 2 because it stands out from all the values) is marked in Zabaikalsky krai, where Processing ensure a small contribution to gross value added (2.8–4% in current prices). At the same time, during the period of active development of the Russian-Chinese relations, we observe a more unfavorable situation: the value of the studied indicator is significantly lower ( Dt =-4.87) than the value obtained for the time interval from 2005 to 2016 ( Dt =-2.34). In recent years, this region has preserved the downward trend in production in processing industries (except
Table 2. Impact decoupling coefficient ( D t ) in regions of ross-border cooperation with China and Russia: pollutant emissions from stationary sources
|
Region/country |
Section C “Mineral extraction” |
Section D “Processing” |
Section E “Production and distribution of electric energy, gas and water” |
|||
|
2005 and 2016 |
2009 and 2016 |
2005 and 2016 |
2009 and 2016 |
2005 and 2016 |
2009 and 2016 |
|
|
Amur Oblast |
-0.75 |
-0.65 |
-0.07 |
-0.38 |
-0.34 |
-0.09 |
|
Jewish Autonomous Oblast |
-2.41 |
0.14 |
0.43 |
0.00 |
0.82 |
0.35 |
|
Zabaikalsky Krai |
0.91 |
0.86 |
-2.34 |
-4.87 |
0.05 |
0.35 |
|
Irkutsk Oblast |
0.46 |
-0.14 |
0.20 |
0.27 |
0.25 |
0.18 |
|
Primorsky Krai |
-0.68 |
-0.98 |
0.46 |
0.41 |
0.29 |
0.23 |
|
Altai Republic |
- |
- |
-0.33 |
-1.61 |
0.75 |
0.38 |
|
Republic of Buryatia |
0.57 |
0.30 |
0.13 |
-0.34 |
-0.54 |
0.30 |
|
Khabarovsk Krai |
0.09 |
-0.13 |
0.27 |
0.10 |
0.18 |
0.17 |
|
Russia |
0.33 |
0.14 |
0.38 |
0.31 |
0.23 |
0.19 |
Compiled from: National accounts. Available at: (accessed: 23.05.2018); Environmental protection in Russia. Available at: ru/statistics/publications/catalog/doc_1139919459344 (accessed: 24.05.2018). Main indicators of environmental protection. Available at: (accessed: 23.05.2018).
for food processing and other industries)9. At the same time, the negative impact on the atmosphere produced by processing enterprises has increased significantly over the period under review: pollutant emissions increased more than three times compared to 2005.
In regions of cross-border cooperation, Production and distribution of electricity, gas and water provides from 3.6% (Primorsky Krai) to 7.3% (the Amur Oblast) of GRP10. Production of heat and electricity, as well as mineral extraction has a complex impact on the environment. In the regions under consideration, production of electric and thermal energy is carried out mainly at coal power plants whose emissions includes pollutants such as solid particles (soot), sulfur dioxide, nitrogen oxides and carbon monoxide. Power engineering companies account for 46% (Irkutsk Oblast) to 74% (Amur Oblast) of the total atmospheric pollutants from stationary sources11. The most noticeable increase in the contribution of this industry to total pollution compared to 2005 is recorded in the Amur Oblast, Zabaikalsky Krai and the Republic of Buryatia (for the considered time interval in these regions, emissions from power engineering enterprises increased by more than 1.3 times).
Analysis of data characterizing the eco-economic development of electric engineering helps conclude that there is no decoupling in two regions: the Amur Oblast and the Republic
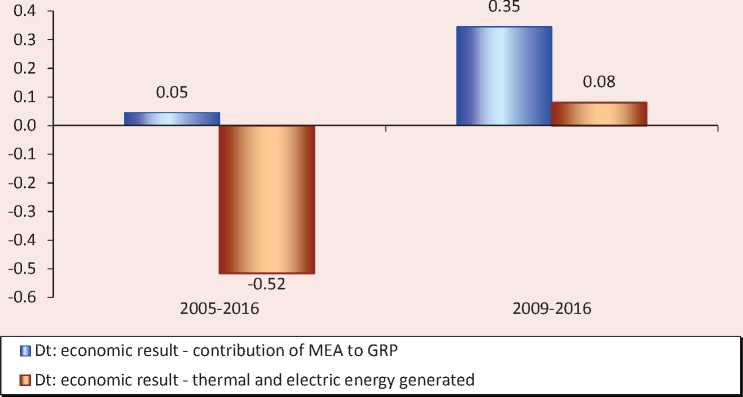
Figure 3. Decoupling coefficient ( D t ) for Zabaikalsky Krai’s power engineering: pollutant emissions from stationary sources
Calculated according to: Statistical yearbook of Zabaikalsky Krai, 2011. Chita, 2011. 299 p; Zabaikalsky Krai–2016 . Chita, 2017. 311 p.
of Buryatia (for 2005–2016). In other cases, there is a separation of economic development trends and air pollution. The highest Dt values are recorded in the Jewish Autonomous Oblast and the Altai Republic, both with a significant decrease in the environmental load during the considered time interval. However, it is noteworthy that the use of natural quantities as an economic result (for example, an indicator such as the amount of heat and electricity generated, kWh) in calculations may slightly change the resulting situation. This is demonstrated by analysis of one of the border regions –Zabaikalsky Krai ( Fig. 3 ).
During 2005–2016, Dt takes a negative value ( Dt =-0.52), which indicates the absence of decoupling in the development of power engineering in the region. Thus, the performance of cost indicators is influenced by the effect of rising tariffs for thermal and electric energy.
Resource decoupling . Achieving resource decoupling, which implies reduced consumption of primary resources per unit of economic result, is a pressing challenge for further development of Russia. The study of the nature of economic development of Russian regions shows that most of them develop due to natural resource consumption [25]. To date, Russia’s economy is recognized as one of the most energy-intensive economies in the world [26]. Figure 4 reflects the performance of primary energy consumption per unit of economic output (GDP) in different countries.
There is a noticeable gap in this indicator even between countries with similar climatic conditions. Thus, in Sweden and Norway, which, like Russia, belong to Northern countries, energy consumption per dollar of GDP at purchasing power parity is 1.7 and 2.2 times lower, respectively (according to 2014 data). In [26] it is noted that apart from
Figure 4. Performance of indicator characterizing primary energy consumption efficiency (energy intensity), 1990–2015
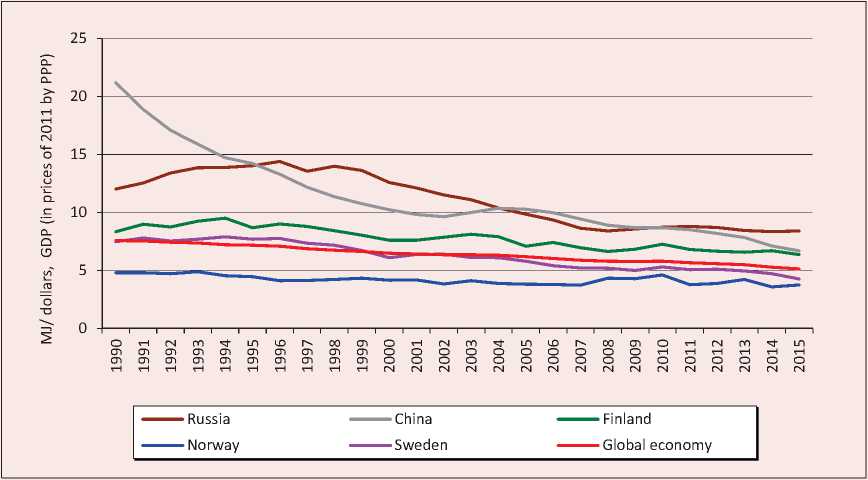
Source: Energy intensity level of primary energy (MJ/$2011 PPP GDP). Available at: (accessed: 26.03.2018).
climatic and geographical conditions, an important factor contributing to high energy intensity is the sectoral structure of economy. Its peculiarity in Russia is the predominance of heavy industries which require a great amount of energy resources.
To assess energy resource consumption efficiency in Russian regions we use “GRP energy intensity” indicator. It is regularly published by the Federal State Statistics Service of Russia. Table 3 presents GRP energy intensity in the regions of cross-border cooperation with China. In most of them energy costs per unit of value added are higher than in Russia as a whole. However, it is noteworthy that the indicator has shortcomings and does not fully reflect the real situation. This is due to the peculiarities of statistical accounting: the amounts of consumed energy resources belongs to one region, while part of GRP created in its territory – to another region due to business identification according to its main location12. Moreover, a marked decrease in energy intensity relative to the level of the previous year was mainly due to GRP growth, which is measured in current prices (i.e., the inflation component is not taken into account). To assess the performance of energy intensity it is more reasonable to use the “Consumption of fuel and energy resources per one employed in economy” indicator. During 2012–2015, its value in Russia did not actually change (13 tons of oil equivalent per one employed in economy)13.
Table 3. GRP energy intensity, kg of oil equivalent/10,000RUB.
Region/country 2014 2015 Change over 2014–2015 Altai Republic 142.74 130.48 -9% Republic of Buryatia 186.36 173.65 -7% Zabaikalsky Krai 195.80 177.90 -9% Irkutsk Oblast 338.50 252.41 -25% Primorsky Krai 167.40 129.11 -23% Khabarovsk Krai 133.61 126.01 -6% Amur Oblast 188.43 166.30 -12% Jewish Autonomous Oblast 167.16 144.13 -14% Russia* 150.31 136.11 -9% * The indicator represents the ratio of consumption of fuel and energy resources by Russia’s constituent entities to their GRP. Compiled from: Technological development of economic sectors. GDP (GRP) energy intensity. Available at: connect/rosstat_main/rosstat/ru/statistics/economydevelopment/# (accessed: 26.03.2018).
Due to lack of information characterizing consumption of energy resources by economic activity it is difficult to assess energy intensity of individual industrial sectors in regions. In this regard, we only analyzed resource efficiency for electric power industry of one of the border regions – Zabaikalsky Krai.
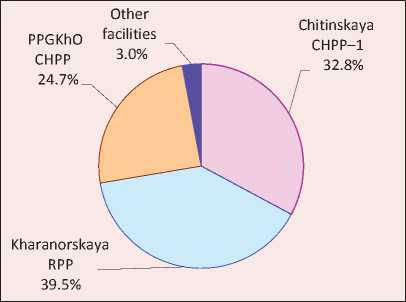
The largest electric and thermal energy generation facilities in the border region are: Haranorskaya regional power station, Chitinskaya CHPP–1 and OAO “Priargun-skoe proizvodstvennoe gorno-khimicheskoe ob”edinenie” (PPGKhO) CHPP (Fig. 5). A small share of production (2.4%) accounts for other generation facilities, which include Chitinskaya CHPP–2, Sherlovogorskaya, Priargunskaya and Pervomayskaya CHPP. During 2009–2017, the structure of power generation in the region changed significantly. The share of Haranorskaya regional power station in total generation increased significantly; in 2017, it provided almost half of the total volume of generated electrical energy.
а) 2009
Figure 5. Structure of electricity production, TRANS-Baikal territory
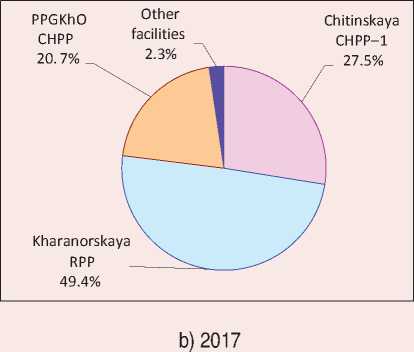
Source: data of PAO TGK-14, AO Inter RAO – Elektrogeneratsiya, and branch of AO “SO EES Zabaikal’skoe RDU.
Figure 6. Performance of electric and thermal energy production energy intensity indicators by generation facilities in Zabaikalsky Krai, 2009–2017
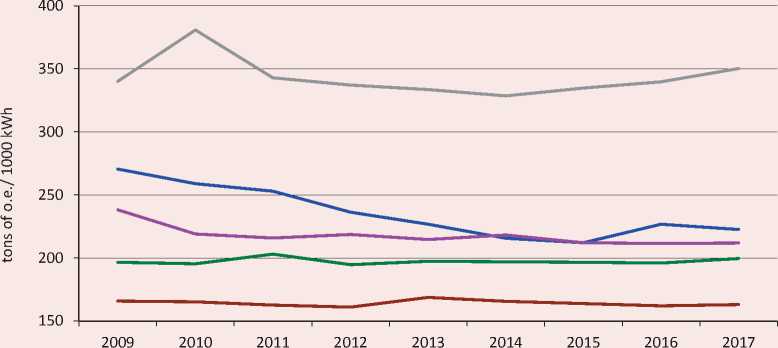
-----Chitinskaya CHPP-1 -----Chitinskaya CHPP-2 -----Sherlovogorskaya CHPP
-----Priargunskaya CHPP -----HaranorskayaRPP
Calculated according to: data of PAO TGK-14, AO Inter RAO – Elektrogeneratsiya and branch of AO “SO EES Zabaikal’skoe RDU.
All reviewed power generation facilities in Zabaikalsky Krai use coal from local brown coal deposits and fuel oil as fuel, whose share in fuel balance is insignificant14. Energy intensity is calculated as the ratio of volume of energy resources consumed in production process (coal, fuel oil and electricity in terms of oil equivalent) to electricity and heat produced (recalculated as kWh). The use of natural values as an economic result makes it possible to exclude the influence of inflation factor on the performance of the indicator under review.
Power engineering enterprises in Zabai-kalsky Krai are characterized by different degrees of energy consumption per volume of final products ( Fig. 6 ). In 2017, the indicator value varied in the range from
163 kg (Chitinskaya CHPP–2) to 350 kg (Kharanorskaya regional power station) of oil equivalent per 1000 kWh of thermal and electric energy generated.
In [23] it is noted that the use of primary energy resources in power plants with cogeneration technology, i.e. joint production of electricity and heat, is the most effective. This is confirmed by the results of calculations, according to which the largest power plant in the region – Kharanorskaya regional power pant – has the highest indicator value; the plant produces mainly electrical energy. For the considered time interval, a positive change was observed in two generation facilities: Chitinskaya CHPP–1 and Priargunskaya CHPP. Energy intensity of production at these plants decreased by 18 and 11%, respectively.
Conclusion
To sum up, we conclude that in all covered regions of cross-border cooperation with China decoupling is manifested in terms of contaminated wastewater discharge. However, such a relatively good situation may be due to insufficient quality of monitoring of wastewater discharge and the fact that the consequences of violating environmental legislation are not properly reflected in statistical reporting, rather than a real decrease in the level of this type of environmental load.
When it comes to pollutant emissions from stationary sources, decoupling, i.e. a mismatch of trends in economic development and air pollution, was detected in most cases. However, in some regions this effect is not clear, which is most evident in the analysis of the situation in the context of the most common pollutants and the main economic activities. At the same time, rapid development of border relations with China in recent years has not significantly changed the situation in Eastern regions. Paper [22] notes that the advantages of the border position, which in the East of the country were associated with great expectations due to the proximity of the fast-growing economy of
China, did not become a significant impetus to socio-economic development and welfare, an important component of which is a favorable environment.
The studies presented in this article are aimed at solving the scientific problem of assessing the eco-economic development of Eastern regions-participants of crossborder cooperation. This determines their contribution to the development of theoretical and applied knowledge. The analysis results can be used in the development of management decisions in environmental and economic interactions, as well as in the preparation of strategic planning documents. A comparison of economic development and environmental pollution rates in the context of main economic activities may be useful when considering investment projects planned in the region, including initiatives involving foreign investment. In order to achieve decoupling for certain types of negative environmental impact, a set of measures is required in order to improve the environment protecting mechanism (increasing payment rates for negative impact, restoring their target use, etc.).
References Decoupling in environmental and economic development of regions-participants of cross-border cooperation
- Navstrechu «zelenoi ekonomike»: puti k ustoichivomu razvitiyu i iskoreneniyu bednosti . UNEP, 2011. 45 p. Available at: http://old.ecocongress.info/5_congr/docs/doklad.pdf (accessed: 26.03.2016).
- Shevchuk A.V. "Zelenaya" ekonomika: perezagruzka . Moscow: Zimorodok, 2017. 448 p.
- Bobylev S.N., Kudryavtseva O.V., Yakovleva Ye.Yu. Regional priorities of green economy. Ekonomika regiona=Economy of Region, 2015, no. 2 (42), pp. 148-159. DOI: 0.17059/2015-2-12
- Glazyrina I.P., Faleichik L.M., Yakovleva K.A. Socioeconomic effectiveness and «green» growth of regional forest use. Geography and Natural Resources, 2015, vol. 36, no. 4, pp. 327-334 DOI: 10.1134/S1875372815040022
- Shang Y., Si Y., Zeng G. Black or green? Economic growth patterns in China under Low Carbon Economy Targets. Journal of Resources and Ecology, 2015, vol. 6, no. 5, pp. 310-317 DOI: 10.5814/j.issn.1674-764x.2015.05.004
- Victor P. The Kenneth E. Boulding Memorial Award 2014: Ecological economics: A personal journey. Ecological Economics, 2015, vol. 109, pp. 93-100. doi.org/10.1016/j.ecolecon.2014.11.009
- Bobylev S.N., Goryacheva A.A., Nemova V.I. Project management in green economy. Gosudarstvennoe upravlenie: elektronnyi Vestnik=Public Administration E-Journal, 2017, no. 64, pp. 34-44..
- Pyzhev A.I., Pyzheva Yu.I. Evaluation of regional ecological and socio-economic well-being of the Krasnoyarsk Krai: a new approach. Regional’naya ekonomika: teoriya i praktika=Regional Economics: Theory and Practice, 2015, no. 34 (409), pp. 30-40..
- Bobylev S.N., Zakharov V.M. Green economy and modernization. Eco-economic framework for sustainable development. Na puti k ustoichivomu razvitiyu Rossii: byulleten’=Towards Sustainable Development in Russia, 2012, no. 60. 89 p..
- Decoupling natural resource use and environmental impacts from economic growth. UNEP, 2011. Available at: http://www.gci.org.uk/Documents/Decoupling_Report_English.pdf
- Guevaraab Z., Domingos T. Three-level decoupling of energy use in Portugal 1995-2010. Energy Policy, 2017, vol. 108, pp. 134-142. doi.org/10.1016/j.enpol.2017.05.050
- Nagvi A., Zwickl K. Fifty shades of green: Revisiting decoupling by economic sector and air pollutants. Ecological Economics, 2017, vol. 133, pp. 111-126. doi.org/10.1016/j.ecolecon.2016.09.017
- Akulov A.O. Decoupling effect in the industrial region (the case of the Kemerovo Oblast). Ekonomicheskie i sotsial’nye peremeny: fakty, tendentsii, prognoz=Economic and Social Changes: Facts, Trends, Forecast, 2013, no. 4 (28, pp. 177-185..
- Kirillov S.N., Pakina A.A., Tul’skaya N.I. Evaluation of development sustainability at the regional level: the case of Tatarstan Republic. Vestnik Volgogradskogo gosudarstvennogo universiteta. Seriya 3: Ekonomika. Ekologiya=Science Journal of Volgograd State University. Global Economic System, 2017, no. 4 (41), pp. 127-137. DOI: 10.15688/jvolsu3.2017.4.14
- Shkiperova G.T. Analysis and modeling of relationship between economic growth and environmental quality (the case of the Republic of Karelia). Ekonomicheskii analiz: teoriya i praktika=Economic Analysis: Theory and Practice, 2014, no. 43 (394), pp. 41-49..
- Yashalova N.N. Analysis of the decoupling effect in ecological and economic activity of a region. Regional’naya ekonomika: teoriya i praktika=Regional Economics: Theory and Practice, 2014, no. 39, pp. 54-61..
- Glazyrina I.P., Zabelina I.A., Klevakina E.A. Environmental component of economic development: transboundary regions of the Russian Federation and China. EKO=ECO Journal, 2014, no. 6 (480), pp. 5-24..
- Glazyrina I.P., Zabelina I.A. The prospects of green growth in Eastern Russia and the new Silk Road. EKO=ECO Journal, 2016, no. 7 (505), pp. 5-20..
- De Haan M. Accounting for goods and bads. Voorburg: Statistics Netherlands, 2004. 216 p.
- Li X, Chalvatzis K.J., Pappas D. China’s electricity emission intensity in 2020 -an analysis at provincial level. Energy Procedia, 2017, vol. 142, pp. 2779-2785. doi.org/10.1016/j.egypro.2017.12.421
- Glazyrina I.P., I.M. Potravnyi (Eds.). Mazneva M.A. Eco-intensity. In: Ekologicheskie indikatory kachestva rosta regional’noi ekonomiki . Moscow: NIA-Priroda, 2006. Chapter 5, pp. 126-147.
- Glazyrina I.P, Zabelina I.A. Spatial heterogeneity of Russia in the light of the concept of a green economy: the social context. Geography and Natural Resources, 2018, vol. 39, no. 2, pp. 14-22. DOI: 10.1134/S1875372818020026
- Gulbrandsen T.Kh., Padalko L.P., Chervinskii V.L. Energoeffektivnost’ i energeticheskii menedzhment . Minsk: BGATU, 2010. 240 p.
- Antonova N.E., Lomakina N.V. Natural resource-based industries of the Far East: new drivers of development. Ekonomicheskie i sotsial’nye peremeny: fakty, tendentsii, prognoz=Economic and Social Changes: Facts, Trends, Forecast, 2018, vol. 11, no. 1, pp. 43-56. DOI: 10.15838/esc/2018.1.55.3
- Ryumina E.V., Anikina A.M. Analysis of the impact of the natural resource factor on the level of economic development in Russian regions. Problemy prognozirovaniya=Forecasting Issues, 2007, no. 5, pp. 106-125..
- Bobylev S.N. et al. Energoeffektivnost’ i ustoichivoe razvitie . Moscow: Institut ustoichivogo razvitiya, 2010. 148 p.
