Decrypting the Effects of Starvation and Excess of Nitrogen and Phosphorus on Nostoc calcicola

Author: Prabha Tiwari, Prabhat Kumar Sharma
Journal: Журнал стресс-физиологии и биохимии @jspb
Article in issue: 2 т.17, 2021.
Free access
The physiological and biochemical behaviour of marine cyanobacterium (Nostoc calcicola) grown under starved and double the strength of nitrogen (N) and phosphorus (P) was studied. Culture grew in an Artificial Sea Nutrient III culture medium with five different concentrations of N and P, i.e., double the concentration of N (DN) or P (DP), starvation of nitrogen, (-)N and phosphorus, (-)P and combine deprivation of both nitrogen and phosphorus, (-)NP along with control. Growth rate and photosynthetic efficiency decreased under P starved condition alone, and combined starvation of N and P. Oxidative, and physiological stress was evidenced by increased ROS, MDA, and proline content level under starved conditions. Elevated activity of Ascorbic acid, SOD, CAT, and APX were also detected. In contrast, an increase in the growth rate and Fv/Fm ratio, along with low oxidative, osmotic stress, and antioxidant activity, was observed under double the strength of nitrogen and phosphorous. Our work demonstrated that P starvation alone and combine starvation of N and P affected the growth of N. calcicola, maybe due to oxidative damage (increased lipid peroxidation and carbonyl content). In contrast to nutrient-starved conditions, the growth rate of N. calcicola enhanced under DN and DP, followed by (-) N.
Antioxidant, Fv/Fm, lipid peroxidation, Proline, ROS
Short address: https://sciup.org/143173884
IDR: 143173884
Text of the scientific article Decrypting the Effects of Starvation and Excess of Nitrogen and Phosphorus on Nostoc calcicola
Abbreviations: DN, Double nitrogen; DP, Double phosphorus; (-)N, nitrogen starvation; (-)P, Phosphorus starvation; (-NP) Combine starvation of nitrogen and phosphorus; Fv/ Fm, photosynthetic efficiency of PS II, Fv- variable fluorescence, Fm- maximal fluorescence, ROS, Reactive oxygen species; MDA, Malondialdehyde; SOD, Superoxide dismutase; CAT, Catalase; APX, Ascorbate peroxidase
Nitrogen (N) and phosphorus (P) are the vital elements required for the growth and development of photosynthetic organisms. Nitrogen is available in nitrate or ammonium ion; among the two forms, ammonium assimilation is energy effective than nitrate assimilation (Ruan and Giordano, 2017). However, most microorganisms find ammonium toxic for their growth and development (Drath et al. , 2008; Markou et al. , 2014), whereas phosphate is biologically available as orthophosphates in the aquatic environment (Shan et al. , 1994). Both elements are considered as an essential factor in determining diazotrophic cyanobacteria's spatial and temporal distribution (Niemi, 1979).
N and P play a essential role in synthesizing primary and secondary amino acids, proteins, nucleic acids, coenzymes, chlorophyll, and other photosynthetic pigments. Thus, indispensable in regulating the productivity and influencing species composition to sustain in any given habitats (Raven et al. , 1992). Cyanobacteria and Diatoms attain their optimum growth at an N:P ratio of 2-5:1 (Bulgakov and Levich, 1990). Whereas for other photosynthetic organisms, N and P comprise about 7-20% (7.0E+15:1.0E+17-1:5) and 0.2% (1:500), respectively, dry weight of their cells (Hu, 2004; Schachtman et al. , 1998).
N and P deficiency cause a reduction in the growth and photosynthesis of cyanobacteria. For instance, Liefer et al. (2018) reported a decline in the growth rate of diatoms and prasinophytes under N deficient conditions. In a similar type of work, Collen et al. , (2004), reported a decrease in the growth rate of Gracilaria tenuistipitata under N deficiency. In another study conducted by Degerholm et al. , (2006) and u et al. , (2010) showed a decline in the growth rate in Nodularia, Aphanizomenon, and Gracilaria lemaniformis , (Rhodophyta) under low phosphorus and low CO 2 condition. Collen et al. , (2004) and u et al. , (2010) study further reported a reduction in the Fv/Fm ratio and photosynthetic rate under N and P limited condition.
Macroalgae, microalgae, and diatoms, when grown under N and P limited condition, display ROS generation in the form of hydrogen peroxide and hydroxyl radicle. (Lin et al., (2017; Hamid and Sibi, 2018). These ROS leads to oxidative damage to various biological molecules such as oxidation of protein and nucleic acid and peroxidation of membrane lipids, causing high growth costs. To protect the organisms, certain metabolites such as non-enzymatic antioxidants and enzymatic antioxidants are produced to mitigate the organism's oxidative damage (Hamid and Sibi, 2018).
In contrast with deficiency, high N and P concentrations in the water bodies known to stimulate growth and photosynthesis of cyanobacteria. Elevated N and low P concentration (New Zealand rivers) and high P and Low N (Spain river) resulted in excess growth of different species of cyanobacteria (Wood and Young 2011, 2012; Sabater et al. , 2003; Vilalta et al. , 2003; Zou and Gao 2014). Felisberto et al. , (2011) study under four nutrient treatments (N; P; N plus P and control), reported that the growth densities of green algae and cyanobacteria prevailed under P and N plus P treatment. They also found that N and P's addition either individually or in combination, altered the algal growth densities. Vezie et al. , (2002) reported an increase in the growth of toxic Microcystis strain under a high concentration of N & P.
Further, u et al. , 2010, displayed an increase in the growth and photosynthesis of Gracilaria lemaniformis under high P level and not recorded under low P condition and elevated CO 2 concentration in the medium.
The excess accumulation of N and P in aquatic ecosystems has also become the most extensive and challenging environmental problems nowadays (Dar et al. , 2011). Cyanobacteria can accumulate a substantial amount of lipids under nutrient-deficient state, especially under N limited condition, the most widely used strategy to induce lipid production. Whereas on the other hand, cyanobacteria are also well known for flourishing under high N & P conditions. Their cultures are being employed extensively for wastewater treatments over the last few decades (Chevalier et al. , 2000). Hence, excess N & P contained wastewater used as a culture medium for growth, making it useful for biofuel production while concurrently reducing the nutrient load from the water bodies (Sood et al. , 2015).
MATERIALS AND METHODS
Culture of Nostoc calcicola
The culture of N. calcicola Brébisson ex Bornet & Flahault procured from National Facility for Marine Cyanobacteria (NFMC), Bharathidasan University, Tamil Nadu, India. The cultures were grown in an Artificial sea nutrient (ASN) III sterile culture medium, as described by Rippka et al. , (1979) at 30°C under fluorescent white light (80 µmol photon m- 2 s-1) with a 16:8 h photoperiod and with 150 rpm. The growth of culture was monitored by measuring optical density (O.D) at 680 nm (Wang et al. , 2012) with a spectrophotometer (Shimadzu, UV-2450). The cells in the exponential growth phase (25th day) were harvested, lyophilized, and used for further experiments.
Nutrient treatment
Cyanobacterium culture was grown in the ASN III sterile medium containing a standard concentration of nitrogen (N) & phosphorus (P) according to Rippka et al. , (1979), double, triple, and four times the strength of nitrogen (N) and phosphorus (N) separately (supplied in the form of sodium nitrate (NaNO 3 ) or dipotassium phosphate (K 2 HPO 4 ) respectively as well as under (-)P or (-)N starvation individually and in combination (-)NP. Along with the Nitrate study, a preliminary study was conducted with ammonium chloride on the growth of N. calcicola . Sodium nitrate of ASN III was substituted with ammonium chloride (single and double the strength of ammonium).
Measurement of photosynthetic efficiency of PSII (Fv/Fm)
Photosynthetic efficiency of PSII was measured using chlorophyll fluorometer (PAM, Walz, Germany) following Sharma et al., (1998). Before measurement, N. calcicola was dark-adapted for 10 min. To measure initial fluorescence (Fo), the dark-adapted 1 ml cultures were exposed to a modulating light of intensity 4 μmol m-2 s-1 followed by exposure to a saturating pulse of the white light of 4,000 μmol m-2 s-1 to obtained the maximum fluorescence (Fm). Variable fluorescence (Fv), calculated by subtracting the Fo from Fm (Fv = Fm – Fo), and the Fv/Fm ratio was determined.
Determination of Hydrogen peroxide (H2O2)
The total H 2 O 2 content was estimated following Sagisaka et al. , (1979). The experiments were carried out with 10 mg lyophilized cyanobacterium tissue, homogenized in 5ml of 5% trichloroacetic acid (TCA), and centrifuged at 4°C for 10 min at 7000 rpm. Supernatant added with 50% TCA (40 µl), 2.5 M potassium thiocyanate (20 µl ), and 10 mM ferrous ammonium sulfate (40 µl), and the reaction mixture was incubated for 30 s at RT. Absorbance was recorded at 480 nm using a UV-visible spectrophotometer (UV-2450, Shimadzu). H 2 O 2 concentration was determined using a calibration curve with a 10 mM stock solution and expressed as µmol g-1.
Determination of Hydroxyl radical (OH·)
OH · ( hydroxyl radical) content was determined following the protocol given by Liu et al. , (2009). OH · radical reduces the deoxyribose, which in turn forms thiobarbituric acid reactive substances (TBA-RS), detected spectrophotometrically. Lyophilized 10 mg tissue was homogenized in 2 ml of 5% TCA and centrifuged at 4°C for 10 min at 1000 rpm. The supernatant was added with 500 µl of 50 mM NaPO 4 buffer (pH 7), and 1 ml of 25 mM NaPO 4 buffer (pH 7) containing 2.5 mM, 2-deoxyribose and dark incubation was done for 1 h at 35°C. Soon after incubation, the reaction mixture was added with 1% TBA and glacial acetic acid (GAA), 1 ml each. Further, the reaction mixture was incubated at 95°C for 10 min in a dry bath, and immediately test tubes were cooled for 2 min on ice. Absorbance was recorded at 532 nm using a UV-Visible spectrophotometer (UV-2450, Shimadzu). An increase in the absorbance is related to the rise in OH · level. The concentration of OH · was expressed as Absorbance units (Absorbance x 1000)/1000.
Determination of lipid peroxidation
Malondialdehyde (MDA), is routinely used as a criterion to measure lipid peroxidation, determined by following Sankhalkar and Sharma (2002) protocol, where the level of lipid peroxidation products in the sample examined as 2-thiobarbituric acid-reactive materials (aldehydes, mainly MDA and endoperoxides). Lyophilized 10 mg tissue was ground in 4 ml of 1% TCA and homogenate was centrifuged at 2000 rpm for 5 min. 1ml supernatant was added with 1.5 ml incubation buffer (50 mM Tris HCL, 175 mM NaCl), pH 8, 1.5 ml of 0.5% thiobarbituric acid (TBA) prepared in 20% TCA. Followed by incubation at 95°C for 30 min in a dry bath, cooled at RT and MDA content was determined by measuring absorbance at 600 nm and 532 nm using a UV-Visual spectrophotometer (UV-2450, Shimadzu). By subtracting absorbance measured at 600 nm from absorbance measured at 532 nm non-specific turbidity was corrected. MDA content is expressed as µmol g-1 of tissue.
Protein carbonyl (R = O) estimation
Protein oxidation estimated following Vega-López et al. , (2013), lyophilized tissue (50 mg) was ground in 2 ml of 30% TCA and centrifuged, with a slight modification to the original protocol, at 7,000 rpm for 5 min and the supernatant was discarded. To the pellet, 0.5 ml of 2,4-Dinitrophenylhydrazine (DNPH) (10 mM in 2 N HCl) was added, followed by vortex for 30 s and dark-adapted for 1 h, vortexing after every 10 min. Three washing performed using ethanol: ethyl acetate (1:1 v/v) to eliminate excess DNPH and centrifuge between each wash at 5000 rpm. The precipitate was dissolved in 1ml of urea (6 M in 20 mM potassium phosphate at pH 2.5) and further incubated for 1 h at 37°C after mixing in a vortex. The absorbance was evaluated at 366 nm using a UV-Visible spectrophotometer (UV-2450, Shimadzu).
The protein carbonyl content was calculated with the molar extinction coefficient of 0.022 µM-1cm-1 and reported in nmol ml-1.
Measurement of proline content
Proline concentration estimated following the method of Bates et al., (1973). Lyophilized tissue (10 mg) was homogenized with 5 ml of 3% sulfosalicylic acid, and centrifuged at 2,500 rpm for 5 min. The supernatant was added with glacial acetic acid and acid ninhydrin reagent (1 ml each) followed by incubation at 95°C for 1 h. After the test tubes were cooled, 10 ml of toluene was added to each test tubes and shook vigorously. The reaction mixture was allowed to precipitate, and absorbance was read at 520 nm using a UV-Visible spectrophotometer (UV-2450, Shimadzu).
For quantification, L-Proline was used as a standard, and the standard graph plotted against concentration.
Ascorbic acid assay
Estimation of Ascorbate (ASA) was carried out following Kampfenkel et al. , (1995). Lyophilized tissue of 10 mg was homogenized with 2 ml of extraction buffer (0.1 M HCl + 0.1 mM EDTA). Tissue extract was centrifuged at 12,000 rpm for 2 min, and the supernatant was used for the ascorbate assay. The reaction mixture contained, 100 µl of sample, 100 µl of 0.4 M phosphate buffer (pH 7.4), 400 µl of color reagent (containing two solutions [A] TCA (4.6%), H 3 PO 4 (15.3%), FeCl 3 (0.6%) and [B] 2, 2 dipyridyl (4%) in 70 % ethanol, in the ratio of 2.75:1) and 50 µl of 0.5% N-ethylmaleimide. The mixture incubated at 42°C for 45 min, and absorbance read at 520 nm UV-Visible spectrophotometer (UV-2450, Shimadzu. Ascorbic acid is used as a standard.
Superoxide dismutase (SOD)
Superoxide dismutase activity was measured following Dhindsa et al. , (1981). Lyophilized (10 mg) tissue was ground in 2 ml 0.5 M phosphate buffer (pH 7.5) and centrifuged at 4°C for 10 min, and the supernatant was used for the SOD activity assay. The entire enzyme extract preparation was carried out at 4°C. The SOD activity is determined by its ability to inhibit the photochemical reduction of Nitro Blue Tetrazolium (NBT). The assay mixture contained reaction buffer of 1.5 ml (0.5 M phosphate buffer, pH 7.5 and 0.1 M phosphate buffer, pH 7.8), 200 µl of 200 mM methionine, 100 µl of 1M Na 2 CO 3 , 100 µl of 2.25 mM NBT, 100 µl of 3mM EDTA, 100 µl of 60 µM Riboflavin and 100 µl of enzyme extract. Test tubes were shaken and incubated for 15 min under white fluorescent light (11 W) at RT. After incubation, the absorbance of the reaction mixture was read at 560 nm. The reaction mixtures, which were non-radiated, did not develop color and were considered as control. Activity of SOD was expressed as Unit mg-1 of protein 0.1 ml-1 of crude enzyme.
Catalase activity (CAT)
CAT was performed according to the method of
Aebi, (1984). Lyophilized tissue of 20 mg was extracted in 2 ml lysis buffer (0.1 M potassium phosphate buffer pH 7.8 and 1% PVP and 1 mM EDTA) and centrifuge at 8,000 rpm 4°C for 30 min, and the supernatant was used as crude enzyme extract for catalase assay. The reaction mixture had 1 ml of 50 mM sodium phosphate buffer (pH 7), 200 µl of H 2 O 2, and 200 µl of enzyme extract. The absorbance was measured at 240 nm using a UV-Visible spectrophotometer (UV2450, Shimadzu, Singapore).
Ascorbate peroxidase (APX)
AP activity is estimated according to the method of Nakano and Asada (1981). 20 mg of lyophilized tissue was ground in 2 ml of lysis buffer containing 0.1 M potassium phosphate buffer, pH 7.8, 1% PVP, and 1 mM EDTA. The homogenate was centrifuged at 4 °C at 8,000 rpm for 20 min. The reaction mixture contained 1 ml of reaction buffer (50mM sodium phosphate buffer, pH 7.2); 100 µl of 0.1 mM H 2 O 2 , 100 µl of 0.5 mM ascorbate, 100 µl of 0.5 mM EDTA, and 100 µl of crude enzyme extract. The reaction mixture was incubated for 30 s before taking the absorbance at 290 nm using a UV-Visible spectrophotometer (UV2450, Shimadzu, Singapore). Estimation of AP activity was done using the average and extinction coefficient of 2.8 mM-1 cm-1 (Ɛ=2.8 mM-1 cm-1).
Statistical analysis
The results were studied statistically using one-way ANOVA. The test was conducted to find out the significant difference ( at a 95% confidence interval ) within different parameters across a different concentration of N and P, followed by Dunnett (twosided) multiple range test using Microsoft excel LSTAT (version 2020.1.3.65245). The data are the mean value ± standard deviation in three replicates ( n =3).
RESULTS
Growth
Photosynthetic efficiency of PS II (Fv/Fm)
The photochemical efficiency of PS II, measured in the form of the Fv/Fm ratio of N. calcicola grown under different P and N concentrations presented in Fig.2. There was a slight decline in Fv/Fm ratio when N. calcicola was grown in the medium containing DP (5%), no change under DN, and N starvation showed a 7% decline compared to control. However, under P starvation alone and combined N&P deprivation showed a significant decline of 25% and 44% significant respectively in the Fv/Fm ratio (Fig. 2 and Table 1).
Determination of Hydrogen peroxide (H2O2) and Hydroxyl radical (OH·)
N. calcicola grown under nutrient stress showed a significant increment in both hydrogen peroxide and hydroxyl radical content (Fig. 3; Table 1). The increment in H 2 O 2 production was more pronounced (~8 fold compared to the increase in the hydroxyl radical content (~2 fold), respectively, under P starvation and combined starvation of N&P as compared to their control (Fig. 3). Whereas N. calcicola grown under (-)N, DP and DN showed no significant increase in the H 2 O 2 and OH ˑ content than their controls.
Determination of lipid peroxidation and protein oxidation
Data on lipid peroxidation and protein oxidation are presented in Fig. 4; Table 1. Dunnett (two-sided) multiple range tests showed significant enhancement in both lipid peroxidation and protein oxidation in N. calcicola under P starvation alone and combined starvation of N&P; however, induction was more pronounced in protein oxidation (up to 3.7-fold) than in lipid peroxidation (up to 2.6-fold). Whereas N. calcicola grown under N starvation alone, DP and DN showed an insignificant increase in the lipid peroxidation and carbonyl content compared to their controls.
Estimation of proline and ascorbate content
The influence of nutrient stress (DP; DN; (-)N; (-)P to their controls.
SOD, CAT and APX activity
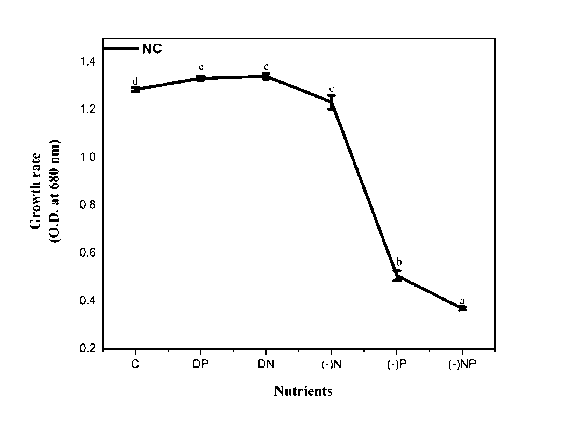
Figure 1. Effect of nutrient stress on the growth rate of N. calcicola . The vertical bars represent the standard deviation (±SD, n = 3). Abbreviations for x-axis treatments: C= control, DP= double phosphorus, DN= double nitrogen, (-)N= nitrogen starvation, (-)P= phosphorus starvation, (-)NP = combine starvation of nitrogen and phosphorus. Treatments with different letters are significantly different from each other values.
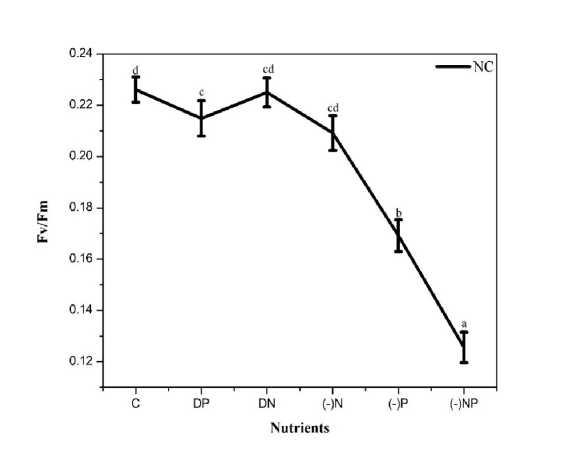
Figure 2. Effect of nutrient stress on photosynthetic efficiency of PS II (Fv/Fm) of N. calcicola . The vertical bars represent the standard deviation (±SD, n = 3). Abbreviations for x-axis treatments are as for figure 1.
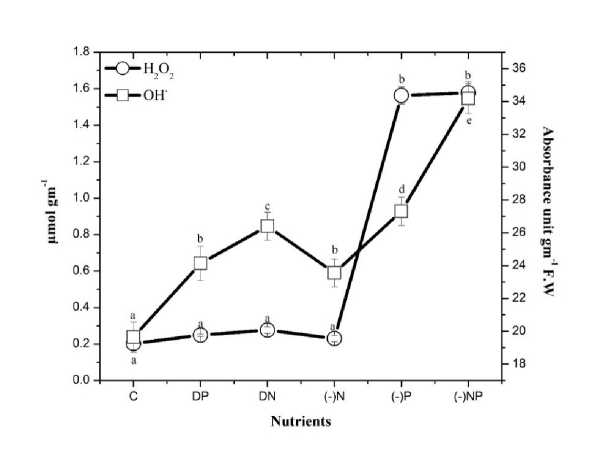
Figure 3. Effect of nutrient stress on hydrogen peroxide and hydroxyl radical content of N. calcicola . The vertical bars represent the standard deviation (±SD, n = 3). Abbreviations for x-axis treatments: Abbreviations for x-axis treatments: C= control, DP= double phosphorus, DN= double nitrogen, (-)N= nitrogen starvation, (-)P= phosphorus starvation, (-)NP = combine starvation of nitrogen and phosphorus. Treatments with different letters are significantly different from each other values.
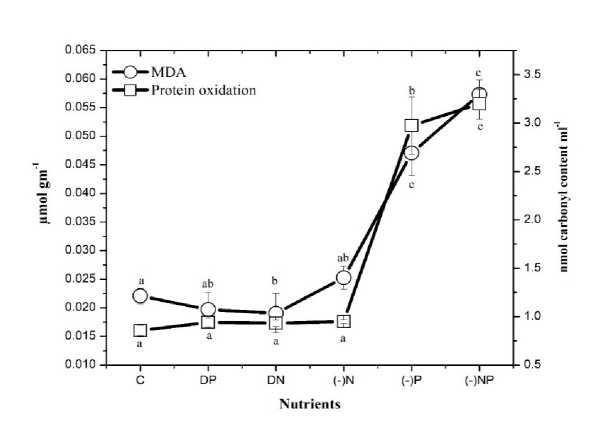
Figure 4. Effect of nutrient stress on lipid peroxidation (MDA) content and protein oxidation of N. calcicola . The vertical bars represent the standard deviation (±SD, n = 3). Abbreviations for x-axis treatments C= control, DP= double phosphorus, DN= double nitrogen, (-)N= nitrogen starvation, (-)P= phosphorus starvation, (-)NP = combine starvation of nitrogen and phosphorus. Treatments with different letters are significantly different from each other values.
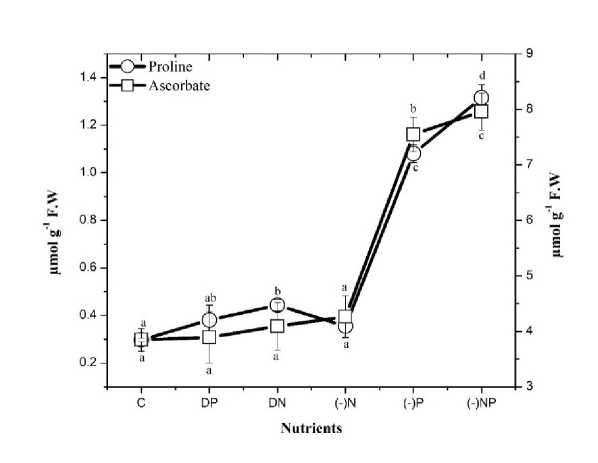
Figure 5. Effect of nutrient stress on the proline and ascorbate content of N. calcicola . The vertical bars represent the standard deviation (±SD, n = 3). Abbreviations for x-axis treatments: C= control, DP= double phosphorus, DN= double nitrogen, (-)N= nitrogen starvation, (-)P= phosphorus starvation, (-)NP = combine starvation of nitrogen and phosphorus. Treatments with different letters are significantly different from each other values.
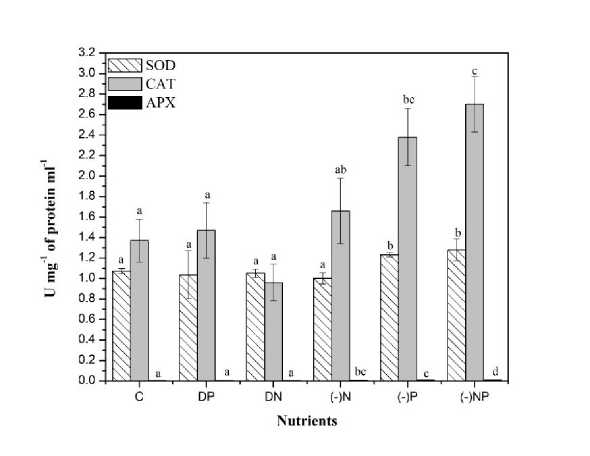
Figure 6. Effect of nutrient stress on the SOD, CAT, and AP activity of N. calcicola . The vertical bars represent the standard deviation (±SD, n = 3). Abbreviations for x-axis treatments: C= control, DP= double phosphorus, DN= double nitrogen, (-)N= nitrogen starvation, (-)P= phosphorus starvation, (-)NP = combine starvation of nitrogen and phosphorus. Treatments with different letters are significantly different from each other values.
Table 1. Growth rate, Photosynthetic efficiency of PS II (Fv/Fm), MDA content, protein oxidation, hydrogen peroxide and hydroxyl radical content of N. calcicola grown under different strength of N and P. The data represent the mean value ± SD (n = 3). Treatments with different letters are significantly different from each other values.
|
Nutrients |
Growth rate (O.D at 680 nm) |
Fv/Fm |
MDA (µmol gm-1) |
Protein oxidation (nmol carbonyl content ml-1) |
H 2 O 2 Content (µmol gm-1) |
OH · Content (Absorbance unit gm-1 F.W) |
|
C |
1.23±0.01d |
0.23±0.0049d |
0.022±0.001a |
0.856±0.055a |
0.203±0.03a |
19.64±0.92a |
|
DP |
1.33±0.01e |
0.21±0.007c |
0.019±0.003ab |
0.941±0.04a |
0.249±0.006a |
24.13±1.03b |
|
DN |
1.34±0.01e |
0.22±0.006cd |
0.019±0.003b |
0.932±0.03a |
0.277±0.018a |
26.40±0.84c |
|
(-)N |
1.23±0.03c |
0.21±0.007cd |
0.025±0.002ab |
0.949±0.02a |
0.231±0.016a |
23.55±0.85b |
|
(-)P |
0.507±0.02b |
0.17±0.006b |
0.047±0.004c |
2.975±0.03b |
1.56±0.046b |
27.31±0.86d |
|
(-)NP |
0.369±0.01a |
0.13±0.006a |
0.057±0.003c |
3.197±0.2c |
1.57±0.059b |
34.17±0.91e |
Table 2. Proline, ascorbate, superoxide dismutase (SOD), catalase (CAT) and ascorbate peroxidase (AP ) activity of N. calcicola grown under different strength of N and P. The data represent the mean value ± SD (n = 3). Treatments with different letters are significantly different from each other values.
|
Nutrients |
Proline (µmol gm-1) |
Ascorbate (µmol gm-1) |
SOD (U mg-1 of protein) |
CAT (U mg-1 protein ml-1) |
APX (U mg-1 protein min-1) |
|
C |
0.297±0.048a |
3.48±0.03a |
1.07±0.02a |
1.37±0.21a |
0.003±8.92558E-4a |
|
DP |
0.38±0.06ab |
3.89±0.46a |
1.03±0.2a |
1.47±0.27a |
0.003±7.63804E-4a |
|
DN |
0.44±0.02b |
4.09±0.42a |
1.05±0.04a |
0.96±0.18a |
0.0035±4.44537E-4ab |
|
(-)N |
0.355±0.05a |
4.26±0.37a |
1±0.05a |
1.66±32ab |
0.006±7.06454E-4bc |
|
(-)P |
1.08±0.03c |
7.55±0.30b |
1.23±0.02b |
2.38±0.28bc |
0.008±0.00116c |
|
(-)NP |
1.31±0.05d |
7.96±0.33c |
1.28±0.10b |
2.70±0.27c |
0.010±6.35994E-4d |
DISCUSSION
The inhibitory effect of P starvation and combined starvation of N Qi et al , 2013). Our results agree with Qi et al , (2013), who also showed a decrease in the Fv/Fm in P. subcordiformis and H. akashiwo when grown under P deficient conditions. N. calcicola is a nitrogen-fixing cyanobacterium, it did not show any pronounced effect when exposed to N starvation. A similar trend prevailed when grown under double the strength of N and P. However, Paerl et al , (2001); Schindler et al , (2008), studies reported an increase in growth of nitrogen-fixing cyanobacteria under excess phosphorus concentration.
In this study, an increase in MDA content and protein carbonyl content under P starvation and combined starvation of N&P indicated an increment in oxidative damage and impairment in membrane integrity and function (Table 1). According to our knowledge, not much work has been reported the effect of nutrient deficiency or excess on MDA in N. calcicola . However, several studies have reported the same on higher plants, e.g., Tewari et al. , (2004) on maize showed an upregulation in lipid peroxidation under N&P deficiency. Our results are similar to Tewari et al. , (2007) on mulberry and Singh et al. , (2018) on wheat, where N and P deficiency oxidized the cell membrane of root and shoot.
The observed increase in the oxidation of lipids and protein in our study is due to the higher production of ROS (H 2 O 2 & OH.) In addition to the ROS, lipid peroxidation also leads to ROO. Radicals resulted in lipid peroxidation, which starts a chain reaction and produces ketones, hydroxyl acids, and aldehydes as reactive products and is responsible for causing further oxidative damage by conversion of amino groups of protein to carbonyl moieties (Perry et al. , 2000). Romero-Puertas et al. , (2002) and Sandalio et al. , (2001) reported an increase in the carbonyl content in pea plant under cadmium stress.
In response to the oxidative damage, photosynthetic organisms possess a well-demarcated antioxidant defense system. Both non-enzymatic and enzymatic antioxidants scavenge the toxic ROS and protect the cyanobacteria from oxidative stress. Free proline content increases as a physiological response to these oxidative stress Sharma and Dietz (2006). Proline affects some cytoplasmic enzymes' stability whose functions and kinetics could be disturbed as consequences of the applied stress factors (Gibbon et al. , 1997). In the present work, proline content increased in P starvation and combined starvation of N&P (Table
-
2 ). It is suspected to be due to a decrease in the activity of the electron transport system (Venekemp, 1989; Sawhney et al. , 1990; Saradhi & Mohanty; 1993), leading to the accumulation of NADH and H+. Proline accumulation (presumably through synthesis from glutamic acid) might be an adaptive mechanism for reducing (a) the level of accumulated NADH and (b) the acidity; (2NADH+2 H+) (Venekemp et al. , 1987). Our results showed conformity with Sarker and Karmokar (2011) who reported proline accumulation in P deficient Lentil ( Lens culinaris Medik.); Ismail, (2005) in carrot and radish; Guo et al., (2012) in rice seedlings; Yang and Chen, (2001) in Mungbean under Al toxicity and P deficiency.
A non-enzymatic antioxidant such as Ascorbate (AsA) also plays an imperative role in reducing ROS directly and indirectly (Noctor & Foyer, 1998). The increased level of Ascorbate in N. calcicola under nutrient stress conditions (P starvation alone and combine deprivation of N&P) may be due to its participation in reducing H 2 O 2 to water (Table 2). The increase in ascorbate level correlated with increased AP activity observed in our result.
CONCLUSION
The inhibitory effect of P starvation and combined starvation of N&P on the growth and photosynthetic efficiency of PS II (Fv/Fm) in N. calcicola, highly emphasized through the present study (Table 1). The effect was mainly due to P starvation rather than N starvation, and algae grown under (–)N medium did not significantly affect the growth. Phosphorous is one of the vital elements of biomolecules, such as sugar phosphatase, nucleic acids, and phospholipids. It is expected to play a vital role in the growth and photosynthetic efficiency of cyanobacteria. Besides, P also participates in carbon metabolism, affecting various metabolic processes attributed to reduced growth of cyanobacteria under P-starvation. Further, P is also an essential component of Adenosine triphosphate (ATP).
ACKNOWLEDGEMENT
This research work was part of Ph.D-program, conducted at the Department of Botany, Goa University, India. We thank the Goa University and the University Grant Commission- Special Assistant Program (UGC-SAP) for funding this work.
CONFLICTS OF INTEREST
All authors have declared that they do not have any conflict of interest for publishing this research.
References Decrypting the Effects of Starvation and Excess of Nitrogen and Phosphorus on Nostoc calcicola
- Aebi, H. (1984) Catalase in vitro. In Methods in enzymology. 105, 121-126, Academic Press.
- Alves, S., Torres V., Fernandes, S., Marques dos Santos, A., and de Souza, S. (2016) Soluble fractions and kinetics parameters of nitrate and ammonium uptake in sunflower (“Neon” Hybrid). Rev. CiÊncia Agron. 47, 13–21.
- Bates, L. S., Waldren, R. P., & Teare, I. D. (1973) Rapid determination of free proline for water-stress studies. Plant soil, 39(1), 205-207.
- Belisle, B.S; Steffen, M.M; Pound, H.L; Watson, S.B; Debruyn, J.M; Bourbonniere, R.A; Boyer, G.L; Wilhelm S.W. (2016) Urea in lake Erie: Organic nutrient sources as potential important drivers of phytoplankton biomass. Journal of Great Lakes Residue, 42, 599-607.
- Billi, D., & Caiola, M. G. (1996) Effects of nitrogen limitation and starvation on Chroococcidiopsis sp. (Chroococcales). New Phytol, 133(4), 563-571.
- Bulgakov, G., & Levich, P. (1999) The nitrogen: phosphorus ratio as a factor regulating phytoplankton community structure. Archiv für hydrobiologie, 3-22.
- Chevalier, P., Proulx, D., Lessard, P., Vincent, W. F., & De la Noüe, J. (2000) Nitrogen and phosphorus removal by high latitude mat-forming cyanobacteria for potential use in tertiary wastewater treatment. J Appl Phycol, 12(2), 105-112.
- Chokshi, K., Pancha, I., Ghosh, A., & Mishra, S. (2017) Nitrogen starvation-induced cellular crosstalk of ROS-scavenging antioxidants and phytohormone enhanced the biofuel potential of green microalga Acutodesmus dimorphus. Biotechnology for biofuels. 10(1), 60.
- Collén, N., Camitz, A., Hancock, D., Viola, R., & Pedersén, M. (2004) Effect of nutrient deprivation and resupply on metabolites and enzymes related to carbon allocation in Gracilaria tenuistipitata (rhodophyta). Journal of phycology, 40(2), 305-314.
- Costa, V., Cozza, L., Oliveira, L., and Magagnin, G. (2001) Different nitrogen sources and growth responses of Spirulina platensis in microenvironments. World J. Microbiol. Biotechnol. 17, 439–442.
- Dar, S. H., Kumawat, D. M., Singh, N., & Wani, K. A. (2011) Sewage Treatment Potential of Water Hyacinth (Eichhornia crassipes). Int. Res. J. Environ. Sci, 5(4), 377.
- Degerholm, J., Gundersen, K., Bergman, B and Soderback, E. (2006). Phosphorus-limited growth dynamics in twoBaltic Sea cyanobacteria, Nodularia sp. And Aphanizomenon sp. FEMS Microbiol Ecol, 58(3):323-32.
- Dhindsa, R. S., Plumb-Dhindsa, P., & Thorpe, T. A. (1981) Leaf senescence: correlated with increased levels of membrane permeability and lipid peroxidation, and decreased levels of superoxide dismutase and catalase. J. Exp. Bot, 32(1), 93-101.
- Drath, M., Kloft, N., Batschauer, A., Marin, K., Novak, J., and Forchhammer, K. (2008) Ammonia triggers photodamage of photosystem II in the cyanobacterium Synechocystis sp. strain PCC 6803. Plant Physiol. 147, 206–215.
- Felisberto, A., Leandrini, A., & Rodrigues, L. (2011) Effects of nutrients enrichment on algal communities: an experimental in mesocosms approach. Acta Limnologica Brasiliensia, 23(2), 128-137.
- Fernandez, E., and Galvan, A. (2007) Inorganic nitrogen assimilation in Chlamydomonas. J. Exp. Bot. 58, 2279–2287.
- Fitzgerald GP and Nelson C (1966) Extractive and enzymatic analysis for limiting or surplus phosphorus in algae. J Appl Phycol, 2, 32-37.
- Gibbon, C. B., Haiyun, R. E. N., & Staiger, J. C. (1997). Characterization of maize (Zea mays) pollen profilin function in vitro and in live cells. Biochem. J., 327(3), 909-915.
- Gill, S and Tuteja N. (2010) Reactive oxygen species and antioxidant machinery in abiotic stress tolerance in crop plants. Plant Physiol Biochem. 48 (12), 909–30.
- Gulzar, N., Mir, M; & Hamid, S. (2019) Effect of Nitrogen and Phosphorus on the Growth and Redox Homeostasis of Salt-stressed Mustard Plants. Asian J. Plant Sci., 18 (2), 52-59.
- Guo, T. R., Yao, P. C., Zhang, Z. D., Wang, J. J., & Mei, W. (2012) Involvement of antioxidative defense system in rice seedlings exposed to aluminum oxicity and phosphorus deficiency. Rice Sci, 19(3), 207-212.
- Hamid, S., & Sibi, G. (2018) Antioxidant System Response in Green Microalga Chlorococcopsis minuta Against Nutrient Stress in Growth Media. Asian J. Biol. Sci, 11, 210-216.
- Hammond, J. P., & White, P. J. (2008) Sucrose transport in the phloem: integrating root responses to phosphorus starvation. J. Exp. Bot, 59(1), 93-109.
- Hu, Q. (2004) Environmental Effects on Cell Composition. In Handbook of Microalgal Culture: Biotechnology and Applied Phycology; Richmond, A., Ed.; Blackwell: Oxford, U.K., 83–93.
- Ismail M. (2005) Aluminum-phosphorus interactions on growth and some physiological traits of carrot and radish plants. Acta Agron Hung, 53: 293−301.
- Kampfenkel, K., Vanmontagu, M., & Inze, D. (1995) Extraction and determination of ascorbate and dehydroascorbate from plant tissue. Anal. Biochem., 225(1), 165-167.
- Kumar Saha, S., Uma, L., & Subramanian, G. (2003) Nitrogen stress induced changes in the marine cyanobacterium Oscillatoria willei BDU 130511. FEMS Microbiol Ecol., 45(3), 263-272.
- Liefer, J., Garg, A., Campbell, D., Irwin, A and Finke, Z. (2018) Nitogen starvation induces distinct photosynthetic responses and recovery dynamics in diatoms and prasinophytes. Plos one, 14(10): e0224489.
- Lin, Q., Liang, R., Huang, Q., Luo, S., Anderson, M., Bowler, C., & Gao, H. (2017) Differential cellular responses associated with oxidative stress and cell fate decision under nitrate and phosphate limitations in Thalassiosira pseudonana: Comparative proteomics. Plos one, 12(9), e0184849.
- Liu, Y., Zhao, Z., Si, J., Di, C., Han, J., & An, L. (2009) Brassinosteroids alleviate chilling-induced oxidative damage by enhancing antioxidant defense system in suspension cultured cells of Chorispora bungeana. Plant Growth Regul, 59(3), 207-214.
- Lushchak, V. I. (2011) Adaptive response to oxidative stress: bacteria, fungi, plants and animals. Comp. Biochem. Physiol. C. 153, 175–190.
- Markou, G., Vandamme, D., and Muylaert, K. (2014) Ammonia inhibition on Arthrospira platensis in relation to the initial biomass density and pH. Bioresour Technol. 166, 259–265.
- McCarthy, J. J. (1983) Nitrogen cycling in near surface waters of the open ocean. Nitrogen in the marine environment, 487-512.
- Montibus, M., Pinson-Gadais, L., Richard-Forget, F., Barreau, C., and Ponts, N. (2015) Coupling of transcriptional response to oxidative stress and secondary metabolism regulation in filamentous fungi. Crit. Rev. Microbiol. 41, 295–308.
- Nakano, Y., & Asada, K. (1981) Hydrogen peroxide is scavenged by ascorbate-specific peroxidase in spinach chloroplasts. Plant Cell Physiol, 22(5), 867-880.
- Niemi, A. (1979) Blue-green algal blooms and N: P ratio in the Baltic Sea. Acta Botanica Fennica, 110, 57-61.
- Nishibayashi, Y., Saito,M., Uemura, S., Takekuma, S., Takekuma, H., and Yoshida, Z. (2004). Buckminsterfullerenes - A non-metal system for nitrogen fixation. Nature, 428, 279–280.
- Noctor, G., & Foyer, C. H. (1998) Ascorbate and glutathione: keeping active oxygen under control. Annu. Rev. Plant Biol, 49(1), 249-279.
- Olivares, J., Bedmar, J., and Sanjuan, J. (2013) Biological nitrogen fixation in the context of global change. Mol. Plant-Microbe Interact. 26, 486–494.
- Paerl, H. W., R. S. Fulton, P. H. Moisander, and J. Dyble. 2001 Harmful freshwater algal blooms, with an emphasis on cyanobacteria. Sci. World J. 1,76–113.
- Peng, L., Lang, S., Wang, Y., Pritchard, H. W., & Wang, X. (2017) Modulating role of ROS in re-establishing desiccation tolerance in germinating seeds of Caragana korshinskii Kom. J. Exp. Bot, 68(13), 3585-3601.
- Perry, G., Raina, A. K., Nunomura, A., Wataya, T., Sayre, L. M., & Smith, M. A. (2000) How important is oxidative damage? Lessons from Alzheimer's disease. Free Radic. Biol. Med, 28(5), 831-834.
- Qi, H., Wang, J., & Wang, Z. (2013) A comparative study of the sensitivity of F v/F m to phosphorus limitation on four marine algae. J. Ocean Univ. China, 12(1), 77-84.
- Raven, J. A., Wollenweber, B., & Handley, L. L. (1992) A comparison of ammonium and nitrate as nitrogen sources for photolithotrophs. New Phytol., 121(1), 19-32.
