Demographic development of the Republic of Belarus and the Russian Federation in the context of national security

Author: Shabunova Aleksandra Anatolyevna, Shakhotko Lyudmila Petrovna, Bobrova Anastasiya Grigoryevna, Kalachikova Olga Nikolayevna
Journal: Economic and Social Changes: Facts, Trends, Forecast @volnc-esc-en
Section: Social aspects of integration in the framework of the Union State
Article in issue: 3 (27) т.6, 2013.
Free access
The article considers the main features of demographic development in Russia and Belarus, and shows the similarity of demographic problems and the presence of demographic threats. It examines the state policy in the sphere of human reproduction, and for the Russian Federation it substantiates the necessity of influencing the demographic processes from the viewpoint of national security. The article proves that the Union State countries should unite their efforts for overcoming negative demographic trends.
Depopulation, reproduction of population, demographic security, demographic policy
Short address: https://sciup.org/147223478
IDR: 147223478 | UDC: 314.011(476+470)
Text of the scientific article Demographic development of the Republic of Belarus and the Russian Federation in the context of national security
Demographic security is the most important part of national security, which in the conditions of depopulation should be a priority task of the country’s internal policy. Similar socio-cultural development, economic, political relations of the Russian Federation and the Republic of Belarus predetermined the creation of the Union State for joint solution of existing problems, including demographic ones.
Russia and Belarus are united by a common historic past, similar socio-political setup, they are inhabited by related peoples. In the late 1990s – early 2000s these countries faced the demographic development trends, some of which are increasingly acquiring the features of demographic threats to the sustainable development of society. Demographic security of the state is becoming the priority sphere of national security and, therefore, the major task of the country.
The main demographic threats consist in the following phenomena: depopulation, ageing and high demographic burden on the able-bodied part of the population.
Demographic development. The decrease in the population of the Republic of Belarus over the past 10 years was more pronounced than in Russia – 5% vs. 3% (tab. 1) .
It should be noted that in the period under review the urbanisation process in Belarus, given its lower basic indicator (in 2000 the share of urban population in the republic amounted to 70% against 73% in the Russian Federation), was more intensive, than in Russia, and by 2011
the share of urban residents has increased by 6 percentage points (up to 76% versus 74%, respectively). This was one of the reasons for the decrease in birth rate in 2000 – 2005. Total fertility rate in Belarus beginning from 20021 is lower than that in Russia (fig. 1) .
Population mortality rate in both countries remains high, despite the positive trend of reduction in the crude death rate (fig. 2) .
Reduction in mortality, especially infant mortality, led to the increase in the population’s life expectancy. For instance, from 2000 to 2011 Russia experienced an increase in male life expectancy from 59 to 64 years, in female life expectancy – from 72.3 to 76 years, or by 8% and 5%, respectively. In the Republic of Belarus, where basic indicators were higher (63 years for men and 75 years for women in 2000), the increase was smaller – 3% for both sexes. However, life expectancy in Belarus is higher than in Russia (tab. 2) .
Demographic burden. Despite the fact that depopulation in Belarus has been continuing for over 20 years, the republic has not yet faced to the fullest extent those actual negative consequences that await it in the future, though until recently, the total population of Belarus has been decreasing, the number of the working-age population grew steadily, reaching in 2007 the figure of 6 million 66 thousand people. The share of working-age population in the entire population has been increasing even more rapidly, reaching its maximum in 2008 – 62.5%.
Table 1. Dynamics of the population of Russia and Belarus, million people
|
Country |
Year |
2011 to 2000, % |
|||||||
|
2000 |
2005 |
2006 |
2007 |
2008 |
2009 |
2010 |
2011 |
||
|
Russia |
146.3 |
143.2 |
142.8 |
142.8 |
142.7 |
142.8 |
142.9 |
143 |
97.7 |
|
Belarus |
10.0 |
9.6 |
9.6 |
9.5 |
9.5 |
9.5 |
9.5 |
9.5 |
95.0 |
|
Urban residents out of total population, % |
|||||||||
|
Russia |
73 |
73 |
73 |
73 |
74 |
74 |
74 |
74 |
1 |
|
Belarus |
70 |
72 |
73 |
73 |
74 |
74 |
75 |
76 |
6 |
|
Sources: Belarus and Russia: statistical digest. Rosstat. 2008, 2012. |
|||||||||
1 Excluding 2007.
Figure 1. Crude birth rate, ‰
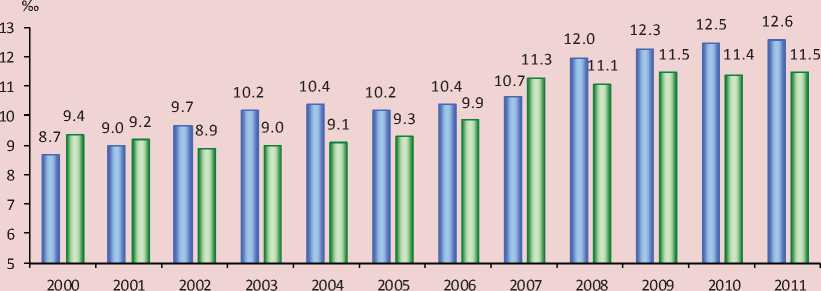
□ Russia □ Belarus
Figure 2. Crude death rate, ‰
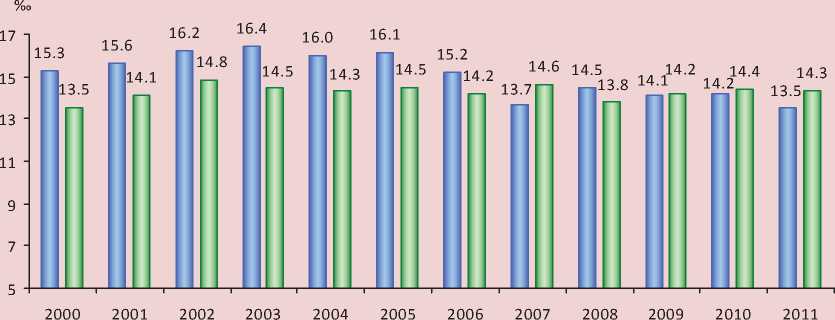
□ Russia □ Belarus
Table 2. Life expectancy, years
|
Territory |
Sex |
Year |
2011 to 2000, % |
2011 to 2006, % |
|||||||
|
2000 |
2005 |
2006 |
2007 |
2008 |
2009 |
2010 |
2011 |
||||
|
Russia |
Men |
59.0 |
58.9 |
60.4 |
61.0 |
62.0 |
63.0 |
63.0 |
64.0 |
108.4 |
106.0 |
|
Women |
72.3 |
72.4 |
73.2 |
74.0 |
74.0 |
75.0 |
75.0 |
76.0 |
105.2 |
103.8 |
|
|
Belarus |
Men |
63.0 |
62.9 |
63.6 |
65.0 |
65.0 |
65.0 |
65.0 |
65.0 |
103.2 |
102.3 |
|
Women |
75.0 |
75.1 |
75.5 |
76.0 |
76.0 |
76.0 |
76.0 |
77.0 |
102.7 |
102.0 |
|
|
Vologda Oblast |
Men |
59.5 |
56.1 |
58.4 |
60.0 |
60.0 |
61.0 |
60.8 |
62.05 |
104.3 |
106.2 |
|
Women |
73.2 |
71.7 |
73.3 |
74.0 |
74.0 |
74.0 |
74.4 |
75.06 |
102.6 |
102.5 |
|
Sources: Belarus and Russia: statistical digest. Rosstat, 2008, 2012; Regions of Russia: statistical digest. Rosstat, 2006, 2012.
This is the highest indicator for the whole history of the country’s development. The demographic burden on the able-bodied population has been constantly decreasing. Thus, according to the 2009 census, there were 624 dependent people per 1000 workingage population, while in 1970 – 894 people, and in 1989 – 785.7 people. These trends were favourable for the country’s economic development, this fact alleviated the socioeconomic problems, typical for the period. But in the short term the trends changed for the worse. This process has been already going on since 2008 (fig. 3) .
All this results in the complex socioeconomic problems, which the country hasn’t faced before, and which pose a real threat to its security. In at least 10 years Belarus will experience the reduction in the total population, as well as the working-age population, and the latter will decrease more rapidly.
According to the data for the beginning of 2013, the number of people entering the actual working age (aged about 22, when a person begins to work) is 134 thousand. After 10 years, those who are currently 11 years old (and at the beginning of 2013 their number was only 89 thousand, or by 45 thousand persons less) will be joining the ranks of working-age population.
125 thousand people entered the retirement age at the beginning of 2013, and in 10 years those people, the number of which is currently 147.1 thousand, i.e. by 10 thousand more, will reach this age. Moreover, these are the people who live in the country, and their number over 10 years will change slightly, almost exclusively at the expense of mortality and external migration.
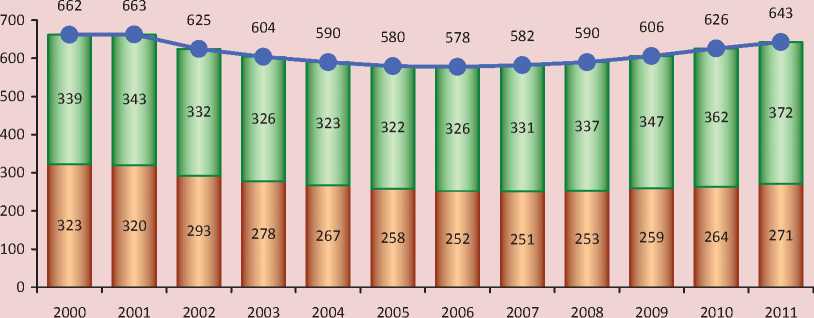
The situation is similar in the Russian Federation; however, the negative trends started a little earlier – in 2007 (fig. 4) .
Migration attractiveness of the countries in 2000 – 2011 decreased (tab. 3) . Significant changes in the migration mobility of population took place after the collapse of the USSR, with the flows of refugees and immigrants from other post-Soviet states. In addition, the flow of emigrants to the other foreign countries increased, which was accompanied by brain drain, the issue of illegal migrants has become acute as well. Internal migration flows in Russia and Belarus have also changed.
Figure 3. The change in the demographic burden on the working-age population of Belarus for 2000 – 2011, people per 1000 working-age population
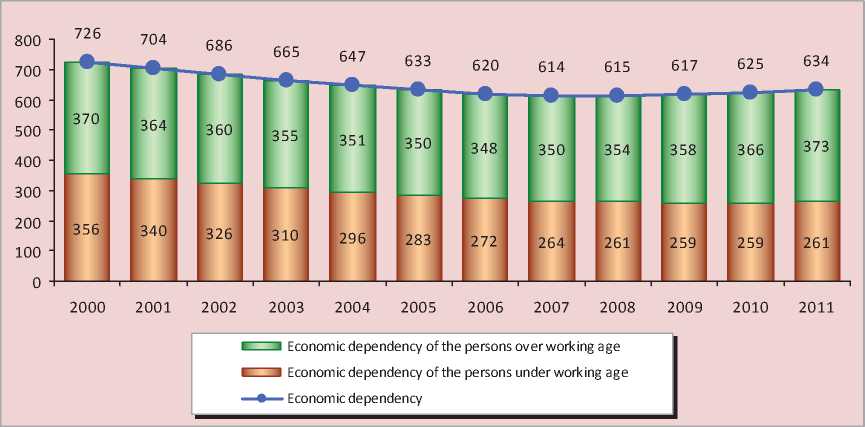
Figure 4. The change in the demographic burden on Russia’s working-age population for 2000 – 2011, people per 1000 working-age population
I-----1 Economic dependency of the persons over working age
I-----1 Economic dependency of the persons under working age
—•— Economic dependency, total
Table 3. Migration gain coefficient, ‰
|
Territory |
Year |
2012 2000, ‰ |
2012 2006, ‰ |
|||||||
|
2000 |
2005 |
2006 |
2007 |
2008 |
2009 |
2010 |
2011 |
|||
|
Russia |
2.5 |
0.9 |
1.1 |
1.8 |
1.8 |
1.8 |
1.3 |
2.2 |
-0.3 |
1.1 |
|
Belarus |
1.2 |
0.2 |
0.6 |
0.5 |
0.8 |
1.3 |
2.0 |
1.0 |
-0.2 |
0.4 |
|
Vologda Oblast |
0.1 |
0.3 |
-0.03 |
0.4 |
0.5 |
0.1 |
-0.2 |
0.5 |
0.4 |
0.5 |
|
Sources: Regions of Russia: statistical digest. Rosstat, 2006, 2012; Russia and countries of the world: statistical digest. Rosstat, 2002, 2004, 2006, 2008, 2010, 2012; Demographic yearbook of the Vologda Oblast. Vologdastat, 2005, 2012; Demographic yearbook of the Republic of Belarus. Belstat, 2012. |
||||||||||
So, the population is declining mainly in rural areas and small towns. In general, urban population continues to grow due to the migration inflow of rural population into big cities. As a result, the uneven population distribution throughout the country is aggravated. Rural to urban migration leads to the concentration of population in large cities and the abandonment of small towns and rural areas. 26% of the total urban population of Belarus is already concentrated in Minsk. As for Russia, 28% of its urban residents live in 12 cities with the population over one million. The demographic structure of rural population is being disturbed through the outflow of the youth, qualified specialists and young women. The process of ageing of rural population is accelerating.
Demographic policy. At the beginning of the 21st century, both countries stirred up their governmental activities to influence the natural movement of their population, which had an impact on the dynamics of demographic processes. Particularly notable results have been achieved in reducing mortality (tab. 4) .
The role of the state in ensuring demographic security can be efficient provided that the superior government authorities recognize the existence of the very problem and the profound socio-economic consequences it entails.
At that we should realize that solving demographic problems is a very complex task. It requires purposeful measures, time and financial resources, a concept of long-term state policy aimed at demographic security.
Table 4. Demographic coefficients, ‰
|
Territory |
2000 |
2006 |
2011 |
2011 to 2000, % |
2011 to 2006, % |
|
Birth rate, ‰ |
|||||
|
Russia |
8.7 |
10.4 |
12.6 |
144.8 |
121.2 |
|
Belarus |
9.4 |
9.9 |
11.5 |
122.3 |
116.2 |
|
Vologda Oblast |
8.8 |
10.9 |
13.0 |
122.3 |
116.2 |
|
Death rate, ‰ |
|||||
|
Russia |
15.3 |
15.2 |
13.5 |
88.2 |
88.8 |
|
Belarus |
13.5 |
14.2 |
14.3 |
105.9 |
100.7 |
|
Vologda Oblast |
16.0 |
17.1 |
15.7 |
98.1 |
91.8 |
|
Sources: Belarus and Russia: statistical digest. Rosstat, 2008, 2012; Regions of Russia: statistical digest. Rosstat, 2006, 2012. |
|||||
Belarusian government recognized the complexity of the demographic situation in the country, and certain measures have been taken in this regard. Thus, October 22, 2010, the President of the Republic of Belarus A. Lukashenko held the meeting with the participants of the all-Belarusian action “A question to the President”, where he noted that demographic security becomes one of the major guidelines of the government’s activity [9].
The House of Representatives adopted the Law on demographic security of the Republic of Belarus, which was approved by the President on January 4, 2002. In accordance with the law, the National Demographic Security Programme of the Republic of Belarus for 2007 – 2010 was developed and approved by the Decree of the President of Belarus on March 26, 2007 [8]. The aim of the Programme was to stabilize the demographic situation and create prerequisites for demographic growth in Belarus. The implementation period of the programme document expired in 2010, and the results could be estimated (tab. 5) .
Most of the target indicators set in the National Demographic Security Programme for 2007 – 2010 were achieved, excluding the crude death rate of the population, which was 14.4 ‰ in 2010.
However, it is rather a flaw of the Programme itself, since it didn’t take into account the specifics of existing age structure of the population in the country. The remarks made by demographers at the drafting stage of the programme document were not reflected in the final version.
The Russian Federation made demographic issues a priority sphere after President V.V. Putin’s Address to the Federal Assembly in 2006 [11]. The Concept for Demographic Development up to 2020 was elaborated, the national projects “Health”, “Education”, “Affordable housing” were launched, and a new type of support for parenting: “Maternity/ family capital”, was introduced. The main policy document was the National Programme on the Demographic Development of Russia for the period from 2006 to 2015.
Summing up the results of the first stage of its implementation (2006 – 2010), we should point out that the planned results have been achieved only with regard to infant mortality indicator, and it is to the credit of the health care system itself rather than demographic policy in general (tab. 6) .
The indicators of both natural and mechanical dynamics of the population are far from the planned ones. An example can be found in the difference between the planned and actual values of the balance of migration. It was forecast to have increased almost fourfold in four years, but it actually amounted to a little less than 20%. The forecast estimations of the dynamics of Russia’s population indicate its continuing reduction in the medium term [4].
Table 5. Results of implementing the National Demographic Security Programme of the Republic of Belarus for 2007 – 2010
|
Indicators |
Reported data for 2006 |
Target indicators for 2010 |
Reported data for 2010 |
|
Crude birth rate, ‰ |
10.1 |
10–11 |
11.4 |
|
Total fertility rate (number of children on average per woman) |
1.335 |
1.4 – 1.5 |
1.494 |
|
Infant mortality, ‰ |
6.1 |
6 |
4 |
|
Life expectancy, years |
69.4 |
70-72 |
70.4 |
|
Crude death rate, ‰ |
14.4 |
10-11 |
14.4 |
|
Population growth due to external migration, thousand people |
5.6 |
5.0 |
10.3 |
|
Source: Demographic yearbook of the Republic of Belarus. Belstat, 2012. P.153, 197, 302, 455. |
|||
Table 6. Results of implementing the National Programme on the Demographic Development of Russia for the period from 2006 to 2015, according to the results of the first stage (2006 – 2010)
|
Indicators |
Reported data for 2006 |
Target indicators for 2010 |
Reported data for 2010 |
|
Total fertility rate (number of children on average per woman) |
1.3 |
1.65–1.7 |
1.4 |
|
Infant mortality, ‰ |
11.0 |
7.0-8.0 |
7.5 |
|
Life expectancy, years |
65.3 |
70.0 |
68.9 |
|
Population growth due to external migration, thousand people |
132 |
420 |
158 |
|
Sources: Regions of Russia, 2012; Russia in figures, 2011, 2012. |
|||
In this regard, it is necessary to achieve more significant changes in demographic indicators and to enhance migration attractiveness of the country.
The weak support to the National Programme is evidenced by the fact that during its implementation period two more documents on the demographic development of Russia were elaborated: the Concept for the Longterm Socio-Economic Development of the Russian Federation for the period up to 2020 [7] and the Concept for the Demographic Policy of the Russian Federation for the period up to 2025 [6].
The main features of the demographic policy of Russia and Belarus, which need to be addressed, include the absence of targeted financially secure programmes on demographic development, uncertain migration policy and the fact that, despite official recognition of the significance of demographic issues, the very demographic security of the state is not given due attention.
Achievement of the programmes’ targets and a certain improvement of the situation may create a false impression that demographic problems are easy to handle. But that is not so.
First , the success of implementing the National Programmes is not big enough to establish a simple reproduction of the population, let alone a “slightly extended” reproduction, which is most often considered the best.
The population, as before, does not reproduce itself, and its number continues to decrease. Despite some growth in the recent years, fertility in both countries remains low. They ensure the reproduction of the population only by 65 – 70%. Life expectancy indicators grew by almost two years, but they lag behind those in the developed countries by 10 – 15 years. Although the migration gain for the last 20 years has been always positive, its volume is insufficient to fully compensate for the natural decline in the population of the country.
Second , the beginning of the 21st century was characterized by favourable conditions for the positive trends in the demographic development of Russia and Belarus. There was a certain improvement in the socio-economic situation, the growth in the population’s well-being, which had a positive influence on the demographic processes. Besides, special measures enhanced the welfare of families with children; in particular, they helped reduce the gap in the level of cash income between families with children and childless families. These measures also facilitated the creation of favourable conditions for education; they promoted access of the population to health services and education.
In the existing conditions, the major part of the population was able to realise their reproductive preferences. In these years the so-called “postponed children” were born, i.e. the children, the birth of which had been “postponed” by their parents due to the complicated socio-economic situation. According to calculations, the increase in the number of births in 2006 – 2010 is by more than 90% connected with the increase of birth rate in Belarus [13, p. 16] and by 78% in Russia [1, p. 82].
However, there are no grounds to speak about the increase in people’s determination and willingness to have children [5, 12]. It should be noted that the existence of two, let alone three or more children in the family remains a significant factor in the risk of its falling into the category of the poor. Thus, the data from sample surveys of households shows that in Belarus the share of households with the average per capita disposable income below subsistence level was 3.4% in 2010 (4.3% in Russia). Among the households with two and more children aged under 18, this share was 12.0%, i.e. four times more.
At the same time it cannot be denied that the opportunity of receiving benefits could play a crucial role when deciding in favour of one more birth among a certain percentage of the families that had doubts concerning the number of children they would like or afford to have. The growth of well-being and enhancement of the quality of life, of course, had a positive impact on the improvement of people’s health, which was facilitated by specially adopted measures undertaken to improve the work of public health sphere.
Third , the demographic processes in the first decade of the 21st century were positively affected by the following structural factors: the composition of the population by sex, age, marital status, etc. In these years in a significant part of the population reached the childbearing age, its ratio by sex and marital status was also favourable. Age and sex structure of the population contributed to the increase in the number of births due to the rapid growth of the number of women in child-bearing age: the numerous cohorts of those born in 1983 – 1986 entered this age. According to the latest census in Belarus 1088.8 thousand women were in active child-bearing age (20 – 34 years), which is by 39.1 thousand more than in the 1999 census (1049.7 thousand) [10, p. 212]. In Russia this figure was 15903.9 thousand according to the 2002 census and 17517.6 thousand according to the census of 2010 [2, 3]. The tendency of increase in the number of women of active child-bearing age has practically exhausted itself.
Soon the situation will be the opposite. As the small cohorts of those born in the 1990s reach the active child-bearing age, their number will be declining rapidly. This will adversely affect the dynamics of the number of children who will be born in the second and third decades of the 21st century. At the beginning of the century the specifics of the age structure of the population had a positive influence on the dynamics of death rate. In these years, the small cohorts of people born in the years of World War II started to go beyond the age of 60. This reduced the population in older age groups and, respectively, the number of deaths. As the numerous cohorts of people born in the 1950s reach the age of retirement, the number of population of pension age will increase; consequently, it would contribute to the increase in the number of deaths even given positive trends in the dynamics of indicators of age-specific mortality. Demographic forecasts have shown that if special measures for improving the demographic situation aren’t undertaken at the national level, the population will continue declining more and more rapidly [4, 12, 14].
It will be possible to achieve positive trends in reproduction of the population and to curb its decline by changing the trends in the development of all the three components in the complex. The problem will not be solved by reducing mortality rate alone, even to the lowest world level. This will cause the shift in the age of death to the more advanced age, which will increase the number of senior citizens and will have almost zero impact on the population in the younger and middle age groups. The dramatic increase in immigration will have a positive impact on the number and structure of the population. However, to prevent population decline, the indicators of positive balance of migration should be very high. Belarus will not be able to receive such volumes of migration flows, because the accommodation and employment of a large number of people requires substantial material resources and organizational work. The annual intake of even 50 thousand people will not solve the problem of depopulation; but already by the middle of the century, migrants and their descendants will comprise one third of the population in Belarus, and by the end of the century – two-thirds.
In theory, the problem of depopulation in the country can be solved most comprehensively by the rapid increase in birth rate up to the level of simple reproduction, but even after that the positive effect can be achieved only by the middle of the century. In order to obtain the result earlier, it is necessary to have not less than three or four children almost in every family, capable of procreation. However, it is almost impossible to achieve in the near future. An increase in birth rate, as well as a reduction in mortality or an increase in migratory flows can’t happen in no time, as it is envisaged by hypothetical scenarios. Hence, it is necessary to exert a comprehensive influence on all the components of population growth at the same time.
Russia and Belarus can solve demographic problems in cooperation within the framework of the Union State, exchanging experience, implementing common programmes including research work. An example of such cooperation can be found in the interaction between the Institute of Economics of the NAS of Belarus and the Institute of Socio-Economic Development of Territories of the Russian Academy of Sciences, with the support of the international grant of the Russian Humanitarian Science Foundation and the Belarusian Foundation for Basic Research RHSF-BFBR No. 13-22-01002/13 “Demographic security of Russia and Belarus: problems and prospects”.
References Demographic development of the Republic of Belarus and the Russian Federation in the context of national security
- Zvereva N.V., Arkhangelskiy V.N. Modern fertility policy in Russia: preliminary results and outlook. Federalizm. 2010. No. 2 (58). P. 69-84.
- Results of population census of 2002. Available at: http://www.perepis2002.ru/index.html?id=11,
- Results of population census of 2010. Available at: http://www.gks.ru/free_doc/new_site/perepis2010/croc/perepis_itogi1612.htm
- Kalachikova O.N., Shabunova A.A., Lastochkina M.A. Demographic evolution trends and prospects in Russia and the Vologda Oblast. Economic and social changes: facts, trends, forecast. 2012. No. 23. P. 122-132.
- Kalachikova O.N. Reproductive choice of a modern family. Economic and social changes in the region. 2008. No. 41. P. 62-67.
- The Concept for the demographic policy of the Russian Federation for the period up to 2025: approved by the Decree of the President of the Russian Federation No. 1351 dated October 9, 2007. Available at: http://www.demographia.ru/articles_N/index.html?idR=5&idArt=947
- The Concept for the long-term socio-economic development of the Russian Federation for the period up to 2020: approved by Resolution of the Government of the Russian Federation No. 1662-r dated November 17, 2008. Available at: Kremlin.RU
- The National programme on the demographic security of the Republic of Belarus for 2007 -2010. The Ministry of Labour and Social Security of the Republic of Belarus: http://www.mintrud.gov.by/ru/min_progs/prog22
- The official Internet-portal of the President of the Republic of Belarus. Archive of the press-service news of October 22, 2010. Alexander Lukashenko meets with the participants of the all-Belarusian action “A question to the President”. Available at: http://www.president.gov.by/press90647.html
- Population census of 2009. Vol.2. The population of the Republic of Belarus: its size and composition. Minsk: Belstat, 2009.
- The Address of the President of the Russian Federation to the Federal Assembly and the main guidelines of activity of the Council of Federation in 2006. Available at: http://www.garant.ru/action/conference/10108/
- Shabunova A.A., Kalachikova O.N. Fertility and reproduction of the population of the territory. Vologda: ISEDT RAS, 2011.
- Shakhotko L.P., Bobrova A.G. Methodology of assessing the impact of structural and socio-economic factors on the dynamics of the number of births and deaths. Institute of Economics of NAS of Belarus. Minsk: Law and Economics, 2013.
- Shakhotko L.P Model of demographic development of the Republic of Belarus. Minsk: Belaruskaya Navuka, 2009.
- Demographic yearbook of the Republic of Belarus. Belstat, 2012. P.153, 197, 302, 455
- Regions of Russia: statistical digest. Rosstat, 2006, 2012
- Russia and countries of the world: statistical digest. Rosstat, 2002, 2004, 2006, 2008, 2010, 2012
- Demographic yearbook of the Vologda Oblast. Vologdastat, 2005, 2012
- Demographic yearbook of the Republic of Belarus. Belstat, 2012.
