Demographic evolution trends and prospects in Russia and the Vologda oblast

Author: Kalachikova Olga Nikolayevna, Shabunova Aleksandra Anatolyevna, Lastochkina Mariya Aleksandrovna
Journal: Economic and Social Changes: Facts, Trends, Forecast @volnc-esc-en
Section: Social development
Article in issue: 5 (23) т.5, 2012.
Free access
The article deals with the analysis of demographic situation in the Vologda Oblast against the background of the global and Russian tendencies. It has been revealed that depopulation is observed in most developed countries, and depopulation growth rates are reduced in developing countries. Depopulation processes are retained in Russia, which can hinder social and economic development and contradict the country’s geopolitical goals. The Vologda Oblast is one of the “typical” Russian regions, where demographics are close to average ones. The demographic prospects of Russia and the Vologda Oblast indicate negative trends in the medium term. It is possible to reverse the situation by increasing the number of children in families, that is by changing the model of population’s fertility.
Demographic evolution, depopulation, birth rate, mortality rate
Short address: https://sciup.org/147223381
IDR: 147223381 | UDC: 314.8.062(470.12)
Text of the scientific article Demographic evolution trends and prospects in Russia and the Vologda oblast
Federal district, subject Year 2010 to 2000, % 2000 2005 2008 2009 2010 Central 38228 37546 37151 37120 n/a 97.1 North West 14199 13628 13462 13450 n/a 94.7 Karelia Republic 729 698 687 686 645 94.1 Komi Republic 1043 985 959 955 902 91.6 Arkhangelsk Oblast 1369 1291 1262 1258 1228 91.9 Vologda Oblast 1290 1235 1218 1216 1202 94.3 Kaliningrad Oblast 958 940 937 938 942 97.9 Leningrad Oblast 1680 1644 1632 1631 1713 97.1 Murmansk Oblast 923 864 843 840 796 91.0 Novgorod Oblast 710 665 646 643 634 90.6 Pskov Oblast 782 725 696 692 674 88.5 St. Petersburg 4715 4581 4582 4591 4849 97.4 South . 22743 22821 22835 22935 n/a 100.8 Volga 31703 30710 30241 30134 n/a 95.1 Ural 12515 12279 12241 12268 n/a 98.0 Siberian0 20464 19794 19553 19553 n/a 95.5 Far Eastern 6913 6593 6487 6450 n/a 93.3 Russia 146304 142754 141904 141909 142905 97.0 Source: Federal State Statistics Service. Available at:
Source: Regions of Russia. Socio-economic indicators, 2009. Available at:
The mortality rate in Russia was so high in the first half of the 1990s that scientists and politicians began to speak about the mass extinction of the population, demographic catastrophe and even genocide of the Russian people [2, 7, 12]. Only since 2003 there has been a decrease in the crude death rate (fig. 1) .
Since 2000, there has been a tendency to increase the total birth rate in Russia (fig. 2) . But this result is largely caused by the effect of “population waves”: young people who were born in the 1980s have entered the childbearing age.
The birth rate in the Vologda Oblast corresponds to the national average level. The total birth rate has increased from 8.7 to 12,5‰ over the period from 2000 to 2010 (see fig. 2). On average, since the beginning of the century the total birth rate hasn’t dropped below 9.7‰ in the Vologda Oblast (in Belozersky District); and the maximum value (12.5‰) has been fixed in Verhovazhsky District (fig. 3) .
Most municipalities of the region (15 of 28) remained the indicator average value above the average regional level in the period under our review.
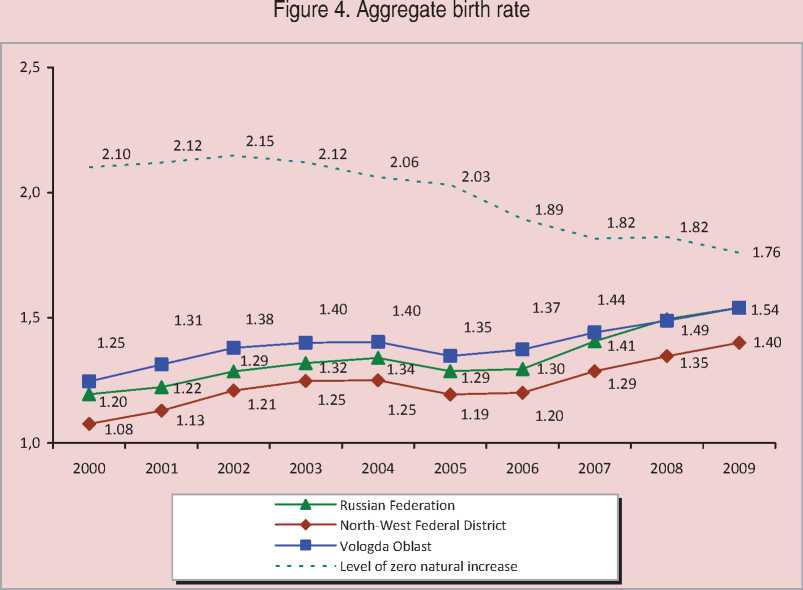
The assumption that the increase in the birth rate is largely caused by the demographic structure of the population is proved by the changes in the aggregate birth rate. This indicator gives a more faithful representation of the number of children and reflects the average reproductive guidelines of population. The aggregate birth rate in Russia increased from 1.2 to 1.5 in the period from 2000 –2009, but it did not provide the level of zero natural increase during those eight years1 (fig. 4) .
The aggregate birth rate in the Vologda Oblast that repeated All-Russian tendencies had declined to 1.2 by 2000; then there was a
Figure 2. Total birth rate (per 1,000 people)
2000 2001 2002 2003 2004 2005 2006 2007 2008 2009 2010
▲ Russian Federation ♦ North-West Federal District ■ Vologda Oblast
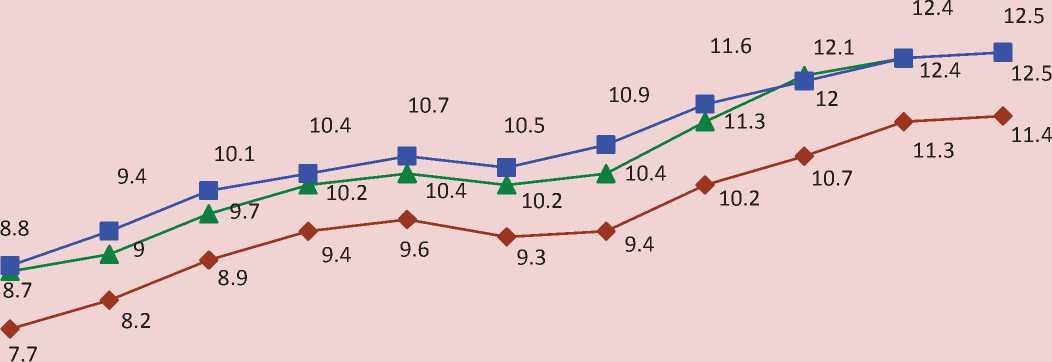
Source: Regions of Russia, 2008: Stat. Col. Rosstat. Available at: ; Demographic Yearbook of the Vologda Oblast: Stat. Col. Vologdastat, 2009.
Figure 3. Total birth rate in the Vologda Oblast, on average over the period from 2000 to 2010, Ppm
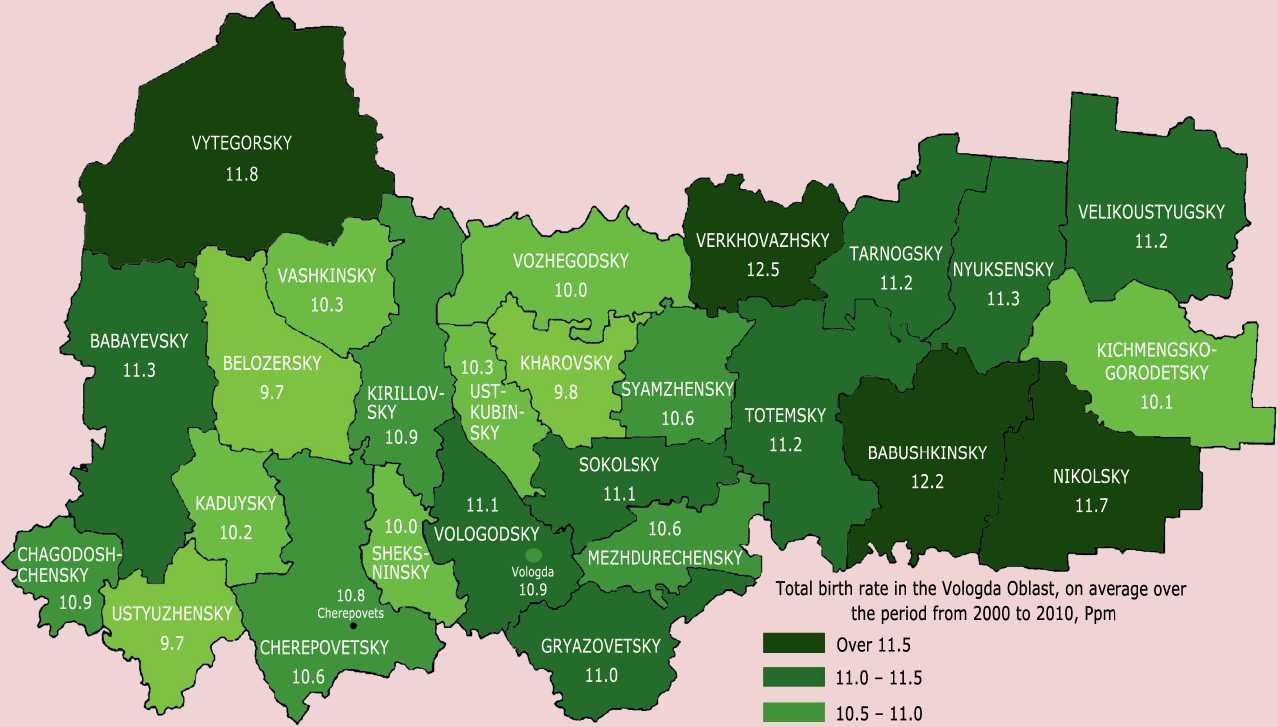
10.0 - 10.5
Under 10.0
Source: CBSD / Rosstat. Available at: (Access date: 05.12.2011); author’s calculations.
certain increase in the period till 2004 (from 1.2 to 1.4); in 2005 it reduced again to 1.3, and then the aggregate birth rate had increased to 1.49 by 2008 (see fig. 4).
In 2009, the Vologda Oblast ranked first among the regions of the North-West Federal District according to this indicator. At the same time, its territorial differentiation was remained: rural population showed both the higher values of aggregate birth rate and more substantial increase in aggregate birth rate as compared with the 2000 level. This fact proves that lifestyle influences the population’s reproductive behavior.
One of the important reasons for the decline in the birth rate in retrospect was the transformation of reproductive behavior, caused by the specifics of socio-economic life, in particular, by involving women to take part in production and improving their economic activity in general.
In the early 1990s, European researchers noted the intensified will of women to selfrealization in the profession, which resulted in the extension of training period and marriage age, as well as in putting off births, which, in turn, led to the fact that the first child was the only one [15, p. 37].
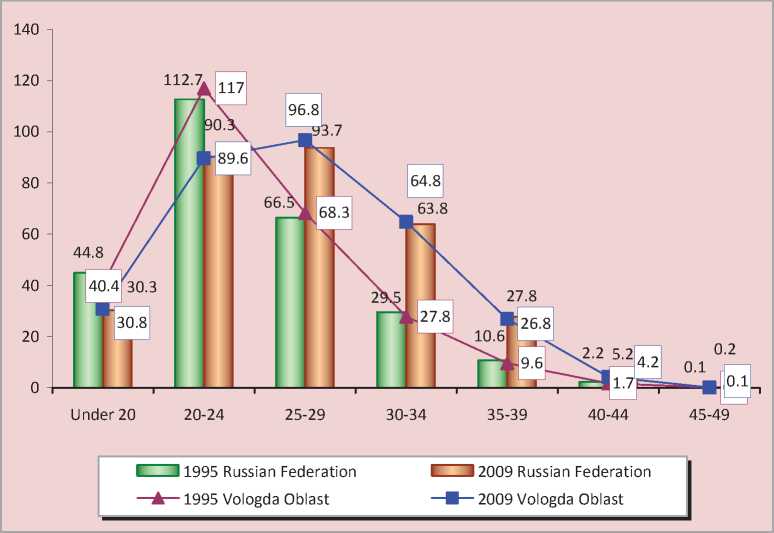
There are the similar processes in today’s Russia (2005 – 2010) despite the patriarchal views (fig. 5) .
In 1995, fertility peak was registered among the women aged 20 – 24, and it was fixed in the group of women aged 25 – 29 in 2009. In addition, there was a parallel decrease in births in the group of women aged under 20 (from 44.8 to 30.5 per 1,000 women of the same age) and an increase in the number of births in the older age groups (30 – 34, 35 – 39 and 40 – 44 years old). There were the similar trends both in the regions of the North-West Federal District and in other federal districts.
Figure 5. Age-specific birth rates (the number of children who have been born over a year per 1000 women of age), years
It should be also noted that the state of population makeup according to sex and age that determines a birth rate along with reproductive behavior corresponds to regression (depopulation, degradation) [1, p. 56] mode of reproduction.
The distribution of Russia’s population within the main age groups indicates a very high level of demographic aging (according to G. Bojio-Garnier – E. Rosset scale) and tends to increase the share of persons aged 60 and older (fig. 6) .
Moreover, the process of aging “goes upwards” due to reducing the birth rate (for example, such as in Japan). I.e. able-bodied population replacement is not provided, demographic load will increase with no prospect of decline in the case of keeping the trends in the population’s reproductive behavior.
There were 606 nonworking persons per 1000 able-bodied people in the Russian
Federation in 2009: 259 persons aged under 16; 347 persons – over able-bodied age. Since 2000, the total demographic load decreased by 8.5% (the share of children reduced by 20%, and the share of pensioners increased by 2%). In 2009 as compared to 2000, the demographic load due to the individuals under able-bodied age decreased in all the regions, the demographic load due to the people over able-bodied age decreased in 36 regions, and these figures increased in other regions (57%).
Although the level of demographic load in Russia is slightly greater than in the European Union [3], the problem is in the fact that the economic activity of people over able-bodied age is lower [6], and their health is worse and it requires significant social transfers.
These features of population’s demographic structure, a shift of birth rates towards older women and reproductive health deterioration lead to the reduction not only in the quantitative
Figure 6. Changes in the population’s age structure, %
|
100% 90% 80% 70% 60% 50% 40% 30% 20% 10% |
20.6 60.1 19.3 |
21.6 62.3 16.1 |
20.5 62.0 17.5 |
|||||
|
0% |
2001 2010 Russia |
2001 North-W |
||||||
|
□ Under able-bodied age DAble- |
||||||||
|
22.8 62.7 14.5 |
21.0 59.9 19.1 |
21.9 62.0 16.1 |
||||||
|
2010 |
2001 |
2010 |
||||||
|
est Federal District |
Vologda Oblast |
|||||||
|
bodied age □ Over able-bodied age |
||||||||
Consider the predictive estimates of demographic processes in order to identify structural reserves to increase the birth rate. According to the latest assessments of Rosstat, the total population in the country will have amounted to 139 041.8 thousand people on average by 2030; these figures are lower by 2% as compared with 2009 (tab. 4) .
According to the Ministry of Health and Social Development of the Russian Federation, the number of women in reproductive age will decrease by 4.1 million persons or by 10.7% in 2020 as compared with 2009. Moreover, this reduction will be in the most active childbearing period: the number of women aged 20 – 29 will decreased by 4.6 million persons or by 38%. After 2010, active reproductive age will include small contingents of women who were born in the 1990s.
The share of women aged 20 – 29 in the total population will have decreased from 8.6% in 2009 to 7.2% by the beginning of 2015,down to 5.2% by the beginning of 2020 and to 4.8% by the beginning of 2025. There will be the most significant reduction in this category of population in the period from 2012 to 2021. High birth rates will be required to stop the natural population loss (when the 2010 mortality rate is constant): 2.14 in 2015, 2.55 in 2020 and 2.91 in 20252.
Medium term population forecast for the Vologda Oblast (till 2030) allowed us to assess the effects of the current demographic situation and possible trajectories in its changes. In constructing the model, the authors have made a number of assumptions about the demographic dynamics. Firstly, they have taken into account the possible changes in the key demographic component – a birth rate, a mortality rate and
Table 4. Population changes in Russia according to alternative forecasts, thsd. pers.
Year Lower forecast Normal forecast Upper forecast 2015 139639.9 142168.6 143848.9 2020 136231.9 141770.7 145623.2 2025 131778.0 140643.3 146862.0 2030 126916.9 139041.8 147772.3 Source: Estimated population of the Russian Federation until 2030: Stat. Bull. Moscow, 2010. Available at::
Figure 7. Population forecast for the Vologda Oblast according to four alternative forecasts, thsd. pers.
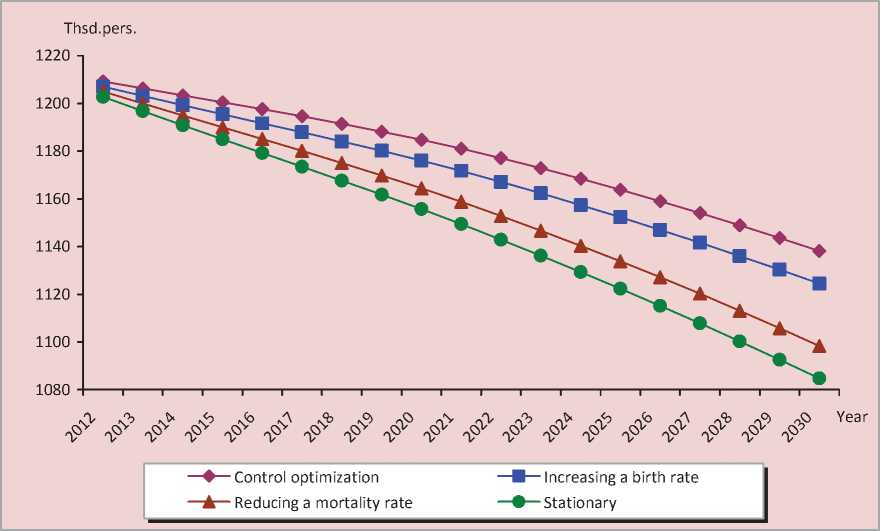
migration. The population’s marriage and divorce rates, as well as socio-economic factors (e.g., population income, education, housing, etc.) are not considered. It is possible to assume that their influence is reflected in the number of births and deaths of people.
The calculations are performed in four hypothetical variants of demographic development through the classification by the year of birth. According to each variant, the population size in the region will have reduced by 2030 in regard to the 2010 figures (fig. 7) .
Lower estimate in this forecast amounts to 1085 thousand persons by 2030 (according to the inertial scenario of development) and upper estimate is 1138 thousand persons (control optimization scenario, including a reduction in mortality and an increase in the birth rate). The predicted values of population size, which are given by the scenarios of reducing mortality and increasing birth rates, are laid within the boundaries of this interval. This confirms the predominant role of comprehensive measures to improve the situation among the similar ones.
The comparison of different scenarios (see fig. 7, tab. 5 ) shows that a significant deviation for the better is possible only in a few years of this practice even with the government support (significant difference in predicted scenario values will begin in 2015: the difference is more than 15 thousand people).
Table 5. Variable-based demographic forecast for the Vologda Oblast
|
Scenario |
Population size, thsd. pers. |
The share of able-bodied population, % |
Demographic load, persons of nonworking age per 100 ablebodied people |
||||||
|
2010 |
2020 |
2030 |
2010 |
2020 |
2030 |
2010 |
2020 |
2030 |
|
|
Inertial |
1214 |
1156 |
1085 |
62 |
55 |
54 |
61 |
82 |
83 |
|
Control optimization |
1185 |
1138 |
54 |
53 |
86 |
88 |
|||
|
Reducing a mortality rate |
1164 |
1098 |
55 |
54 |
83 |
84 |
|||
|
Increasing a birth rate |
1176 |
1124 |
52 |
52 |
87 |
91 |
|||
The share of people aged 60 and over will have increased to 23% by 2030 (with a value of 18% in the base year of the forecast). The region’s population aging will continue in the period from 2010 to 2030, which effects will be significant for the demographic (the “base” for the lower birth rates and high mortality), economic (slowdown in labour replacement, increase in the load on the able-bodied population) and social (increases in costs of social security, increased pressure on social infrastructure) components of society.
Further increase in gender disparity is expected in 2010 – 2030, and therefore there will be 81 man per 100 women in the Vologda Oblast by the beginning of 2030 (85 man in 2010). The number of women in reproductive age will be reduced each year; these figures have been reduced by 19% on average over the whole forecasting period.
Variative demographic forecast of changes in the Vologda Oblast and Russia’s total population till 2030 indicates depopulation even with the planned increase in the birth rate. Reducing the number of women of reproductive age in future raises the problem of increasing the numbers of children in families, which actualizes studying the features of population’s reproductive behavior.
Thus, the demographic situation in Russia and the Vologda Oblast at the present time and in foreseeable future allow to increase a birth rate only through correcting reproductive behavior and increasing the numbers of children in families.
References Demographic evolution trends and prospects in Russia and the Vologda oblast
- Borisov V.A. Demograpy. Moscow: Publishing House NOTABENE, 2001.
- Glazyev S.Yu. Genocide. Moscow: Terra, 1998.
- Demographic load: last years of favorable dynamics. Available at: http://www.demoscope.ru/weekly/2005/0215/tema04.php
- Demographic Yearbook of the Vologda Oblast: Stat. Col. Territorial agency of FSSS in the Vologda Oblast, 2009.
- Demographic Yearbook of Russia -2001: Stat. Col. Rosstat, 2001.
- Dobrohleb V.G. Age and gender stereotypes in the context of demographic aging. In: Proceedings of the International Conference on “Population, family, quality of life”. Moscow: M-Studio, 2008. P. 38-44.
- Zakharov S.V. Cohort analysis of mortality in Russia. Available at: http://www.demoscope.ru/center/zacharov/zachar_rus.html
- Maksakovskiy V.P. Geographical picture of the world. Moscow: Drofa, 2008.
- Estimated population of the Russian Federation until 2030: Stat. Bull. Rosstat. Moscow, 2010. Available at: http://www.gks.ru
- Regions of Russia. Socio-economic indicators -2008: Stat. Col. Rosstat. Available at: http://www.gks.ru
- Regions of Russia. Socio-economic indicators -2009: Stat. Col. Rosstat. Available at: http://www.gks.ru
- Strategy of Russia’s demographic development. Ed. by V.N. Kuznetsov, L.L. Rybakovskiy. Moscow: ISPR RAS, 2005.
- European Commission. Eurostat. Available at: http://epp.eurostat.ec.europa.eu
- Europe in figures. Eurostat yearbook 2009. P. 130. Available at: http://epp.eurostat.ec.europa.eu
- Fauth W. Praktische Personalarbeit als Aufgabe: Grundlagen, Konzepte, Checklisten. Wiesbaden: Gabler, 1991.
- Population Division of the Department of Economic and Social Affairs of the United Nations Secretariat, World Population Prospects: The 2008 Revision. Available at: http://esa.un.org/unpp
- World Development Indicators. World Bank, 2006, 2011. Available at: http://www.worldbank.org
- World Population Data Sheet 2011. The World at 7 billion. Population Reference Bureau.
