Demographic transformations of the Russian regional space

Author: Kurushina Elena Viktorovna, Druzhinina Irina Vasilevna
Journal: Economic and Social Changes: Facts, Trends, Forecast @volnc-esc-en
Section: Social development
Article in issue: 3 (39) т.8, 2015.
Free access
The paper considers the transformations of the quantitative components of human capital, which is the main driver of economic growth in the material, institutional and mental space. According to the author's concept of stratified space, the processes of self-reproduction and self-renewal of a system are carried out in the material space. This can be determined by the indicators of fertility, mortality and migration in the demographic subsystem. The process of self-regulation of a system on the basis of legislative acts and behavior patterns is carried out in the institutional space. Institutional transformations are also manifested in the implementation of federal target programs for socio-economic development, affecting the state of the demographic subsystem. The processes of self-reflection, self-determination and self-development are carried out in the mental space. Mental transformations in the demographic subsystem are manifested in the change of value orientations...
Transformation, natural population growth, institutional and mental space, model of man, regions of Russia
Short address: https://sciup.org/147223723
IDR: 147223723 | UDC: 332.05+314.18 | DOI: 10.15838/esc/2015.3.39.10
Text of the scientific article Demographic transformations of the Russian regional space
Human capital is the main driving force of economic growth under the current economic paradigm. Population size, as a quantitative characteristic of human capital, depends on the intensity of demographic changes and their trends, such as natural population increase, migration outflow and inflow.
The term “demographic transition” is more succinct as compared to “demographic change”. The term “transformation” in its first meaning denotes “change” and “conversion” [17]. Transformation of biological (living) system involves the conversion (appearance of new traits in a transformant) resulting from the introduction of information. In accordance with the author’s concept of stratified space, formed on the basis of the modern system and spatial paradigms, demographic transformations of a regional system occur in the interrelated spheres of material, institutional and mental spaces [9], while demographic changes are registered only in the material sphere. The structuring of space has been made in accordance with the types of communications developed by E. Jantsch [20] and system processes (tab. 1).
Table 1. Characteristics of the concept of stratified space of a self-developing system
|
Types of communication |
Authors’ concept of stratified space |
||
|
Spheres of space |
Systemic processes |
Processes of demographic subsystem |
|
|
1. substance and energy exchangce |
Material space |
Self-production, self-renewal |
Processes of fertility, mortality and migration |
|
2. Information exchange |
Institutional space |
Self-regulation |
Regulation of demographic processes on the basis of legislative acts and behavior patterns |
|
3. Neuronic communications |
Mental space |
Self-reflection, self-determination, self-development |
Formation of value orientations, strategic goals and motives |
The study presented in the paper is relevant due to the fact the issue concerning the transformation of the multidimensional space of a self-organizing system is not developed enough, since it requires a synthesis of the knowledge of economics, management, sociology and other sciences.
Institutional transformations involves changing “the rules of the game” (D. North) by structuring the space and creating the field of motivation [10]. The paper considers institutional changes in the context of changes in the legislative regulation of the socio-economic situation, including the processes of natural population increase.
Mental transformations (in the demographic subsystem) are understood by the authors as a change of value orientations and motives by type of mentality of Man [12] with respect to the processes of fertility, mortality and migration of the population associated with changes in living conditions in the regions and their legal regulation.
The change of value orientations is reflected in the concepts of development, theories and models of Man. Adam Smith studied “human motive, leading to the development of economy”, based on the desire to “improve living conditions” [7, p. 725], that is why the concept of “Homo economicus” (economic Man) is associated with the name of the classic of economic theory. The authors consider that when studying mental transformations in the context of self-development of a system, the models of Man should be classified according to a system of values conceptualized in modern development strategies (tab. 2) .
Using official data of regional statistics [13, 15, 16], the paper considers demographic transformations in the material space (demographic changes). The diagram (fig. 1) shows that since 2005 the upward trend in the rate of natural increase has determined the general dynamics of population increase in Russia.
Table 2. System of values of models of Man
|
Model of Man |
Values |
|||
|
economic |
social |
environmental |
innovative |
|
|
Development concept |
||||
|
economic growth |
human development |
environmentally-oriented development |
innovation development |
|
|
sustainable development |
||||
|
1. Economic Man |
+ |
^— |
- |
- |
|
2. Socio-Economic Man, who lives on the territory of |
+ |
+ |
- |
- |
|
2.1. agglomeration centers |
++ |
++ |
- |
- |
|
2.2. periphery |
+ |
+ |
- |
- |
|
3. Socio-Natural Man |
^— |
+ |
+ |
- |
|
3.1. Environmental Man |
- |
- |
+ |
- |
|
3.2. Householder Man |
^— |
+ |
- |
- |
|
4. Innovative Man |
- |
- |
- |
+ |
Figure 1. Dynamics of the rates of natural, migration and general population increase in 1995–2012
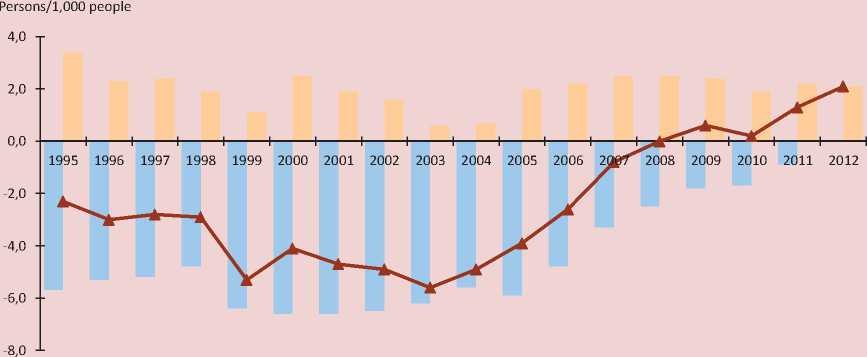
^^м Natural increase rate
^^н Migration increase rate
* Total population increase rate
Source: Federal State Statistics Service [13, 16].
The study of the dynamics of population increase rates allows us to state that natural population decline was observed during the whole period under analysis. In 2000– 2003 it was more than 6 people per 1,000 residents. In 1995–2012 the average value of mortality rate (14.8) exceeded birth rate (10.4) by 4.4 per mille.
Since the mid-2000s there has been a clear decreasing trend in natural population decline; this trend determined similar changes in the total population growth rate. If in 2005 the population of Russia decreased due to natural causes by 5.9 people (per 1,000 population), the by 2008 this figure has amounted to only 2.5 persons, which is equal to the level of migration increase. By 2012, the rate of natural population increase, or rather, decline, has reached the zero threshold for the first time during the study period. The gap between mortality and fertility formed in Russia in the 1990s was overcome in 2005, fertility rate was 10.2 children per 1,000 population and mortality rate was 16.1 people, and by 2012 it had risen to 13.3 people (given the reduction in the level of mortality to the same level). In 1995–2012 the average annual growth rate of fertility was 2.5%, and the average annual growth rate of mortality was 0.7%. Since 2005 the average annual growth rate of fertility has increased twofold and amounted to more than 5%. The number of deaths per 1,000
population in this period declines annually by 2.9%, which is four times higher than the average rate of change over the analyzed period.
Positive growth trends in birth rate in the Russian regions resulted from the transformation of institutional space. The field of motivations of the natural increase of human capital was formed after the Federal Law “On additional measures of state support of families with children” of December 29, 2006 No. 256-FZ entered into force. The impact of the institution of maternity capital was evident in the increase of birth rate. If in 2006 the growth of birth rate in Russia was less than 1%, then in 2007 and 2008 it increased to 16.5%, which is more than 8% annually. According to the authors, the motivational factors that increase birth rate and associated with the possibility of increasing the retirement savings of mother, improvement of housing conditions, obtaining education at the expense of maternity capital correspond to the mentality of a Socio-Natural Man [12].
The period for studying transformations in the format of a comparison of 2005 and 2012 was chosen mainly due to significant institutional changes in the social sphere, since in 2006 the federal target programs (FTP) for the development of education, social support of disabled people, etc., were launched. In addition, since the mid-2000s there have been changes in the direction and pace of demographic transformations in the material space (see fig. 1); this fact served as an additional point in favor of choosing 2005 as the starting point of this research. In 2012 the federal target programs “Prevention and control of socially significant diseases”, “Improvement of road safety”, “Social development of the village” and other programs were finished; this fact explains the logic of the analyzed period at the end of the next phase of institutional transformations.
The purpose of the study was to identify demographic transformations in the stratified regional space of Russia during the seven-year period. Methodological basis for the study of mental transformations was the research by the authors of the present article on justification of motive systems [11] according to the content theories of motivation by A. Maslow, K. Alderfer, D. McClelland, F. Herzberg and other scholars [8, 14, 19]. The demographic change determinants, such as fertility and mortality were studied with the help of multifactor models that were constructed for 83 subjects of the Russian Federation, and also with the help of matrix analysis methods. Table 3 contains a set of indicators for creating parametric models of the coefficients of natural population increase.
The regression model of fertility rate (Rf) before institutional change (2005), which was obtained in the procedure “Regression/Linear” of the package IBM SPSS by eliminating 16 selected variables insignificant factors, included only eight factor characteristics that are the most significant from the point of view of statistical criteria of their importance:
Table 3. Factors-indicators of dependence of the coefficients of natural population increase in the regions
|
Need |
Motivation factor |
Factor-indicator |
life safety. |
Standard of living |
Real average wages in % to subsistence level (Х1) |
|
Provision of population with new housing, m2/person (Х2) |
||
|
Favorableness of life environment |
Number of children per 100 places in children’s pre-school institutions (Х14) |
|
|
Morbidity per 1,000 population (Х3) |
||
|
Social security |
Man-days of unemployment in % to economically active population (Х4) |
|
|
Real size of pensions in % to subsistence level (Х5) |
||
|
Physical safety |
Number of registered crimes per 100 thousand people (Х6 ) |
|
|
Number of doctors per 10,000 population (Х13) |
||
|
1. Communication: relationship, being part of a social group |
Opportunities of a society |
Population density, persons/ km2 (Х7) |
|
Number of theatre visitors per 1,000 population (Х16) |
||
|
Infrastructure security |
Motor road density, km/1,000 km2 (Х8) |
|
|
Provision of population with communication services, thousand rubles/ person (Х9) |
||
|
2. Achievements respect, self-expression, growth. |
Competitiveness of productions |
Export per capita, US dollars/person (Х10) |
|
Proportion of Innovative enterprises, % (Х11) |
||
|
Entrepreneurial environment |
Proportion of workers of small enterprises in total employment, % (Х12) |
|
|
Educational environment |
Number of university students per 10,000 population (Х15) |
R f 2005 = 22.668 – 0.003 х 3 + 0.12 х 4 –
– 0.023 х 5 – 0.011 х 8 + 0.190 х 10 – 1.52 х 12 –
– 0.039 х 13 – 0.037 х 14. ( 1)
Based on the model obtained, we can state that independent variables correlate with the value system of a socio-natural Man who lives in peripheral areas, the main feature of which is remoteness from centers of socio-economic development. The level of development is characterized, as a rule, by the presence of good production infrastructure (X8) and social infrastructure (x14), by the degree of favorability of business environment (X12) and the development of the services sector (X13). Inverse relationship between birth rate and the observed factors in the model (1), the factors that have high standardized coefficients (β(X8) = -0.358; β(X12) = -0.264; β(x14) = -0.193; β(X13) = -0.172), indicates the most intensive reproductive processes in peripheral areas. For instance, in 2005 birth rate in Chukotka was 15.3 per 1,000 population; in the Republic of Tyva – 19.7; in Moscow and in Saint Petersburg this figure was twice as low: 8.5 and 8.4, respectively.
Judging by the presence of a direct and close enough (β(X4)=0.319) correlation between fertility rate and employment rate in the regions with high unemployment rate (X4), against the background of unfavorable business environment (X12), the increase in fertility acts as an alternative to employment, which corresponds to the mentality of a Householder Man. The variable of person-days of unemployment as a percentage of economically active population is among the indicators that characterize the state and functioning of the labor market [4, 5]; this variable also takes into account the number of unemployed and the duration of job search in the regions. Elasticity coefficient for this feature makes up 0.72%. Real pension (X5) also refers to the mentality of a Householder Man, but only for a pensioner (person past childbearing age). Naturally, pensioners choose to live in the regions where the level of social protection is high.
Birth rate is lower in Russia’s regions with high proportion of pensioners, that is why the relationship between the factor feature X5 and the final variable in the model (1) is reverse.
There is a direct relationship between the mentality of an Environmental Man and fertility. Lower rates of natural population growth were observed in 2005 in the regions with unfavorable ecological environment and high level of morbidity (X3).
The mentality of an Economic Man, whose rationality is manifested in an increased birth rate in the territories of competitive regions with a high share of exports per capita (X10), had, judging by the β -coefficient (0.244), an average impact on the resulting indicator.
Table 4. Statistical criteria of quality and characteristics of multifactor dependencies of the natural growth rate of population in Russia’s regions
|
Indicator |
Acceptable value |
Multifactor dependence of the coefficient |
|||
|
of fertility |
of mortality |
||||
|
2005 |
2012 |
2005 |
2012 |
||
|
1. Criterion for assessing the quality of the model |
|||||
|
1.1. Regression coefficient (R) |
≥ 0.7 |
0.759 |
0.798 |
0.827 |
0.840 |
|
1.2. Determination coefficient (R 2 ) |
≥ 0.7 |
0.576 |
0.637 |
0.683 |
0.706 |
|
1.3. F-statistics |
> 3.920 (when the number of degrees of freedom is 1 and (72–73) and significance rate is 0.05) |
4.521 |
6.2421 |
7.335 |
9.006 |
|
1.4. Durbin–Watson statistic |
≈ 2 |
1.809 |
1.704 |
1.359 |
1.440 |
|
2. Factor characteristics |
(Х1, Х2, …, Х16) |
||||
|
2.1. Continuity of factors |
Х 4 , Х 5 , Х 8 , Х 12 , Х 14 |
Х 4 , Х 6 , Х 8 , Х 9 , Х 12, Х 14 |
|||
|
2.2. Transformations in factor characteristics |
Х3, Х10, Х13 |
Х7, Х9, Х11, Х15 |
Х1, Х10, Х13, Х15 |
Х3, Х7 |
|
In general, the correlation (1) is adequate from the viewpoint of the quality criteria of the model. Multicollinearity of the variables is eliminated with the use of analysis procedure “Regression/Linear” in the package IBM SPSS. The value of the multiple regression coefficient (R=0.759) is close to unity, indicating a close relationship between fertility rate and the factors included in the model (tab. 4) .
This model, judging by the level of determination coefficient (R2 = 0.576) explains 58% of the variation of the dependent variable. The calculated value of F-statistics (4.521) exceeds the critical value (3.9) when the number of degrees of freedom is 1 and 73. The value of the Durbin–Watson statistic (1.809) is close to 2.
Institutional change in Russia, which began in 2006–2007 and promoted the childbearing through the introduction of maternity capital, influenced demographic processes. The obtained multivariate dependence for 2012 is adequate from the viewpoint of all the quality criteria discussed above, and is comparable with the analogous dependence for the conditions of 2005 (1):
К™2 = 4.373 + 0.008 х 4 - 0.015 х 5 +
+ 0.003 х 7 – 0.007 х 8 – 0.268 х 9 + 0.157 х 11 –
-
– 0.228 х 12 + 0.170 х 14 – 0.006 х 15. (2)
The continuity of the multivariate dependencies of birth rate is provided by the factors Х4, Х5, Х8, Х12 and Х14. “New information” is associated with the emergence of independent variables X9 (provision with communication services) and X15 (educational services), which (along with Х8 and Х12) are the characteristics of socio-economic development. A marked increase in birth rate in the territories of the peripheral type is confirmed by an increase of the standardized coefficients of inverse influence factors (development of infrastructure in the territory X8 and development of entrepreneurial environment X12) to the level of 2012: β-coefficients of the mentioned indicators increased in modulus from 0.358 to 0.714 and from 0.264 to 0.325, respectively.
In general, with the introduction of the institution of maternity capital, the regional space of Russia experienced the following transformations.
First, as noted above, fertility increases in the regions with “production” periphery, where the network of roads is poor and the services sector is underdeveloped, etc. This trend is confirmed by the disappearance from the model of the factor (X10) that reflects the competitiveness of the territory in the external market.
Secondly, there is a direct correlation between birth rate and “social” agglomeration factors. The standardized β -coefficient of the “new” population density factor (X7) is 0.672 according to the model of 2012. Furthermore, there is a drift of social infrastructure factor (Х14) from the sphere of reverse influence to the sphere of direct and stronger influence on fertility ( β -coefficient is 0.468).
Thirdly, the introduction of the institution of maternity capital had a positive impact on fertility in the regions with high level of innovation activity (X11), which is of special interest. These regions include the Magadan Oblast, where the share of enterprises that implement innovations is 24.6%, and Kamchatka Krai (23.5%). This factor has a sufficient degree of influence, because the value of the standardized coefficient β (X11) is 0.220.
This allows us to conclude that the impact of the mechanism of providing support to families under the Federal Law No. 256 introduced in 2007 was manifested in a wide range of types of mentality – from a Household Man to an Innovative Man . Regions with favorable entrepreneurial climate (X12) and infrastructure (Х8, Х9), which are intellectual and educational centers (X15), as the study has shown, are less susceptible to demographic transformations due to the introduction of the institute of maternity capital.
The growth of birth rate provided 70% of demographic change due to natural causes and more than 57% of the total growth of Russia’s population for 1995– 2012. The impact of mortality decrease was, respectively, 30% by rate of natural increase and more than 24% by total rate.
A research into demographic transformations that are connected with the natural decrease of the population was carried out by the authors on the basis of constructing a parametric model of mortality rate (Rm) according to the range of the above factor features (Х1, Х2, …, Х16).
The multifactor dependence for Russia’s regions under consideration and for the conditions of 2005 is as follows:
R 2005 = 18.171 – 0.023 х – 0.035 х m 14
+ 0.001 х 6+ 0.007 х 8 – 0.825 х 9 –
– 0.257 х 10 + + 0.254 х 12 + 0.075 х 13 +
+ 0.048 х 14 – 0.012 х 15. (3)
There is a close relationship between the factor characteristics and the resulting indicator in the model under consideration (R=0.827); the model explains 68.3% of the total variance of mortality rates across Russia’s regions in 2005. The calculated value of F-statistics (7.335) almost twice exceeds the critical value if the number of degrees of freedom is 1 and 72. Comparison of the calculated values of the quality criteria of the model (3) with critical values shows that the model can be assessed as adequate. Interpretation of the obtained dependence allows us to draw conclusions that natural population decrease is less in the regions that are centers of economic development and that have high real wages (Х1), developed service sector (X9), high level of exports per capita (X10) and accumulation of intellectual capital with a high proportion of students (X15). Such conditions shape mentality (and, as a consequence, lifestyle) of a SocioEconomic Man, who lives in agglomerations with low crime rate.
The rating of positive impact of agglomeration on reduction of mortality in Russia’s regions in 2005 was as follows: 1) β (Х15) = -0.456; 2) β (Х1) = -0.363; 3) β (Х9) = -0.251; 4) β (Х10) = -0.226.
Economic development does not only have a positive influence on life expectancy, but it also has its negative consequences, as evidenced by the values of regression coefficients of the factors Х4, Х8 and Х12 in the model (3).
First, negative impact of economic development is manifested in the increase of labor intensity. This, according to the authors, can explain the inverse relationship between the level of employment (X4) and mortality rate. Many researchers point out the relationship between nature of work and the physical state of an individual [18]. The negative impact of life in regions with a high employment rate in 2005 was strong enough, because the standardized coefficient of the factor (X4) was (-0.625). The fact that the indicator of availability of medical care (X13) does not have a positive impact on reducing mortality in the regions and has, according to the dependence (3), an opposite sign of influence, proves the inadequate performance of the healthcare system in 2005 and it is an additional argument in favor of the necessity to reform the system. A positive correlation between the factor (x14) and the resulting feature in the context of child mortality should be interpreted from the same standpoint.
Second, areas with a high level of socioeconomic development are characterized by the high density of motor roads (X8), which leads to increased mortality due to road accidents. The standardized factor coefficient (β(Х8) = 0.142) indicates a negative effect of density of roads on the dependent variable. It is no coincidence that it was necessary to develop and implement a Federal Target Program “Improvement of road traffic safety in 2006–2012”.
Thirdly, regions with a high concentration of capital and the level of life have high crime rate (X6). The significant influence of the factor ( β (X6) = 0.244) on mortality rate was caused not only by the proportion of serious crimes with fatal outcome, but also by the infliction of harm to the health of the regions’ population. In 2005, the highest growth rate in the number of crimes were registered by the following types: robbery (137%), theft (123.2%), drug trafficking (116.8%) and economic crime (116.5%). In regions where small business develops successfully (X12), there was an increased level of mortality with a high degree of influence of the factor ( β (X12) = 0.302). This situation demanded the improvement of the system of the institutions involved. The Federal Target Program “Development of judicial system of Russia” has been launched since 2007 for the purpose of crime reduction.
The multivariate dependence of mortality rate across the subjects of the Russian Federation for 2012 is as follows:
R m 2012 = 25.644 – 0.003 х 3 – 0.007 х 4 + + 0.001 х 6 – 0.002 х 7 + 0.003 х 8 – 0.487 х 9 + + 0.311 х 12 – 0.135 х 14. (4)
The obtained model with a multiple regression coefficient R=0.840 shows the close relationship between the mortality rate and factors included in the model and explainы 70.6% of the total variance of mortality rate in Russia’s regions in 2012.
Continuity in the dependence (4) with relation to the dependence (3) is ensured by the inclusion of seven factors into it: Х4, Х6, Х8, Х7, Х9, Х12and Х14. In both models there is a multidirectional influence of the regions’ socio-economic development indicators on mortality rate. This can be explained by the fact that, on the one hand, the development of the territory contributes to the formation of a lifestyle of a Man living in agglomeration centers (X7) with a high share of the services sector (Х9, Х14), which has a positive impact on life expectancy and reduces mortality rate; on the other hand, in economically prosperous regions with a developed business environment (X12) there is more crime (X6), a greater number of victims of road accidents due to high density of roads (X8), which leads to increased mortality in these areas. The negative impact of these factors on life expectancy during the study period (2005/2012) is not reduced, but even increased by a number of variables ( β (X12) = 0.302 / 0.467; β (X8) = 0.142 / 0.467, β (X6) = 0.244 / 0.244).
It should be noted that, in general for 2005–2012 the crime situation has improved: according to Rosstat, the total number of crimes has decreased by 35%. The proportion of thefts remained almost at the same level, having decreased for seven years from 44.2 to 43.1%. However, there has been an increase in the number and proportion of crimes related to drug trafficking. If in 2005, 175.2 thousand of such crimes (4.9% of the total) were registered, then in 2012 their number was 219 thousand (9.5%). The decrease in the absolute number of crimes, while maintaining the degree of their influence on reducing life expectancy indicates the inadequacy of the measures taken in relation to the pace of development of adverse trends.
Mental transformations of the demographic subsystem can be observed through the changes in the factors that determine the types of mentality, and the extent of their influence. First, the disappearance of the factors that reflect economic values (standard of living according to average wages X1 and the level of competitiveness of industries by export X10), given the emergence in the model (4) of a factor associated with an environment favorable for living (as measured by morbidity X3), indicates the change in the value orientations that define the way of life and influence mortality. The mentality of a Socio-Natural Man , who represents the values of sustainable development, is embedded into the mentality of a Socio-Economic Man . The emergence of “new features” in a transformant can be attributed to the implementation of programs that promote healthy lifestyles and favorable environment (for example, the Federal Target Program “Reduction of risks and mitigation of consequences of emergency situations of natural and manmade nature in the Russian Federation up to 2010”). The reduction of adverse effects of high labor intensity on life expectancy ( β -coefficient of the factor X4 changes from (-0.625) in 2005 to (-0.158) in 2012) is interpreted by the authors as a result of raising the level of social standards in the society.
The study of demographic transformations involves the study not only of the changes in the level of fertility and mortality, but also an assessment of their convergence. The problem of regional differences related to the heterogeneity of the socioeconomic environment of Russia’s regions is the subject of many studies [2, 3, 6]. The study shows that the set of implemented measures aimed at improving the system of institutions did not eliminate the differentiation of the rates of natural population increase across the regions, which is due to considerable differences in mentality, conditions and way of life o f people living in agglomeration centers and peripheral areas (fig. 2a, 2b) .
The positioning of regions in the “Fertility–mortality” matrix makes it possible to observe favorable demographic shifts in RF subjects during the period under analysis the shifts are visible on both determinants of natural population increase. The variation of natural population growth rate reduces from 35.8 to 29.2 persons per 1,000 population. The mean square deviation of the parameter under study decreases from 6.1 to 5.6 per mille. As for mortality rate for 2005–2012, not only its average value across Russia’s regions reduces by 16.3%, but also the variation coefficient – from 24.8 to 18.5% (to the basic values of 2005). According to the indicator of birth rate, which has increased by almost a third during the study period, the coefficient variation increases from 25.0% to 28.8%.
The study shows that demographic transformations that happened in 2005– 2012 are characterized by the following:
-
1) positive shifts that manifested in the increase in the average rate of natural population increase from -5.9 people per 1,000 population of Russia to zero;
Figure 2. Determinants of natural population growth in Russia’s regions
a) 2005
Birth rate
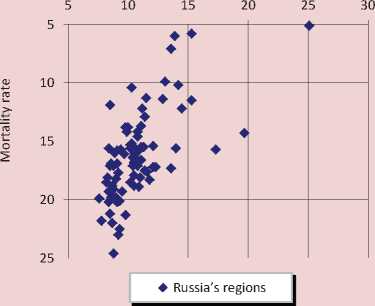
Source: Federal State Statistics Service [16].
b) 2012
Birth rate
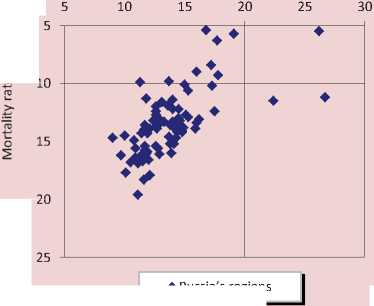
Russia’s regions
-
2) increase in the significance of fertility determinant that provided 57% of change in total population increase and 70% of change in natural population increase;
-
3) reduction in the variation of the rate of natural increase for RF subjects by 18.4%, and reduction in the standard deviation by 8.1%;
-
4) growth of regions’ differentiation by fertility , the variation coefficient of which has increased by 15.2%, and the standardized deviation has increased by 14.8%;
-
5) efficiency of introducing the institution of maternity capital from the standpoint of wide coverage of types of mentality of Russia’s population, especially characteristic of peripheral areas;
-
6) decrease in mortality and its variation coefficient by 25.4% in Russia’s regions;
-
7) increasing importance of the influence that socio-economic development of RF subjects and mentality of Man living in peri-
- pheral areas has on fertility; and increasing importance of the influence of the mentality of Man living in agglomeration centers – on mortality (including positive and negative effects).
Since modern regional policy is a complex mixture of different approaches, taking into account economic, social, demographic and other processes [1], the results obtained in the present study may be used by administrative agencies to assess more comprehensively the effectiveness of institutional transformations. In order to increase the growth rate of human capital as a criterion of successful management on the basis of self-development, it is necessary in the development of regional policy to consider not only the differentiation of socio-economic development of territories, but also the differences in mentality of the population living in large urban areas and in the periphery.
References Demographic transformations of the Russian regional space
- Artobolevskii S.S. Regional'naya politika: sotsial'naya kompensatsiya ili ekonomi-cheskoe razvitie?//Izvestiya Rossiiskoi akademii nauk. Seriya geograficheskaya. 2013. no 1, pp. 14-21.
- Gadzhiev Y.A., Akopov V.I. Sotsialno-ekonomicheskoe razvitie regionov Rossii , Ekonomika regiona , 2011, no 3, pp. 80-88.
- Gusakov M.A. Vyyavlenie napravlenii i putei transformatsii nauchno-innovatsionnogo prostranstva regionov raznogo tipa . Ekonomicheskie i sotsial'nye peremeny: fakty, tendentsii, prognoz , 2014, no 3 (33), pp. 151-168.
- Druzhinina I.V. Infrastruktura rynka truda: regional'nyi aspekt: avtoref. dis. … kand. sotsiol. nauk. . Tyumen: TGNGU, 2001. 24 p.
- Druzhinina I.V., Pavlov S.V. Problemy otsenki funktsionirovaniya rynka truda . Izvestiya vysshikh uchebnykh zavedenii. Neft' i gaz. , 1997, no 6, p. 191.
- Zubarevich N.V., Safronov S.G. Territorial'noe neravenstvo dokhodov naseleniya Rossii i drugikh krupnykh postsovetskikh stran // Regional'nye issledovaniya. 2014. no 4. pp. 100-110.
- Klassiki menedzhmenta . Ed. by M. Warner. Translated from English by U.N. Kapturevskii. Saint Petersburg: Piter, 2001. 1168 p.
- Kuklin A.A., Vasil'eva E.V. Metodicheskii podkhod k otsenke effektivnosti upravleniya sotsial'no-demograficheskimi protsessami v regione . Izvestiya of URGU , 2012, no 3 (41), pp. 79-86.
- Kurushina E.V. Rasshirenie kontseptosfery regional'nogo ekonomicheskogo razvitiya samoorganizuyushchikhsya sistem. Tyumen: TGNGU, 2014. 212 p.
- Kurushina E.V. “Umnyi” rost: institutsional'nye i mental'nye transformatsii. Ekonomika i upravlenie, 2014, no 5 (103), pp. 32-38.
- Kurushina E.V. Upravlenie chelovecheskim potentsialom na osnove motivatsionnykh faktorov. Izvestiya vysshikh uchebnykh zavedenii. // Sotsiologiya. Ekonomika. Politika. 2009. № 2. P. 11.
- Kurushina E.V., Druzhinina I.V. Transformatsiya chelovecheskogo kapitala v mental'nom prostranstve . Sovremennye problemy nauki i obrazovaniya , 2014, no 6. pp. 430.
- Obshchie itogi migratsii naseleniya Rossiiskoi Federatsii . Rosstat . Available at: http://www.gks.ru/
- Pecheritsa E.V. Organizatsionno-ekonomicheskii mekhanizm povysheniya urovnya zhizni naseleniya regiona pri lokalizatsii gostinichnykh klasterov . Tekhniko-tekhnologicheskie problemy servisa , 2014, no 1 (27), pp. 106-112.
- Regiony Rossii. Sotsial'no-ekonomicheskie pokazateli -2013 g. . Rosstat . Available at: http://www.gks.ru/
- Rozhdaemost', smertnost' i estestvennyi prirost naseleniya . Rosstat . Available at: http://www.gks.ru/
- Sovremennyi slovar' inostrannykh slov . Мoscow: Rus. yaz., 1993. -740 p.
- Tarasova O.V., Vershinina S.V. Lichnostnaya energiya kak dvizhushchaya sila innovatsionnogo razvitiya obshchestva. Nauka i biznes: puti razvitiya, 2014, no 4 (34), pp. 40-43.
- Tatarkin A.I., Timashev S.A., Kozlova O.A., Makarova M.N. Otsenka faktornogo vliyaniya na srednyuyu ozhidaemuyu prodolzhitel'nost' zhizni naseleniya munitsipal'nogo obrazovaniya (na primere g. Ekaterinburga) . Mezhdunarodnyi zhurnal prikladnykh i fundamental'nykh issledovanii , 2014, no 9-2, pp. 128-132.
- Jantsch E. Samoorganizuyushchayasya Vselennaya . Available at: http://spkurdyumov.ru/evolutionism/samoorganizuyushhayasya-vselennaya/
