Design and Implementation of Speckle Noise Reduction Algorithm Using 2D Ultrasound Image

Author: Md. Habibur Rahman, Md. Selim Hossain, Farhana Islam
Journal: International Journal of Image, Graphics and Signal Processing @ijigsp
Article in issue: 3 vol.15, 2023.
Free access
Ultrasound is mostly used for diagnosis to deal with the specific abnormality in human body. To observe the internal organs including liver, kidneys, pancreas, thyroid gland, ovaries etc. ultrasound can be used. In diagnostic applications, 2 to 18 MHz frequencies are used. The sound wave explorations occurred through soft tissue and fluids. It bounces back as echoes from denser surfaces and creates an image. While producing ultrasound images from echo signal speckle noise is induced in a multiplicative way. Thus, speckle becomes the key challenge for ultrasound imaging. Several speckle reducing linear, non-linear and anisotropic diffusion-based methods are implemented to preserve the sharp edges of ultrasound images. Those methods contain lake of smoothing and edge preservation. However, this research proposed a combined method of adaptive filter (wiener) and anisotropic diffusion (modified Perona Malik) for speckle reduction of 2D ultrasound images by retain the important anatomical features. A comparison of all the existing methods studied based on the simulated experiment. To test the methods liver, kidney, heart and pancreas noise free images are used. Then, speckle noise is manually added with distinguished variance in between 0.02 and 0.20. Quality metrics are used to test the performance and show the improvements of the proposed method. About 71.79% structure similarity (SSIM), 66.72% root mean square error (RMSE), 56.93% signal to noise ratio (SNR), and 62.30% computational time are improved on average compared with the other methods.
Ultrasound Images, Speckle Noise, Image Processing, Noise Reduction, SSIM, SNR, RMSE
Short address: https://sciup.org/15018760
IDR: 15018760 | DOI: 10.5815/ijigsp.2023.03.03
Text of the scientific article Design and Implementation of Speckle Noise Reduction Algorithm Using 2D Ultrasound Image
Image processing techniques are now used in a variety of medical areas [1]. Image DE speckling is a common phenomenon in computer vision, machine learning, and image processing. Numerous methods are existing for image de-noising. To eliminate the noise better algorithm is needed during the edge preservation [1]. The goal of image processing, in general, is to improve the quality by keeping maximum information. The developed analysis is required for the advancement of onscreen medical image reconstruction. Computer-aided diagnosis has propelled medical imaging to the forefront of scientific imaging. Without an invasive test, radiologists primarily use ultrasound, MRI, ECG, and CT-Scan to visualize the inner situation of the human body. Which makes sense about the physical condition for further medication [1]. Sound waves are used in ultrasound imaging, which is utilized by medicinal instruments due to their reasonableness, similar security, compactness, flexibility, non-obtrusiveness, and absence of radiation [2]. Then again, Ultrasound imaging proficiency and viability in therapeutic conclusion are significantly compelled because of the moderately low-quality pictures created when contrasted with different modalities. One of the significant reasons for quality debasement in ultrasound pictures is dot clamor, which emerges from diffusive dissipating and impedance. Spot clamor is a sort of granular commotion that can be found in numerous kinds of sound imaging frameworks, for example, engineered opening radar (SAR), laser-lit up, or ultrasound images [3].
Speckle noise is often modeled, for synthetic aperture radar (SAR) image, as a statistically independent random multiplicative noise [4]. It degrades the quality of image in terms of intensity resolution and smoothness. SAR likewise clouds the fundamental life structures and makes human translation and mechanized indicative capacities troublesome and conflicting. Spot commotion is the significant inadequacy of ultrasound imaging and along these lines its decrease is of incredible enthusiasm to scientists. In picture preparation, for example, highlight ultrasound image and recognition of highlights of a similar scale as the doted designs [5]. It is critical to save dot. In any case, on account of area-based location, division, and order, spot evacuation is wanted for better analysis of ultrasound picture.
The granular noise which is added with the real image during the image acquisition is termed as speckle noise. This is one kind of multiplicative noise. Speckle is a remarkable weakness of ultrasound image [6]. Thus, the reduction of speckle is essential in giving a superior medical analysis in ultrasound image. The key target of speckle reduction is to safeguarding the significant anatomical highlights of image. In this paper, we proposed a combine method for filter the speckle noise.
The ultrasound image is widely used in medical science to find out abnormalities in different parts of the human body [7]. An ultrasound image creates the ultrasound wave. Ultrasound waves passed through a human body and returned as an echo signal. Returned echo signal generates the ultrasound image. At the time of image generation speckle noise is added due to the environmental effects. This speckle-noise reduces the quality of the ultrasound image which makes it harder to identify the defect [8].
Here are very interesting parts of our research. There exist several speckle de-noising techniques for 2D ultrasound images. Sometimes these sorts of techniques are not enough to preserve the image quality. So here we are talking about a combined method of speckle de-noising. The proposed methodology performs superior to the past existing methodologies in both subjective and quantitative measures [6].
Generally, speckle noise is generated in ultrasound image during the returning of echo signal. Filtering is the main approach of de-noise the ultrasound image to increase image quality. Different kinds of filtering method exist in the sector of image de-noising. Weiner filter one of the adaptive filters is combined with Perona-Malik filter to de-noise the ultrasound image. Our proposed methodology will be helpful to reduce speckle noise in 2D ultrasound image.
This research document is enclosed with followings. The current section provides the introduction of this research. Section 2 describes the background and related work. Technical background of the research is described in section 3. Proposed research methodology is discussed in section 4. Section 5 and 6 showed the simulations and results respectively. Finally, the conclusions are determined in section 7.
2. Background and Related Work
Several methods for reducing speckles have been implemented using hardware shuffle, such as angular compounding, which reduces the pixel size on the sensor [5,8,9]. Speckle removal techniques include shifting the probe beam's focal plane and frequency compounding [10,11]. Speckle noise can typically be reduced using multi-look processing or spatial filtering. While speckle decrease by spatial filtering is usually done after the image has been acquired, multi-looking is usually done during the data acquisition stage. Gaussian smoothing is based on the linear anisotropic diffusion method, but it blurs important features such as edges, not only smoothing the noise but also making them harder to identify. When comparing finer to coarser scales Edges are also displaced by linear diffusion methods [8]. Due to the presence of noise, the nonlinear diffusion method depends upon the diffusion flux to eliminate noise and preserve maximum edges. Total variation diffusion [12], Weickert filter [13], and Perona-Malik filter [5] are used for nonlinear diffusion. Regardless of the technique used to diminish the outcome of speckle noise, the ideal speckle diminish technique preserves radiometric information, the edges between various parts, and spatial signal errancy, i.e., textural data.
Although anisotropic diffusion is well-known for its consequence for multiplicative speckle noise, it accomplished less edge conservation for images compared to stabilizer noise, [14]. The general speckle connection no longer occurs because noise differences may be greater than signal multiplicative noise variations. This limitation instigates the use of nonlinear diffusion methods for ultrasound imaging. A gradient worker is used to differentiate between signals and noise, but it is not continuously accurate. Nonlinear diffusion provides the opportunity to isolate the image from noise in US imaging [5, 12, 15]. Similarly, Lee, Frost, and Kuan's filter are used with an anisotropic diffusion technique for better progress in edge detection and speckle suppression. Smudging occurs frequently in speckle-noise with low-contrast edges [8, 14]. Another frequency-based filtering is effectively used for speckle reduction in the spatial domain. In the frequency domain, the cut-off frequency is used for filter design. However, the filter function takes time and hampers its effectiveness. Cut-off frequencies can also be generated based on a specified threshold value during preprocessing [16]. Sparsity and multi-resolution features give better performance for reducing speckle noise in Wavelet transforms. Over the couple of years, a variety of speckle-reduction methods have gained popularity and developed by utilizing a wavelet transform. As a result, wavelet transforms become the key resolver over the frequency and spatial filter. Speckle-reduction systems are competent and can meaningfully decrease speckle noise to improve image quality and resolution.
Hard and soft thresholding are two thresholding techniques that are commonly used in speckle reduction imaging in the United States. The wavelet coefficient is set to zero in hard thresholding when it became less than a threshold and remains are becoming unchanged [10]. As a result, hard thresholding is not widely used for speckle reduction in the United States [10]. Soft thresholding, a wavelet-based thresholding technique, is being extensively researched at the same time [5, 12]. The coefficients were de-noised with a soft-thresholding method that decomposed an image in the wavelet domain, as described in [10].
However, there are several deep learning methods are used to denoise the ultrasound images. Karaog˘lu et. al. [17] presented the outcome of the denoised images using five distinguished deep learning methods. Abrahim et. al. [18] tested the performances of the original noisy liver image in terms of the MSE, RMSE, SNR, PSNR and universal quality index (Q). In our research, we collect six different ultrasound images to test the performances. At the end, we have also tested the feasibility of our proposed method with more challenges data set including Brachial Plexus (BP) ultrasound images.
3. Technical Background
The elimination of noise from the original signal remains a bottleneck for scholars. There are numerous published approaches and systems, each with its own set of compensations, disadvantages, and expectations. This paper provides a review of some important work in the field of image de-noising. A brief overview of some popular methods is provided and discussed. Speckle noise is commonly found in ultrasound medical images [19].
-
3.1 Speckle Noise Model
-
3.2 Wavelet Transform
The reflection of echo signal back from ultrasound sensor adds some granular noise called speckle noise. It reduces the quality of an ultrasound image owing to the number of rudimentary scatters. Reflected echo signal generate both the destructive and constructive random interference with different phases. The resulting image is hampered in its interpretation because it is tainted by a random granular pattern known as speckle noise [11,20]. Speckle noise is represented as Eqn. 1.
I(i,j) = R(i,j) * т^м) (1)
where the observed image is I(x), a noise-free original image is R(x) and the speckle noise is η(x). We separate the multiplicative noise from the image and make it additive. The effect of additive noise is comparatively small [6]. The method additive in the logarithmic scale, a log function has taken on both sides to distinguish the noise from the actual image, which prepares in Eqn. 2.
log(I) = log(R) + log(u) (2)
The DWT is a wavelet transform process that manages a discrete number of wavelet scales and translations while maintaining some prescriptive direction. On the other hand, this transform tempers the signal into a mutually set of wavelets, which is the main distinction from the CWT (continuous wavelet transform), or its execution for discontinuous time series, which is sometimes referred to as DT-CWT (discrete-time continuous wavelet transform) [14]. A scaling function can be used to construct this wavelet's scaling features. To its distinct conversion exposures some mathematical equations on them the restriction that the scaling functions must be perpendicular which is alluded ubiquitously in Eqn. 3.
The dilation equation
Ф(х) = ^ = - лкФ^-к') (3)
Here S is scaling factor. Anyhow, the zone between functions should be normalized and scaling function must be perpendicular. Then the transformation becomes as Eqn. 4.
J—^ 0(x)0(x + l)dx = d o,t (4)
After exerting some more situations, we can discern the output from all these equations.
There are a lot of procedures for the execution of the Discrete Wavelet Transform algorithm. The majority exoteric one is known as Mallet (pyramidal) algorithm. For computing, the discrete wavelet transforms this algorithm is applied. Using DWT module DWT in 2D images can be accessed.
Anyway, despite its work first, it also had some constraints, DWT (discrete wavelet transform) can be exerted for easy and fast denoising of a noisy signal.
The Dual-Tree Complex Wavelet Transform arrives to alleviate the abridgment of Discrete Wavelet Transform.
-
3.3 Wiener Filter
-
3.4 Perona Malik Filter
Since Norbert Wiener invented it, the Wiener filter has been a very useful tool. It is one of the most widely used solutions for system identification problems and has numerous applications in a variety of fields. The Wiener filter, in essence, can estimate a reference (or desired) random process by filtering an observed noisy process that is somehow related (or correlated) to the reference signal. The filtering process is linear and time-invariant in this framework, all signals (input, reference, and noise) are considered stationary processes, and the external (additive) noise that typically corrupts the reference signal is uncorrelated with the input image in Eqn. 5. After getting the sample mean the variance is calculated using Eqn. 6.
m^^J^^^
U 2 = ^^^ДШД) - m ^ ]2
Where, M and N is the size of image, mn is the sample means of the image and ц ^ is the filtered image.
The Perona-Malik (PM) method is used in image dispensation to remove noise while conserving edges; however, this method has a significant drawback: it causes the image to look blocky. Perona and Malik proposed the nonlinear diffusion technique which is called by them anisotropic diffusion. PM is defined as Eqn. 7.
С г = ехр(-У (7)
Where, 20 >= у <= 100 and к <= 0.25
Here, C y is the filtered image. у and к respectively represents the conduction coefficient and stability.
4. Research Method
Several speckle de-noising methods limit the speckle-noise reduction which still exists in the real medical ultrasound image. The result of DE speckle images is degraded due to the difficulties of the actual identification of speckle noise. Thus, we proposed a combined filtered method for denoising the speckle noise of 2D ultrasound images in figure 1. To evaluate our proposed method the performances of relevant filtering methods are tested with the ultrasound image. Results have been validated based on the statistical measurement. Parameters have been set in table 1. Based on the comparative analysis, our proposed combined method attained better results than speckle reducing anisotropic diffusion (SRAD) and nonlinear multi-wavelet diffusion (NMWD) filters.
The quality measurement parameters are used to figure out the standardized improvement. A homogeneous area has been simulated to find out the comparative improvement of the noisy image. SSIM, RMSE, and SNR have been calculated for the detailed description of the proposed filtering method.
The pseudo code of the proposed algorithm is given in Algorithm 1.
Algorithm 1: Speckle Reduction with Weiner and PM
I = input image у = 30
к = 0.2
Start
I(M,N) ^ read image
K ^ kurtosis(I(M,N))
,(M,N) ^ I(M, N)
if K <0.95
,(M,N) ^ imnoise(I(M,N))
end if
G i (M,N)^ rgb2gray(,(M,N))
L i (M,N) ^ log(G i (M,N))
For i:1 ^ M
For j:1 ^ N m, = 1/MN * S ,(i,j)
Ц = 1/MN * S square ( ,(i,j) - m , )
у = gradient (t^)
c y = exp(- square(y/K))
end for end for
R , (M,N) = exp(c y )
End
Table 1. Parameters for experimental evaluation
|
Method |
SRAD |
NMWD |
Proposed |
|
Image Size |
512 X 512 |
512 X 512 |
512 X 512 |
|
Speckle Noise Variance |
0.02 – 0.20 |
0.02 – 0.20 |
0.02 – 0.20 |
|
Iteration Number |
3 |
3 |
3 |
|
Window Size |
3 X 3 |
3 X 3 |
3 X 3 |
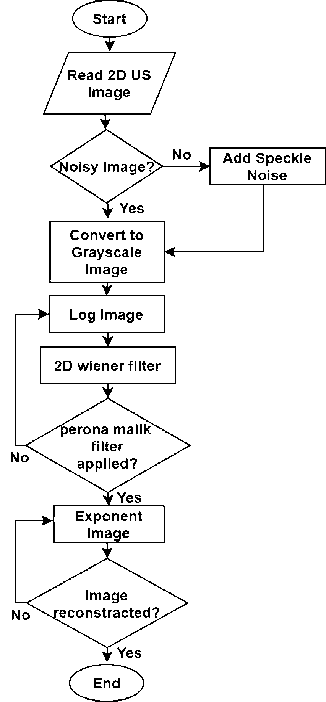
Fig. 1. Flowchart of Proposed Speckle Reduction Method
-
4.1 Noise Variance
The determination process of deviated results from a standard measure is called noise variance (σ2) [21,22]. It has been calculated by squaring the standard deviation. It determines the difference of each pixel of an image from its mean pixel value. Consequently, the summation of the squared difference of individual pixel value from the mean value is calculated. Later on, divide the result by the quartile the noise variance is estimated. The mathematical model of noise variance is defined in Eqn. 8.
2 _ I^U t -X) 2
п
Where:
-
x i is the i’th pixel value
х is the mean of all pixels
-
n is the number of quartiles
-
4.2 Structural Similarity
The similarity measurement of two different images using contrast and luminance is known as structural similarity (SSIM) [23,24]. This operation has been done on a sample window of the targeted image. Assume that, two windows x and y of two different images with common size N * N, then the SSIM is mathematically represented in Eqn. 9.
SSIM = 1 У (2 ^ Х ^ у + с 1 )(2ст ху + с 2 )
M (nx 2 +M y2 +C i )(t7x 2 +t7y 2 +C 2 )
Where:
-
µ x defines the mean of x;
-
µ y defines the mean of y;
-
o j defines the variance of x;
-
4.3 Root Mean Square Error
O y defines the variance of y;
Constant C1 and C1 remain below the value 1 and the value of M is assumed as 32 for affirming the stability [25].
The deviation of actual output from the predicted output is termed root mean square error (RMSE). In this thesis, RMSE is calculated by comparing the pixel values of the original image with the pixel values of the filtered image. To validate our proposed filtering method, RMSE has been performed as applied in [26]. The mathematical function of RMSE is defined in Eqn. 10.
RMSE = J l y "=i (y7.+y;.)2 (10)
Where:
У; defines the predicated value of у у defines the mean value of у
- 4.4 Signal to Noise Ratio 5. Design and Implementation
5.1 Simulation with Kidney Image
The ratio of signal power to noise power is termed SNR. It compares the smoothness of the desired image with the speckled noisy image [12]. For analog to digital conversion, the amplitude is quantized using the quantization technique [27]. The SNR has been calculated from the pixel value of the noisy image and the filtered image. Pmax and Pmin respectively define the maximum and minimum pixel value of the image. Hence, SNR is presented in Eqn. 11.
SNR dB = 20log iQ y’max+ Pmin) (11)
° H
Where
These results are based on the data obtained from the comparative analysis with the existing methods. Several noise-free ultrasound images are collected from the image bank [28,29,30,31,32,33]. Then speckle-noise variance from 0.02 to 0.20 has been contaminated with the images manually. Then, images are resized in 512 x 512. Simulation is iterated three times. Window size is considered as 3 x 3. SNR structural similarity (SSIM) and RMSE have been studied for performance analysis.
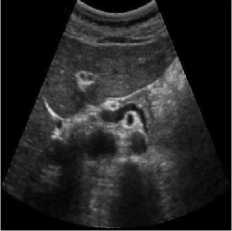
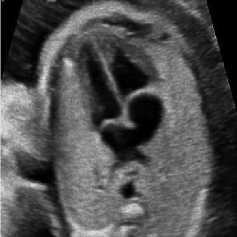
This Simulation was performed on a duplex kidney with complete duplication of ureters [28]. The original image added speckle noise with a variance of 0.04. Figure 2 depicts the visual results of SRAD, NMWD, and the proposed method. The quantitative performance results are enlisted in Table 2. In terms of SSIM, RMSE and SNR values are represented for the comparison among the existing SRAD, NMWD, and proposed methods. SSIM and computational time improved by 62.24% and 79.30% respectively in this regard. RMSE and SNR are improved by 68.53% and 66.67% respectively.
(a)
(b) (c)
(d) (e)
Fig. 2. Right sided duplex kidney image. (a) Original image, (b) Noisy image, (c) NMWD method, (d) SRAD method and (e) Proposed method
Table 2. Performance Comparison for right sided duplex kidney image
|
Method |
SSIM |
RMSE |
SNR in dB |
Computational Time in Second |
|
SRAD |
0.51321 |
16.85642 |
13.064256 |
0.965102 |
|
NMWD |
0.29635 |
9.52313 |
15.354201 |
0.0494702 |
|
Proposed |
0.83345 |
3.018621 |
25.014522 |
0.5382565 |
|
Improvement |
62.24% |
68.30% |
62.92% |
79.30% |
-
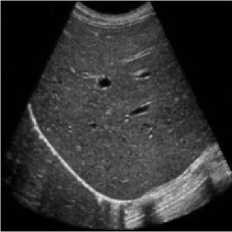
5.2 Simulation with Liver Image
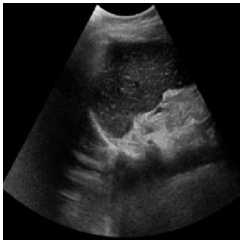
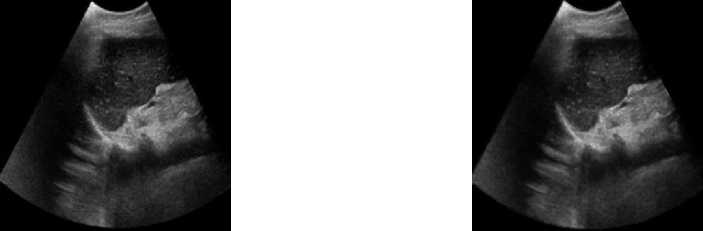
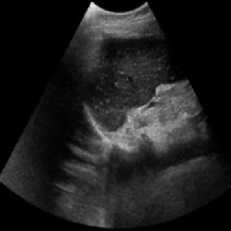
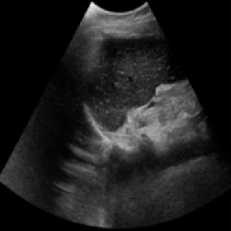
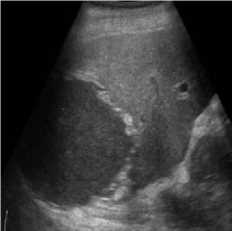
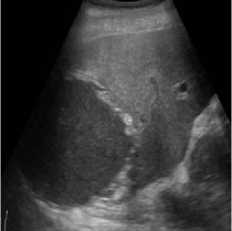
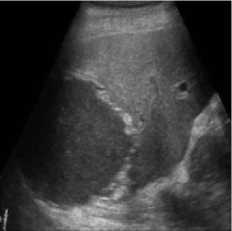
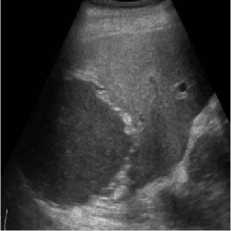
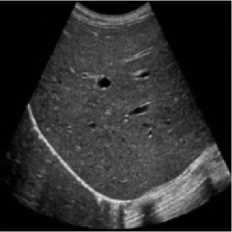
B-mode speckle-free liver echogram image was received by ultrasound scanner HS50 [29]. The original ultrasound image was added with a variance of 0.04 speckle noise. Figure 3 shows the result of the proposed method compared with SRAD and NMWD methods. Real ultrasound images can also be tested by the proposed technique. Table 3 provides the structural similarity (SSIM), root means square error (RMSE), and signal-to-noise ratio (SNR) values for the existing SRAD, NMWD, and proposed methods for the comparative result. SNR is improved at around 65.64% and the SSIM at 70.60%. Along with this the RMSE and computational time improved by 71.79% and 77.97%.
(b)
(a)
(c)
(d)
(e)
Fig. 3. B-mode liver image. (a) Original image, (b) Noisy image, (c) NMWD method, (d) SRAD method and (e) Proposed method
Table 3. Performance Comparison for B-mode liver image
|
Method |
SSIM |
RMSE |
SNR in dB |
Computational Time in Second |
|
SRAD |
0.52234 |
16.01291 |
12.82324 |
0.8645323 |
|
NMWD |
0.43720 |
9.01782 |
16.35632 |
0.0516165 |
|
Proposed |
0.89112 |
2.54391 |
27.09234 |
0.4857711 |
|
Improvement |
70.60% |
71.79% |
65.64% |
77.97% |
-
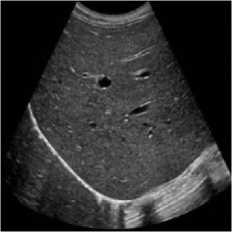
5.3 Simulation with Fatty Liver Image
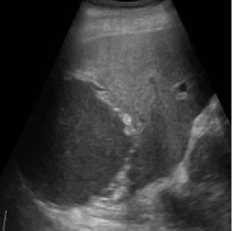
A speckle-free ultrasound image of the fatty liver was performed for this investigation. The image was taken using [30]. In this simulation, the original ultrasound image was added with a synthetic speckle-noise having a variance of 0.04. Figure 4 demonstrates the results of the proposed method, NMWD and SRAD method. The proposed method confirmed the simulation in real ultrasound images. A comparison of SSIM, RMSE, and SNR values has been given in table 4 for the existing SRAD, NMWD, and proposed method. RMSE and computational time improved by 61.21% and 68.62% respectively. SSIM and SNR are enhanced at 68.91% and 45.41% respectively.
(b)
(d)

(a)
(c)

(e)
Fig. 4. B-mode fatty liver image. (a) Original image, (b) Noisy image, (c) NMWD method, (d) SRAD method and (e) Proposed method
Table 4. Performance Comparison for B-mode fatty liver image
|
Method |
SSIM |
RMSE |
SNR in dB |
Computational Time in Second |
|
SRAD |
0.51457 |
24.15622 |
12.13573 |
1.0645575 |
|
NMWD |
0.37158 |
10.74717 |
18.56667 |
0.0441355 |
|
Proposed |
0.86917 |
3.84717 |
26.99835 |
0.3341107 |
|
Improvement |
68.91% |
64.21% |
45.41% |
68.62% |
-
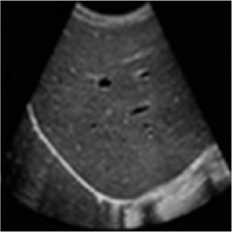
5.4 Simulation with Liver Metastases Image
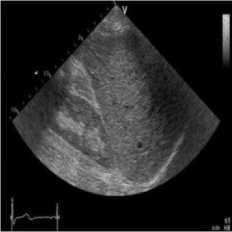
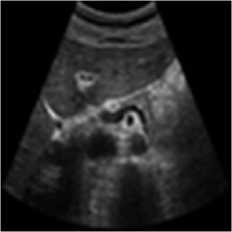
This simulation was performed on liver metastases of ultrasound image which showed a nodular appearance. Image was taken using a Toshiba Xario machine [31]. Noise variance was used 0.04 for affixing with the original image. Figure 5 shows the comparative result of existing SRAD, NMWD and the proposed method. For of comparison of SSIM, RMSE and SNR values for the SRAD, NMWD and proposed method are shown in table 5 SSIM enhanced about 86.94%, RMSE is increased 59.59%. SNR and computational time respectively improved 69.68% and 61.07%.

(b)
(d)
(a)
(c)
(e)
Fig. 5. Liver metastases image. (a) Original image, (b) Noisy image, (c) NMWD method, (d) SRAD method and (e) Proposed method
Table 5. Performance Comparison for Liver metastases image
|
Method |
SSIM |
RMSE |
SNR in dB |
Computational Time in Second |
|
SRAD |
0.46798 |
12.73795 |
17.67921 |
0.8754631 |
|
NMWD |
0.29418 |
11.74627 |
15.99835 |
0.0526379 |
|
Proposed |
0.87486 |
4.74627 |
29.99835 |
0.3408445 |
|
Improvement |
86.94% |
59.59% |
69.68% |
61.07% |
-
5.5 Simulation with Pancreas Image
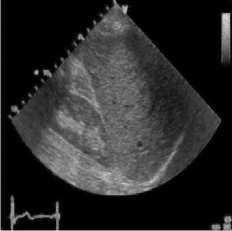
The pancreas tissue of harmonic mode ultrasound image is used in this simulation was performed on which was received by ultrasound scanner H60 [32]. In this simulation, the original ultrasound image was added with a variance of 0.04 speckle noise. Figure 6 describes the visualization of massively used techniques and our proposed method which also works in the real ultrasound image. A comparative result of structural similarity (SSIM), root mean square error
(RMSE), and signal-to-noise ratio (SNR) are enlisted in Table 6 for the existing SRAD, NMWD, and proposed methods. SSIM enhanced 71.98% at the same time computational time enhanced 41.97%. RMSE and SNR improved respectively 74.66% and 58.35%.

(b)
(d)

(a)
(c)

(e)
Fig. 6. Harmonic mode pancreas image. (a) Original image, (b) Noisy image, (c) NMWD method, (d) SRAD method and (e) Proposed method
Table 6. Performance Comparison for Harmonic mode pancreas image
|
Method |
SSIM |
RMSE |
SNR in dB |
Computational Time in Second |
|
SRAD |
0.53942 |
15.35124 |
14.89427 |
0.7965463 |
|
NMWD |
0.42499 |
10.71528 |
20.56667 |
0.0516165 |
|
Proposed |
0.92769 |
2.71528 |
32.56667 |
0.4622697 |
|
Improvement |
71.98% |
74.66% |
58.35% |
41.97% |
-
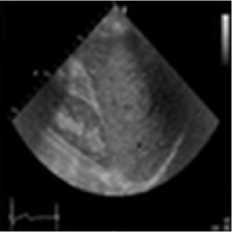
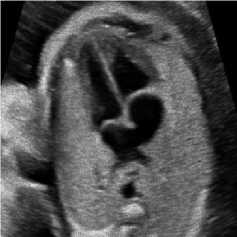
5.6 Simulation with Fetal Heart Image
For this simulation, a B-mode Ultrasound image of fetal heart echogram was received by ultrasound scanner HS60 [33]. The real ultrasound image was fixed up with simulated speckle noise. The variance was used as 0.04. Figure 7 demonstrates the visual aftereffect of the existing technique and the proposed method. In table 7 structural similarity (SSIM), root means square error (RMSE), and signal-to-noise ratio (SNR) values for the existing SRAD, NMWD, and proposed methods are enlisted for the comparison. Improvement with 70.10%, 61.76%, 45.59%, and 44.89% are achieved for SSIM, RMSE, SNR, and computational time respectively.
(b)
(d)

(a)

(c)

(e)
Fig. 7. B-mode fetal heart image. (a) Original image, (b) Noisy image, (c) NMWD method, (d) SRAD method and (e) Proposed method
Table 7. Performance Comparison for B-mode fetal heart image
|
Method |
SSIM |
RMSE |
SNR in dB |
Computational Time in Second |
|
SRAD |
0.43251 |
13.42163 |
18.24751 |
0.9136542 |
|
NMWD |
0.53185 |
9.71528 |
17.56667 |
0.0548588 |
|
Proposed |
0.90467 |
3.71528 |
26.56667 |
0.5034727 |
|
Improvement |
70.10% |
61.76% |
45.59% |
44.89% |
6. Result Analysis 6.1 Structural Similarity
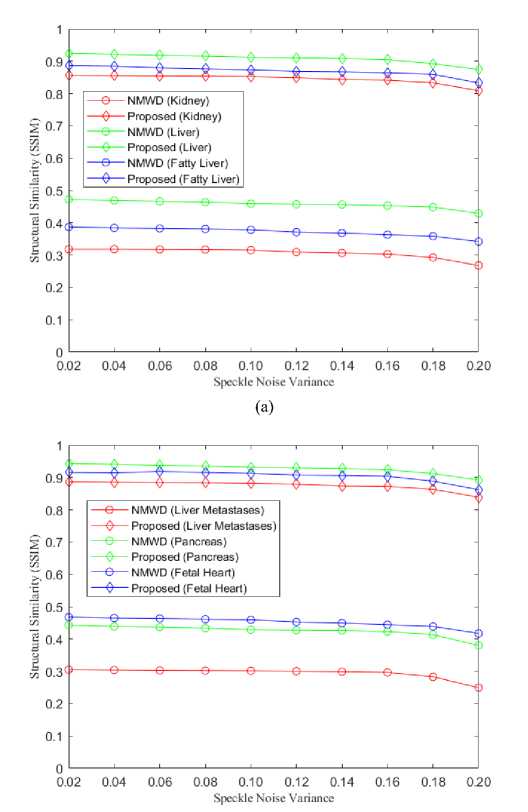
The simulation has been done for 6 different simulated images for better visualization and comparative analysis. For each mage, the structural similarity (SSIM) of the SRAD and NMWD method is lower than our proposed method. SRAD is an anisotropic filter while NMWD is a combined filter. Therefore, we showed the comparative results of our proposed method with the NMWD method in figure 8. The range of speckle-noise variance was used from 0.02 to 0.20.
(b)
Fig. 8. (a) Comparison of SSIM for kidney, liver and fatty liver images, (b) Comparison of SSIM for liver metastases, pancreas and fetal heart images
-
6.2 Root Mean Square Error
-
6.3 Signal to Noise Ratio
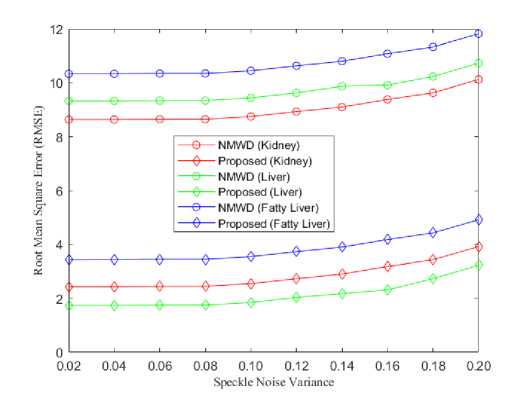
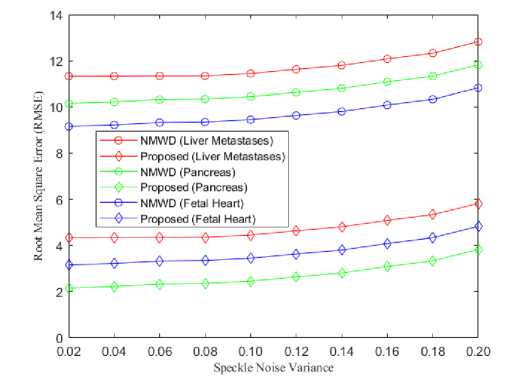
From the simulation results we got, the lowest RMSE achieved in our proposed method than SRAD and NMWD method. NMWD is a combine filtering method. Hence, the comparison of RMSE has been studied among the NMWD method and our proposed method in figure 9. The speckle noise variance is used as before.
(a)
(b)
Fig. 9. (a) Comparison of RMSE for kidney, liver and fatty liver images, (b) Comparison of RMSE for liver metastases, pancreas and fetal heart images
The tabulated results of the simulation depict that, our proposed method attains the highest SNR than NMWD and SRAD methods. Being combined methods the comparison has been shown in figure 10 for the NMWD method and the proposed method. Usually, the speckle noise variance is used within the range between 0.02 to 0.20.
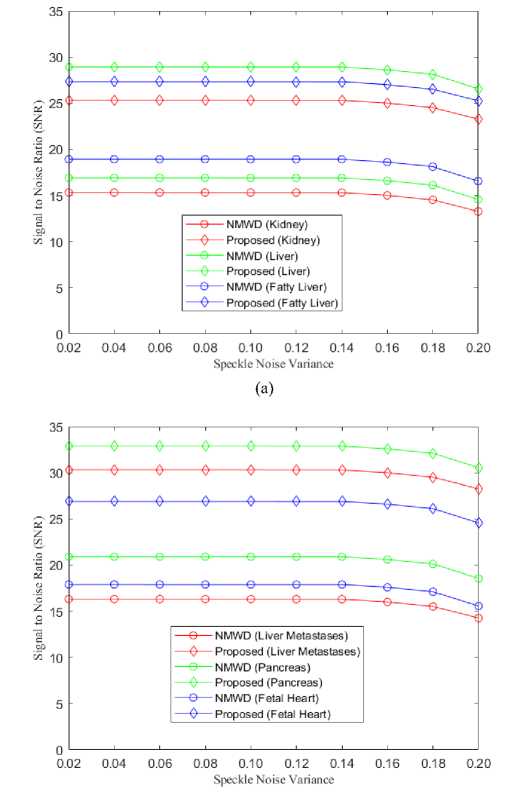
(b)
Fig. 10. (a) Comparison of SNR for kidney, liver and fatty liver images, (b) Comparison of SNR for liver metastases, pancreas and fetal heart images
(b)
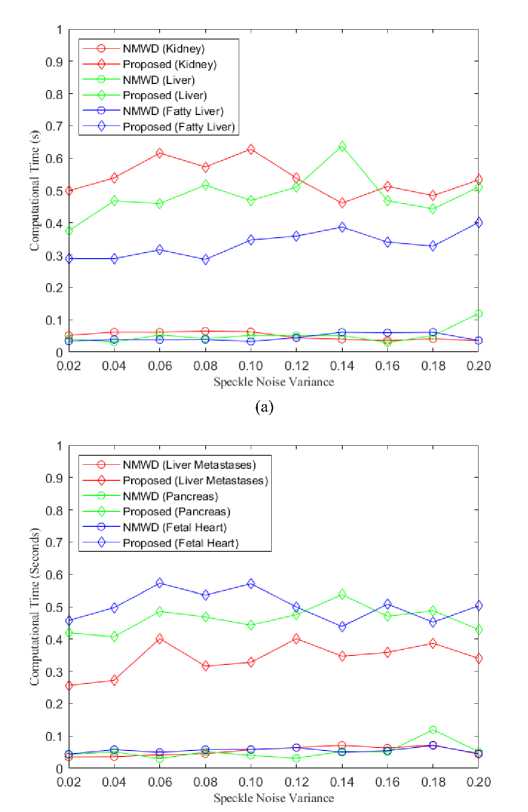
Fig. 11. (a) Comparison of Computational Time for kidney, liver and fatty liver images, (b) Comparison of Computational Time for liver metastases, pancreas and fetal heart images
6.4 Computational Time
6.5 Discussion of Simulation
6.6 Comparative Analysis
7. Conclusions
From the simulation results, we got; the lowest computational time achieved in the NMWD method. For a single filter, SRAD takes more time than both our proposed algorithm and the combined filtering method NMWD. Here, the comparison of computational time has been studied between the NMWD method and our proposed method in figure 11. The speckle noise variance is used as before.
In each figure of the above simulations, (a) and (b) are shown respectively as original image and noisy image. Similarly, the simulated results of NMWD method, SRAD method and proposed method are depicted gradually in (c), (d) and (e). Our proposed method de-noised the speckle noise and smooth image better than existing filtering methods. Despite degrading of RMSE, SNR, SSIM and computational time values our proposed method smooth’s image well and show the visual results better than NMWD and SRAD.
In table 8, we have presented the comparative analysis for four different speckle noise variances Table 8. Performance comparison with several denoising methods using nerve segmentation data in terms of structural similarity and signal to noise ratio Denoising Method SSIM SNR in dB 0.1 0.25 0.5 0.75 0.1 0.25 0.50 0.75 Noisy Image 87.6% 72.3% 69.8% 63.5% 16.21 14.25 13.06 12.10 Mean 54.2% 48.1% 43.5% 41.6% 15.89 13.85 12.78 11.45 Median 53.9% 48.8% 43.4% 41.5% 15.85 13.46 12.66 11.34 Wiener 80.7% 76.5% 70.6% 58.4% 18.25 15.11 13.20 11.06 Kuan 80.3% 75.9% 71.8% 62.2% 19.12 16.23 13.89 12.01 Frost 61.2% 55.6% 52.8% 48.6% 16.45 14.32 13.56 12.48 Lee 80.5% 76.3% 72.1% 62.4% 19.24 16.48 14.15 12.44 SRAD 52.3% 51.2% 48.5% 46.3% 14.89 13.25 12.75 12.21 NMWD 47.6% 44.8% 43.4% 42.7% 18.26 16.34 14.64 13.25 Proposed Method 92.7% 91.2% 90.4% 89.6% 32.36 27.62 25.78 24.89 Since noise is the main factor in degrading an image and makes it difficult for better visualization, this study provides a speckle reduction method for 2D ultrasound images. In this research, the adaptive wiener filter is combined with an anisotropic diffusion-based Perona-Malik filter. This combined filter significantly reduced the speckle and edge distortion artifacts. While de-noise the ultrasound image, this method preserved the sharp edges. Apart from the existing filtering method, our combined filtering method provides better visualization and smooth edge preservation. Along with this, it is easily adaptable for real ultrasound images. While filtering ultrasound images sometimes the proposed method degrades RMSE, SNR, and SSIM values. Future recommendations will be focused on getting better computational time, RMSE, SNR, and SSIM results. We are planning to implement the proposed approach in real-time clinical 2D ultrasound images in near future. Besides, 3D ultrasound images are also be considered for implementation. To evaluate the method a greater number of synthetic and real images will be tested. Disclosures The authors have no potential conflicts of interest in the paper and no other relevant financial interests to disclose. Acknowledgements This research is supported by the University Grants Commission of Bangladesh in the year of 2020-21. The authors would like to thank the faculty members of the department of Information Technology and the department of Education, Bangabandhu Sheikh Mujibur Rahman Digital University, Bangladesh for their cordial support and encouragement.
References Design and Implementation of Speckle Noise Reduction Algorithm Using 2D Ultrasound Image
- Goel Navnish, Akhilendra Yadav, and Brij Mohan Singh. “Medical image processing: A review.” in Second International Innovative Applications of Computational Intelligence on Power, Energy and Controls with their Impact on Humanity (CIPECH). IEEE, 2016.
- Uddin, Muhammad Shahin, et al. “Intelligent estimation of noise and blur variances using ANN for the restoration of ultrasound images.” Applied optics 55.31 (2016): 8905-8915.
- Uddin, Muhammad Shahin, et al. “Speckle-reduction algorithm for ultrasound images in complex wavelet domain using genetic algorithm-based mixture model.” Applied optics 55.15 (2016): 4024-4035.
- Martınez, Carlos López. “Multidimensional speckle noise, modelling and filtering related to SAR data.” Unpublished Ph. D. dissertation, Universitat Politecnica De Catalunya, Barcelona, Spain (2003).
- Yu Y, Acton ST. “Speckle reducing anisotropic diffusion.” IEEE Transactions on image processing. 2002 Nov; 11(11):1260-70.
- Uddin MS, Tahtali M, Lambert AJ, Pickering MR. “Speckle reduction for ultrasound images using nonlinear multi-scale complex wavelet diffusion.” in IEEE International Conference on Signal and Image Processing Applications 2013 Oct 8 (pp. 31-36). IEEE.
- Carovac, Aladin, Fahrudin Smajlovic, and Dzelaludin Junuzovic. “Application of ultrasound in medicine.” Acta Informatica Medica 19.3 (2011): 168.
- Bioucas-Dias, José M., and Mário AT Figueiredo. “Multiplicative noise removal using variable splitting and constrained optimization.” IEEE Transactions on Image Processing 19, no. 7 (2010): 1720-1730.
- Zaidman, Craig M.; van Alfen, Nens (2016-04-01). “Ultrasound in the Assessment of Myopathic Disorders". Journal of Clinical Neurophysiology. 33 (2): 103 111
- Y. Yue and et al., Nonlinear Multiscale Wavelet Diffusion for Speckle Suppression and Edge Enhancement in Ultrasound Images. IEEE Transactions on Medical Imaging. vol. 25, no. 3, pp. 297–311, (2006).
- Bini, A. and Bhat, M., “De speckling low SNR, low contrast ultrasound images via anisotropic level set diffusion,” Multidimensional Systems and Signal Processing, 1–25 (2012).
- D. Adam, S. Beilin-Nissan, Z. Friedman, and V. Behar, “The combined effect of spatial compounding and nonlinear filtering on the speckle reduction in ultrasound images,” Ultrasonics 44, 166–181 (2006).
- S. Mallat. “A Theory for Multiresolution Signal Decomposition: The Wavelet Representation.” IEEE Transactions on Pattern Analysis and Machine Intelligence. vol. 11, no. 7, pp. 674–693, (1989).
- A. Milkowski, Y. Li, D. Becker, and S. O. Ishrak, “Speckle reduction imaging, Technical White Paper-General Electric Health Care (Ultrasound)” Last accessed on July, Vol. 9 (2009).
- K. Z. Abd-Elmoniem, A.-B. M. Youssef, and Y. M. Kadah, “Real-time speckle reduction and coherence enhancement in ultrasound imaging via nonlinear anisotropic diffusion,” IEEE Trans. Biomed. Eng. 49, 997–1014 (2002)
- M. C. Motwani, M. C. Gadiya, R. C. Motwani, and F. C. Harris, “Survey of image denoising techniques,” in Proceedings of GSPX (2004)
- Karaoğlu, O., Bilge, H. Ş., & Uluer, İ. (2022). Removal of speckle noises from ultrasound images using five different deep learning networks. Engineering Science and Technology, an International Journal, 29, 101030.
- Abrahim, B. A., & Kadah, Y. (2011, February). Speckle noise reduction method combining total variation and wavelet shrinkage for clinical ultrasound imaging. In 2011 1st Middle East Conference on Biomedical Engineering (pp. 80-83). IEEE.
- Gupta, Kanika, and S. K. Gupta. “Image denoising techniques-a review paper.” International Journal of Innovative Technology and Exploring Engineering (IJITEE) Vol. 2(4) (2013): 6-9.
- S. Sudha, G. R. Suresh, and R. Sukanesh. “Speckle noise reduction in ultrasound images by wavelet thresholding based on weighted variance.” International Journal of Computer Theory and Engineering, pp. 1793– 8201, (2009).
- Sudha, S., Suresh, G.R. and Sukanesh, R., 2009. “Speckle noise reduction in ultrasound images using context-based adaptive wavelet thresholding.” IETE Journal of Research, 55(3), pp.135-143.
- Makovoz, D. (2006, August). “Noise variance estimation in signal processing.” in IEEE International Symposium on Signal Processing and Information Technology (pp. 364-369). IEEE.
- Wang, Zhou; Bovik, A.C.; Sheikh, H.R.; Simoncelli, E.P. (2004-04-01). “Image quality assessment: from error visibility to structural similarity.” IEEE Transactions on Image Processing. 13 (4): 600–612.
- Renieblas, G. P., Nogués, A. T., González, A. M., León, N. G., & Del Castillo, E. G. (2017). “Structural similarity index family for image quality assessment in radiological images.” Journal of Medical Imaging, 4(3), 035501.
- Finn, S., Glavin, M., & Jones, E. (2011). “Echocardiographic speckle reduction comparison.” IEEE transactions on ultrasonics, ferroelectrics, and frequency control, 58(1), 82-101.
- Finn, S., Jones, E. and Glavin, M., 2009, September. “Objective and subjective evaluations of quality for speckle reduced echocardiography.” in International Conference of the IEEE Engineering in Medicine and Biology Society (pp. 503-506). IEEE.
- Gupta, N., Swamy, M.N.S. and Plotkin, E., 2005. “Despeckling of medical ultrasound images using data and rate adaptive lossy compression.” IEEE Transactions on Medical Imaging, 24(6), pp.743-754.
- Rt. Duplex Kidney, available: https://www.ultrasound-images.com/kidneys/, accessed date: 10-03-2022
- SAMSUNG MEDISON, Liver, available: https://www.medison.ru/ultrasound/gal763.htm, accessed date: 17-04-2022
- Fatty Liver, B-mode, available: https://zenodo.org/record/1009146#.XMhhvIkzbIV, accessed date: 01-12-2021
- Liver metastases, available: https://www.ultrasound-images.com/liver/, accessed date: 20-02-2022
- SAMSUNG MEDISON, Pancreas, THI mode, available: https://www.medison.ru/ultrasound/gal635.htm, accessed date: 02-05-2022
- SAMSUNG MEDISON, Heart, Fetus, available: https://www.medison.ru/ultrasound/gal758.htm, accessed date: 10-01-2022
