Design and Optimization of Eddy Current Testing Probe Using Bees Algorithm and Finite Element Analysis

Author: H. Reza Parsa, S. AsgharGholamian, Majid Abbasi
Journal: International Journal of Modern Education and Computer Science (IJMECS) @ijmecs
Article in issue: 12 vol.5, 2013.
Free access
Eddy current testing (one of the non-destructive testing-NDT) is used to investigate heat exchanger tubes and detecting any possible faults in these tubes. Main aims of this paper determine the optimum design of a probe in order to improve sensitivity and inspection system performance. Firstly, this paper presents equations related to designing and characteristics of the probe to investigate sample tubes. Then, optimum design is presented in order to reach the highest signal to noise ratio (SNR) and sensitivity (S) using Bees Algorithm-BA. Finally, eddy current testing is performed for optimum probe using finite element analysis (FEA).
Eddy current testing, Heat exchanger tubes, Bees algorithm (BA), Finite element analysis (FEA)
Short address: https://sciup.org/15014612
IDR: 15014612
Text of the scientific article Design and Optimization of Eddy Current Testing Probe Using Bees Algorithm and Finite Element Analysis
Published Online December 2013 in MECS DOI: 10.5815/ijmecs.2013.12.06
Non-destructive testing is the use of physical methods, which will test materials, components and assemblies for defects in their structure without damaging their future usefulness. NDT is concerned with revealing defects in the structure of a product [1].
Eddy current testing (ECT) is one of several nondestructive testing methods that use the principle of electromagnetism for inspection of conductive materials [2]. Eddy currents are created through a process called electromagnetic induction. In ECT, the coil is excited by an alternating current source. Since the coil is carrying an alternating current, an alternating magnetic field is created in and around the coil in accordance with Maxwell-Ampere Law. When the probe is moved along the test specimen (non-ferromagnetic tube), the time varying field causes an electromotive force (emf ) to be induced in the tube in accordance with MaxwellFaraday Law[2]. The emf causes currents to flow in the tube. These currents (eddy-currents) follow closed circulatory patterns. The induced current, in turn, generates a field (induced or secondary field), that its direction is opposite to that of the primary field established by the coil, according to the Lenz's Law [3].
-
II . DESIGN EQUATIONS
Eddy current testing has different applications in industry. One of the major applications of eddy current testing is tube inspection using internal probes. The testing is carried out to investigate heat exchanger tubes and detecting any possible faults at the inside and outside surfaces. Eddy current is usually used for conductive and non-ferromagnetic tubes. Heat exchangers are used in different industries, including, power stations, oil refineries, petrochemical plants, and air conditioning and refrigeration units. Eddy current testing probes contain one or more coils, a core and etc.
Figure 1 shows a cross-sectional view of probe inside the tube. The probe has one coil in this paper. The values of constant parameters such as resistivity of wire, diameter of wire, amplitude of input current and etc are presented in Table 1 and other parameters of this table will be specified after optimization.
Based on Faraday’s Law, applying an alternating current to the coil, an alternating voltage will be induced in the coil terminals in accordance with following relation [2]:
v= . Р-С .п.А . (1)
Where µ is called resultant permeability of the core that can be much lower than relative permeability µr.
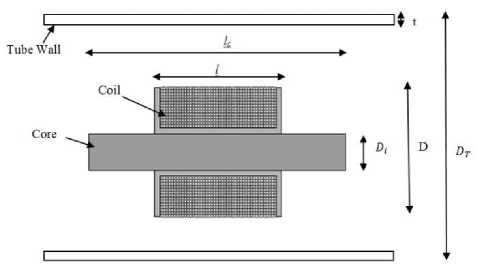
Figure1. A cross-sectional view of probe inside the tube
TABLE 1. Main parameters of ECT probe.
|
Symbol |
Parameter |
Unit (value) |
|
V |
Induced voltage in probe |
V |
|
f |
Frequency |
Hz |
|
d |
Diameter of wire |
0.4 mm |
|
A o |
Permeability |
4π×10-7 H.mm-1 |
|
n |
Number of turns |
turns |
|
A. |
Relative permeability of core |
700 |
|
I |
Amplitude of input current |
0.01 A |
|
H |
Magnetic field |
A.turns/mm |
|
A |
Cross section |
mm2 |
|
k |
Packing factor |
0.8 |
|
D |
Coil diameter |
mm |
|
Di |
Core diameter |
mm |
|
l |
Coil length |
mm |
|
l c |
Core length |
mm |
|
P |
Resistivity (copper wire) |
1.724×10⁻⁵ Ω.mm |
|
p T |
Resistivity (stainless steel tube) |
90.91 µΩ.cm |
|
pT |
Resistivity (copper tube) |
1.724 µΩ.cm |
|
T |
Room temperature |
298 K0 |
|
k B |
Boltzmann factor |
1.38×10⁻²³ WsK-1 |
The number of turns depends on the diameter of the wire d that is used, the packing factor k and the dimensions of the coil [4]
.( )
.
The magnetic field can be defined using MaxwellAmpere Law in equation (7)
= .
lc
The resolution of the probe performance is limited by thermal noise, V T , which depends on the resistance R of the coil, the temperature T, the frequency bandwidth A f with coefficient equal to the Boltzmann factor [4]
V = 27 kB T . A f . R
The resistance of the coil is shown in equation [6].
R = p l ( D - D , ).( D + D i )
Using equations (2)-(9), signal to noise ratio, SNR, can be expressed as
V
SNR =-
V T
10 lo. n 3
f

16 . VA f " k 2. d 2. V kB T P
1 +
A r
2 n . D, 2 .( a
l c 2
I
.
- 1) l c
The resultant permeability of the core depends on the demagnetizing factor N [4].
=
.()
1441221The demagnetizing factor N for a cylindrical core depends on the core length l c and core diameter D c according to following equation [5].
= .
Lc
In equation (1), A is the cross section of area that the magnetic flux passes through the coil. This area is assumed a circle which its diameter is equal to the average of core and coil diameters. Therefore,
= .( + ) (4)
Since the input current is a sine wave with amplitude I and frequency f, the magnetic field is also a sine wave with amplitude H and same frequency. Regarding these assumptions, equation (1) is rewritten as follow:
= . . . . .( + ) (5)
The other function in eddy current testing is sensitivity that can be expressed in following equation
S = V = 10 13. n3 . J\l . Г ( D _ D ).( D + D ) 2 n
H 4 k. d2 L i i J x_______Ar________ (11)
2 n . D , 2.( a. - 1)
l c
The optimum frequency is applied in equations (10) and (11) in order to improve system performance. This frequency depends on thickness and resistivity of specimen tube and is determined as [1]
. .
f =
Where,ρTand tare resistivity and thickness of the tube, respectively.
-
III. OPTIMIZATION PROCEDURE
-
A. Bees Algorithm
Bees Algorithm (BA) is a newly introduced metaheuristic and swarm-based optimization algorithm which can be efficiently used in solving complex and multimodal optimization problems. Bees Algorithm, proposed by Pham et al in 2005, mimics the food foraging
behavior of swarms of honey bees in order to find the optimal solution to a given optimization problem [7].
In this paper, the BA proposed by Pham et al. is used for optimizing the combination of SNR and S functions and obtaining the optimum parameters of probe.
The algorithm requires a number of parameters to be set, namely: number of scout bees (n), number of sites selected out of n visited sites (m), number of best sites out of m selected sites (e), number of bees recruited for best elite sites (nre), number of bees recruited for the other (m-e) selected sites (nsb), initial size of patches (ngh) which includes site and its neighbourhood and stopping criterion[8-10]. The algorithm starts optimization process by randomly placing the n scout bees in the search space. The fitness values of the sites visited by the assigned scout bees are determined in step 2.
The bees with the highest fitness values are selected as "elite bees" in step 4. Then, in step 5-7, the algorithm conducts several searches around sites visited by elite bees and other selected bees. The fitness values may alternatively be used to calculate the probability of the bees being selected. The algorithm recruit more bees to follow the elite bees rather than other bees in order to search around the sites visited by the elite bees more accurately. Differential recruitment within scouting is also a significant operation of the BA. Both scouting and differential recruitment are utilized in nature.
In step 7, however, only one single bee with the highest fitness value will be selected to form the next bee population. This restriction is added to the algorithm to reduce the number of points to be visited. The remaining bees are randomly assigned around the search space in step 8 to explore new potential solutions. These steps are repeated until the termination condition is met. The representatives from each selected site and other scout bees assigned to perform random searches are two parts of the colony to its new population at the end of each iteration.
-
B. Design of Experiment
In this section, the BA algorithm is used to optimize the combination of SNR and S functions which should be maximized. Since in ECT, SNR function is more important than S function, it has more weight in objective function. The objective function is defined as
OF = (2)0.8 SNR + 0.2 S (13)
In objective function, values of SNR and S should be in same range, so the coefficient 2 = 10 - 9 is applied to SNR function in order to optimization is meaningful for two functions. The optimization is performed for a copper tube sample and a stainless steel tube sample. Values related to dimensions of tubes, optimum frequency and frequency bandwidth are presented in Table 2. Table 3 shows the values of the parameters adopted for the BA. These values were chosen heuristically and verified empirically.
TABLE 2 . Design parameters of probe for tubes inspection
|
Design parameters |
Value (Copper Tube) |
Value (Stainless Steel Tube) |
|
Optimum frequency ( f 90 ) |
1.325 kHz |
70 kHz |
|
Outer diameter of the tube (DT) |
53 mm |
26 mm |
|
Tube thickness (t) |
2 mm |
2 mm |
|
Frequency bandwidth ( ^ f ) |
9000 Hz |
100000 Hz |
TABLE 3 . The parameters of Bees Algorithm
|
Parameters of Bees Algorithm |
Symbol |
Value/Range |
|
Population |
n |
80 |
|
Number of selected sites |
m |
60 |
|
Number of elite sites |
e |
40 |
|
Patch size |
ngh |
0.001 |
|
Number of bees recruited for elite sites |
nre |
70 |
|
Number of bees recruited for other selected sites |
nsb |
30 |
|
Number of iterations |
itr |
500 |
-
IV. Optimization Results
-
A. Probe optimization for inspection of a copper tube sample
In this case, a copper tube is selected according to parameters of Table 2. There are some limitations for dimensions and properties of probe regarding dimensions of tube and after those optimum dimensions of the probe are determined using optimization algorithm. Probe limitations for this case of optimization are shown in Table 4.
TABLE 4.Probe limitations for inspection of a copper tube
|
Parameter |
Limits |
||
|
Name |
Dimension |
min |
max |
|
D |
mm |
44 |
46 |
|
l |
mm |
10 |
20 |
|
Di m1 = D |
- |
0.25 |
0.5 |
|
lc m 2 i |
- |
6 |
16 |
|
lc m 3 = Di |
- |
7 |
- |
|
n |
turns |
800 |
1000 |
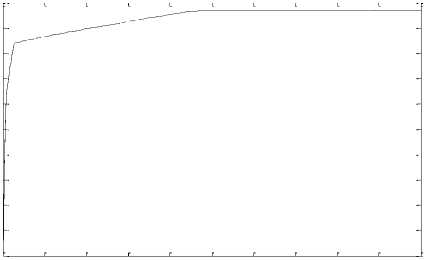
Figures 2 and 3 show the diagrams of SNR and S in terms of iteration, respectively. The diagram of objective function (OF) is shown in Figure 4.
The optimum parameters of probe obtained from BA for both of sample tubes inspection are presented in Table 5.
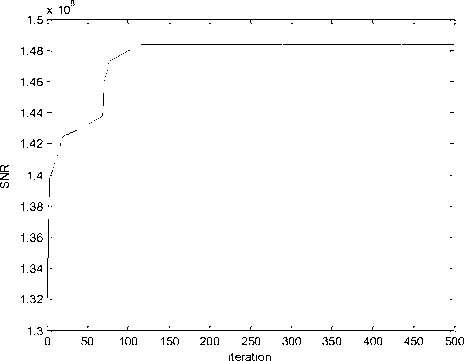
Figure2. Diagram of SNR in terms of iteration
0.0955
0.095
0.0945
0.094
0.0935
0.093
0.0925
TABLE 5. Optimum parameters of probe
|
Parameters |
Value (Copper tube) |
Value (Stainless steel tube) |
|
D |
44 |
19 |
|
m 1 |
0.4182 |
0.25 |
|
l |
10 |
17.9649 |
|
m 2 |
16 |
12 |
|
n |
1000 |
1000 |
|
m 3 |
8.6957 |
45.3850 |
|
SNR |
1.4839e+008 |
7.3723e+009 |
|
S |
0.0947 |
13.6797 |
|
OF |
0.1377 |
8.6340 |
-
B. Probe optimization for inspection of a stainless steel tube sample
7.4
0.092 0
In this section, a stainless steel tube is selected according to parameters of Table 2. Probe limitations for this case of optimization are shown in Table 6.
Figures 5 and 6 show the diagrams of SNR and S in terms of iteration, respectively. The diagram of objective function (OF) is shown in Figure7.
TABLE 6. Probe limitations for inspection of a stainless steel tube
|
Parameter |
Limits |
||
|
Name |
Dimension |
min |
max |
|
D |
mm |
19 |
21 |
|
l |
mm |
10 |
20 |
|
D m 1 = D i |
- |
0.25 |
0.5 |
|
lc m 2 = l |
- |
6 |
12 |
|
lc m 3 = Di |
- |
10 |
- |
|
n |
turns |
800 |
1000 |
9 x 10⁹
50 100 150 200 250 300 350 400 450 500
7.35
0.1385
0.138
Q 0.136
iteration
Figure3. Diagram of S in terms of iteration
7.3

7.25
7.2
0.1375
0.137
0.1365
7.15
7.1
7.05 0
150 200 250 300 350 400 450 500
iteration
0.1355
Figure5. Diagram of SNR in terms of iteration
0.135
0.1345
0.134
0.1335 0
50 100 150 200 250 300 350 400 450 500
iteration
Figure4. Diagram of objective function (OF) in terms of iteration
-
V . FINITE ELEMENT ANALYSIS FOR OPTIMUM PROBE
13.7
13.6
13.5
13.4
13.3
13.2
13.1
12.9
12.8
12.7
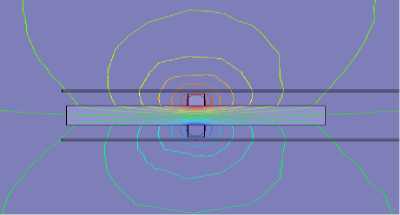
The optimum probe is simulated for two sample tubes using finite element analysis (FEA) and MAXWELL 2D software. In heat exchanger tubes inspection, probe is moved along the tube and its impedance is determined.
The presence of a flaw in tube varies the probe impedance. In simulation, the probe excitation is a sine wave current of 10 mA with optimum frequency. The induction voltage in probe is determined using MAXWELL 2D software. The probe impedance is presented as a complex number Z= R + jX where, R is the resistance and X the reactance. The probe impedance is determined and compared in air, unflawed region and deficient region. The sample flaw is assumed a through-wall hole of 10mm diameter. Figures 8, 9 and 10 show the voltage and current curves in three positions, air, deficient and unflawed region for a sample copper tube inspection, respectively.
The impedance amplitude is equal to ratio of voltage amplitude to current amplitude. The difference between voltage and current phases is defined as impedance phase. The resistance and reactance of probe impedance in three positions for a sample copper tube inspection is presented in Table 7.
0 50 100 150 200 250 300 350 400 450 500
iteration
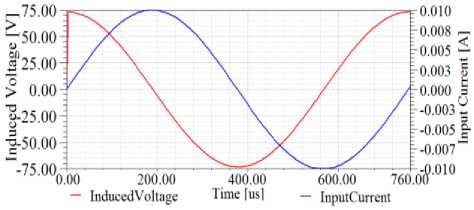
Figure9. Voltage and current curves in the deficient region of the tube
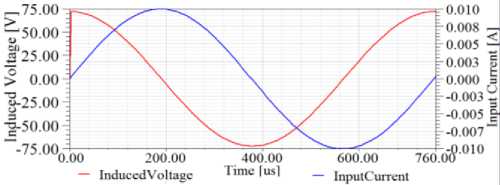
Figure10. Voltage and current curves in the unflawed region of the tube
TABLE 7. Resistance and reactance of probe impedance in different positions (copper tube).
|
Probe position |
R (ohm) |
X (ohm) |
|
Air |
129.7 |
7430.6 |
|
Deficient region |
255.5 |
7316.1 |
|
Unflawed region |
377.7 |
7206.8 |
The magnetic flux lines around the probe are shown in figure 11 using finite element methods (FEM).
Figure6. Diagram of S in terms of iteration
8.65
8.6
8.55
8.5
8.45
8.4
8.35
8.3
8.25
8.2
0 50 100 150 200 250 300 350 400 450 500
iteration
8.15
Figure7. Diagram of objective function (OF) in terms of iteration
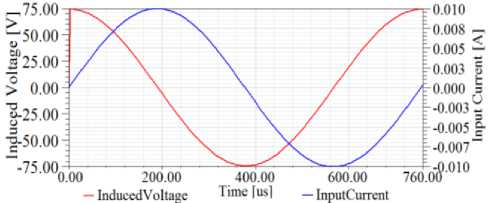
Figure8. Voltage and current curves in air (copper tube inspection)
Figures 12, 13 and 14 show the voltage and current curves in three positions, air, deficient and unflawed region for a sample stainless steel tube inspection, respectively.
The resistance and reactance of probe impedance in three positions for this case is presented in Table 8. Figures15 and 16 shows the impedance trajectory of the probe over two sample tubes. The impedance values in three positions, air (A), deficient region (D) and unflawed region (U) are illustrated in these figures.
The simulation results show that the resistance and reactance values of the probe in air are more than other positions and when the probe is inserted into the tube (unflawed region), the resistance and reactance of the probe decrease significantly.
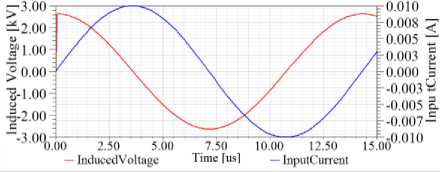
Figure12. Voltage and current curves in air (stainless steel tube inspection)
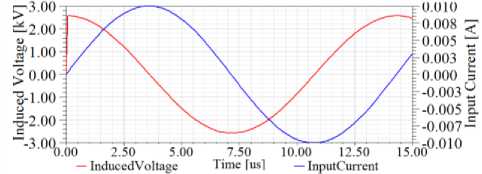
Figure13. Voltage and current curves in the deficient region of the stainless steel tube
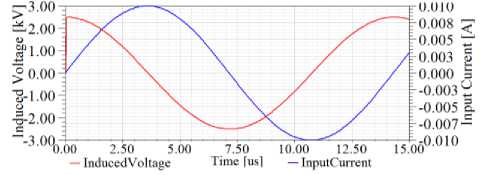
Figure14. Voltage and current curves in the unflawed region of the stainless steel tube
TABLE 8. Resistance and reactance of probe impedance in different positions (stainless steel tube)
|
Probe position |
R (ohm) |
X (ohm) |
|
Air |
1836.7 |
263085.2 |
|
Deficient region |
5839.5 |
257325 |
|
Unflawed region |
8733.3 |
250087.6 |
The probe is moved along the tube and its impedance is determined using software and compared with probe impedance in unflawed region. The reactance and resistance of probe in air and unflawed region are supposed reference values. Figure17 and 18 shows that the impedance components of the probe in deficient regions are in the middle of the reference values.
Due to optimization, the effect of noise decreased and sensitivity increased so the presence of sample flaw (through-wall hole of 10mm diameter) in tube changed the probe impedance significantly andthe deficient region was detected well. Detection of sample flaw shows that the probe can detect small flaws well and its performance was improved using BA algorithm. This probe can also detect other defects of the tube such as cracks, dents and etc.For detection different types of flaw in the tube, the probe impedance is determined and compared with reference values. Due to high sensitivity of probe, the probe can sense small variations of impedance and so different types of small flaws are detected well.
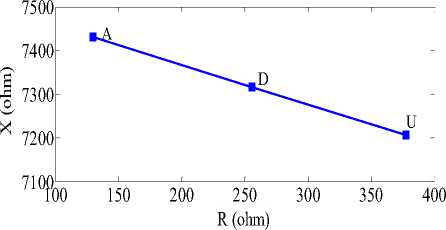
Figure15. Impedance plane trajectory of the probe over the sample copper tube
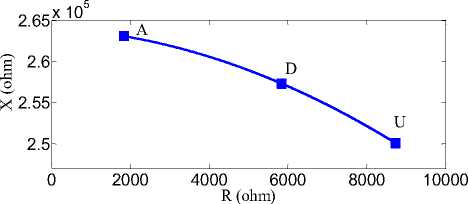
Figure16. Impedance plane trajectory of the probe over the sample stainless steel tube
-
VI. CONCLUSION
Heat exchanger tubes inspection is very important because these tubes must be prevented from leaking. The inspection of these tubes is carried out using eddy current testing probes. These probes should be very sensitive to small flaws and have high SNR. So,eddy current testing probe optimization was carried out using BA in order to inspection of two sample tubes.
The highest values for combination of SNR and S functions were determined according the probe limitations. Finally, eddy current testing is performed for optimum probe using finite element analysis (FEA).
The effect of noise decreased in tube inspection and the sensitivity of the probe increased using BA. Simulation results and impedance plane trajectory for different positions of probe demonstrated that the difference between impedance components in air, deficient region and unflawed region was significant and optimum probe detected the flaw in tubes well.
The BA improve the probe performance and sothis optimum probe is sensitive to different types of small flaws and can be used in industry for heat exchanger tubes inspection. High sensitivity probes can be also designed for heat exchanger tubes with different dimensions using BA.
References Design and Optimization of Eddy Current Testing Probe Using Bees Algorithm and Finite Element Analysis
- INTERNATIONAL ATOMIC ENERGY AGENCY, "Eddy Current Testing at Level 2, Manual for the syllabi contained in IAEA-TECDOC-628.Rev2", Training Course Series No. 48, IAEA, Vienna, 2011.
- PengXu, "Eddy current testing probe composed of double uneven step distributing coils for crack detection",Published PHD thesis, Sega University, China, 2008.
- P. Xiang, "Automatic multi-frequency rotating-probe eddy current data analysis", Published PHD thesis, Iowa State University, USA, 2005.
- S. Tumanski, "Induction coil sensors-a review", Meas Sci. Technol, Vol. 18, pp. R31– R46, 2007.
- C. L. B. Shuddemagen,"The magnetizing factors for cylindrical iron rods. Proceedings of the American Academy of Arts and Sciences", Vol. 43, No. 6 ,pp. 185-256, 1907.
- W. Richter, "Induction magnetometer for biomagnetic fields". Exp. Technic Phys, Vol. 27, pp. 235-243.
- D.T. Pham, A. Ghanbarzadeh, E. Ko?, S. Otri, S. Rahim, M. Zaidi, "The Bees Algorithm – A Novel Tool for Complex Optimization Problems, Manufacturing Engineering Centre", Cardiff University, Cardiff CF24 3AA, UK.
- K.V. Frisch,"Bees: Their Vision, Chemical Senses and Language", Cornell University Press, N.Y., Ithaca, 1976.
- TD. Seeley,The Wisdom of the Hive: "The Social Physiology of Honey Bee Colonies", Massachusetts: Harvard University Press, Cambridge, 1996.
- E. Bonabeau, M. Dorigo, G. Theraulaz, "Swarm Intelligence: from Natural to Artificial Systems", Oxford University Press, New York, 1999.
