Designing A Digital Multimedia Interactive Book for Industrial Metrology Measurement Learning

Author: Marsono, Mingchang Wu
Journal: International Journal of Modern Education and Computer Science (IJMECS) @ijmecs
Article in issue: 5 vol.8, 2016.
Free access
This research aims to develop a digital multimedia interactive book for supporting the learning of industrial metrology and to examine the worthiness/value of the produced digital multimedia interactive book. It employs the approach of research and development. The design of the digital multimedia interactive book is implemented in some development stages: (1) material data collection, (2) planning, (3) making a prototype, (4) pilot test with respondents of multimedia experts and experts of industrial metrology, (5) improvement of the prototype, (6) application to students, (7) improvement of the final product. The final product of this research is a software multimedia digital interactive book which can be used to help students learn industrial metrology measurement. With this software, students can learn about industrial metrology whenever and wherever they are. Therefore, it can improve their competency, especially in the measurement.
Multimedia, Digital Interactive Book, Industrial Metrology, Learning
Short address: https://sciup.org/15014865
IDR: 15014865
Text of the scientific article Designing A Digital Multimedia Interactive Book for Industrial Metrology Measurement Learning
Published Online May 2016 in MECS
The development of computer has contributed significantly to education, which encourages its uses in the education field. One of the uses is computer as instructional media, because the commonly learning process is still conventional, which cannot effectively attract students’ attention.
The existence of computer has integrated various media in one form of learning, that is computer-assisted instructions (CAI) have been widely used in modern education, such as instructional method design, course content delivery, and e-learning [1]. Various computerbased learning models have been developed in accordance with the development of computer technology, such as computer assisted learning (CAL), computer based training / learning (CBT/L), multimedia-based learning (MBL), web-based training/learning (WBT/L), and reviews on online learning and e-learning. Basically, the various uses/terms are based on one concept, that is the utilization of computer technology as the basis of multimedia technology for the development of teaching media models [2].
Paltimer [3] compared calculus learning with computer to conventional learning. He found that the result of the computer-based learning is better than conventional learning. However, not all learning activities must be done with an ICT-based approach. Some activities should be implemented using the conventional approach.
The materials of industrial metrology consist of theories and practices. The theories and practices are integrated and supplementing each other. In the learning process, the theories and practices are given separately. The learning of industrial metrology should make use of many teaching/learning media, because it emphasizes the psychomotor and cognitive abilities of students.
To address such an aspect, learning media which cover students’ learning needs and give more learning experience are needed. Interactive learning media in the forms of texts, visuals, and simulations can help students obtain more knowledge, more understandings of concepts and applications of the obtained knowledge. Dynamic interactive learning media are used in the learning process because they have the ability to explain complex materials/contents. They can be arranged so that students autonomously learn the materials. Theories, practices, authentic materials in the forms of texts and visuals included in the media, so that students get real learning experience.
Interactive learning media can be used wherever and whenever without the presence of lecturers. Thus, it is expected that the media eliminate the barriers of learning often experienced by lecturers and students, especially in the process of learning in classrooms and in autonomous learning.
-
II. Related Works
-
A. The Definition and Advantage of using Multimedia
In the taxonomy of educational technology, learning multimedia can be defined as the integration of various multimedia instruments/tools which are used for presentation. In the 90s, the concept of multimedia development into the integration of more than one media, texts, graphics, sounds, videos, and animations, where students can control the delivery of various multimedia elements [4].
Multimedia are instruments that can create dynamic and interactive presentations which combine texts, graphics, animations, audios and videos. Specifically, multimedia refers to the use of computers to make and integrate texts, audio graphics, moving animations and videos by using link tools which enable users to navigate, interact, create and communicate [5]. According to [6], multimedia have a purpose to present information in ways that are fun, interesting, understandable, and clear. Information will be easily received because many senses are used, especially intelligences of hearing and sight. Previous studies have confirmed that there was computerbased education has generally had a positive effect on the academic achievements [7, 8].
Agnew [9] implicitly state multimedia as “[a] disk, unlike a shoe box, gives students instant access to any desired contents, with instant access, students can organize the information that they create for the project by linking together related pieces of information. In fact, to qualify as true multimedia, a project must not only use several of the five media, however must also use links to be interactive”.
-
B. Learning
Dominic and Francis [10] noticed that “learning is a two phase process that involves reception and processing of the information received. Reception involves the various senses to gather information from external sources, whereas the processing involves internal activity like memorization, induction, deduction, introspection, reflection”.
Rajendran and Veilumuthu [11] argued that every student has a learning style and it’s their own way to which learners perceive and process information. There are three groups of learning styles, including: visual learners gain knowledge through visual inputs, auditory learners learn through listening, and kinesthetic learners learn through experiments and exploration [12].
Table 1. Sarasin Model Learning Style
-
C. The Elements of Multimedia
The term ‘multimedia’ derives from two words, ‘multi’ which means more than one and ‘media’ which means communication instrument/tool. Studding several models and approach to the learner, [13] argued that a combination between several methods were needed that will help for a complete modeling. Consequently, multimedia can be understood as communication instruments/tools using various media. The media can include pictures, sounds, animations, and texts [14].
-
1) Texts
Texts are an important part of multimedia, because they are media which can deliver information and help to complete information needed by users which cannot be delivered only by using images. By integrating images, animations, texts, videos, and sounds, interactive and communicative information will be obtained.
-
2) Sounds
In multimedia information technology, soundcard plays a very important role in the design of a multimedia application. By using soundcard, computers can convert analog sound data to digital sound data saved to sound files. Some standard formats of sound files include wave for audio, musical instrument digital interface (midi), and MP3.
-
3) Graphics
Graphics are often used as backgrounds for texts, providing frames to the texts. They can also be used as icons. Integrated with texts, the icons can show options which can be selected [5].
-
4) Images
Basically, image formats in interactive learning multimedia can be represented into two types: bitmap and vector. Vector images are not stored in the vector forms, but in the forms of the instructions mentioned as algorithms, which determine the forms of curves, graphics, and various shapes. One of the advantages of vector images is that they are scalable; they can be used for further editing, either for enlarging or shrinking without changing the color or resolution.
On the other hand, bitmap images are reconstructions of the real images. Bitmap images are stored in dots on a computer screen. The whole pictures are represented as pixels. The weakness of bitmap images is that we cannot perform editing as the images depend on the actual images and the resolution cannot be enlarged.
The difference between the two formats is that bitmap files contain RGB color information in every pixel, while vector files do not contain RGB color information. In bitmap files, the color variation can be directly observed. However, the more color information the files have, the bigger the memory byte is needed for storing the bitmap files.
-
5) Clip Art
Making graphics by hands will be tiring and needs much time. To save the time, there are many clip art graphics available, which can be used for the multimedia. In the clip art graphics, there are many images available, such as photos, animations, icons, buttons, and lines [5].
-
6) Animations
Animations are the changes from one picture to other pictures, which produce certain movements. Animations reflect the art of graphics which imitate movements and contain sounds/voices. There are two types of animations: case based and frame based.
Case based animations are also called object animations, which refers to the form of animations in which every object is an independent element having an arrangement of pictures, sizes, colors, and speeds. Animations are determined by the placements and movements of objects in every animation frame. On the other hand, frame based animations refer to layers or frames shown in a sequence speed. The changes of frames, from one frame to another, will produce animations. Each frame can be formed into a unique shape, because the changes are shown as real images which can be seen within certain periods [14].
-
D. Multimedia development
There are four basic stages in developing instructional multimedia, including: planning, instructional design, prototype, and test [15].
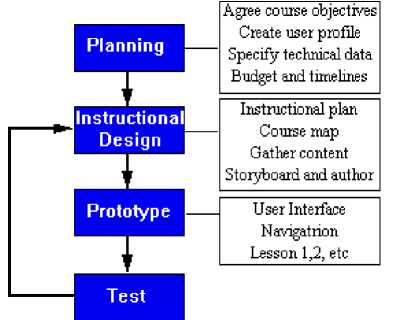
Fig.1. Newby instructional media development
Studied from previous research, Hadi [16] noted six phases of developing multimedia, namely: concept, design, material collecting, assembly, testing, and distribution.
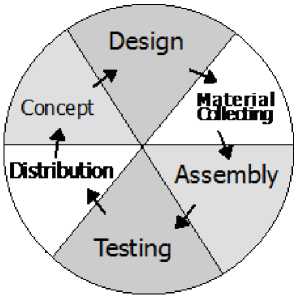
Fig.2. Luther diagram of multimedia development
-
III. Research Method and Development
-
A. Research and Development Model
This research employs the approach of research and development. The development stages of the multimedia include: (1) material collection, (2) planning, (3)
production of a prototype, (4) pilot test, (5) improvement of the prototype, (6) field test, and (7) improvement of the final/operational product.
-
B. The Procedure of Research and Development
The research and development procedure of the digital interactive book can be explained as follows:
-
1) Material Collection
Material collection refers to the collection of industrial metrology courses materials which will be included in the multimedia. The sources used include various industrial metrology books and the internet. Therefore, materials more focused on industrial metrology.
-
2) Planning
After the data had been collected, the next stage was planned. At this stage, some activities were done:
-
(a) Data design
This refers to the transformation of information obtained from the collected materials, the industrial metrology files to soft files. Therefore, it would be easy to include the files in the multimedia;
-
(b) Architecture’s design
This was in the form of a diagram with symbols illustrating the processes and the relationships between the processes in details;
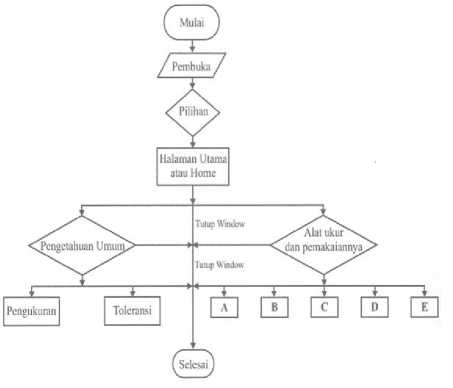
Fig.3. Architecture’s design diagram main menu
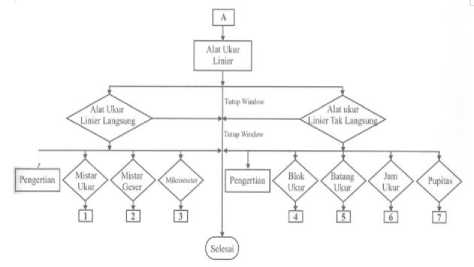
Fig.4. Architectures design diagram submenu A
-
(c) Interface design
The stage refers to the description/illustration of the program structure. The interface was designed to enable easy translation to the programming language. It was designed based on the flowchart.
-
3) Production of a Prototype
Based on the planning, the next stage done was implementing the program into graphic interface by using Macromedia Flash 8 Professional. Picture animations and texts about the metrology industry are displayed on the pad screen.
-
4) Pilot Test
The pilot test was done to examine the worthiness/value of the multimedia designed by involving one material/subject expert and one multimedia expert.
-
5) Improvement of the Prototype
Based on feedback and revisions from the experts, the next step was improving the prototype of the multimedia.
-
6) Field Test
The field test involved students as the users of the industrial metrology multimedia. The questionnaire distributed to the students include: (a) interface performance, (b) ease of operation, (c) navigation effectiveness, and (d) benefits of the multimedia.
-
7) Improvement of the Final/Operation Product
The final improvement was done after the field test. Therefore, the final version of the multimedia can be used for the learning of industrial metrology.
-
C. Product Evaluation
-
1) Design Evaluation
After the interactive book software had been designed, a test to evaluate its values was conducted. Some aspects which were evaluated include: the quality of materials, effectiveness of interface design, ease of operation, format, organization, effectiveness of navigation, and benefits.
-
2) Subjects
There were three subjects involved: material expert, multimedia expert, and students. The material/subject expert was a lecturer teaching industrial metrology or measurement, while the multimedia expert was a lecturer of learning multimedia.
-
3) Types of Data
The data were quantitative data obtained using the questionnaire. The data were used to evaluate the conformity of the designed media and the objective of the research, as well as to determine the worthiness/value of the industrial metrology multimedia. The respondents involved in the data collection were the multimedia expert, the material/subject expert, and users. Further, the obtained data were analyzed and described.
-
4) Data Collection Instruments
This research employed an implemented/used evaluation, in which the evaluation was done during the implementation/use of the multimedia. The obtained results were used for data analysis. The data were obtained from the multimedia expert, material/subject expert, and students. The following aspects were used to evaluate the developed digital interactive book.
-
a) Instrument for the Multimedia Expert
Table 2. Instruments for the Multimedia Expert
|
No. |
Constructs |
Indicators |
|
1. |
Screen Effectiveness |
animations
toward background
toward background
|
|
2. |
Ease of Operation |
- Ease of operation - Presentation systematics |
|
3. |
Consistency |
consistency
consistency
|
|
4. |
Format |
- Page format - Column format - Layout |
|
5. |
Organization |
- Materials - Chapter and sub-chapters - Exercises |
|
6. |
Navigation |
- Navigation effectiveness - Navigation function |
|
7. |
Benefits |
|
The instrument for the multimedia expert was evaluated based on the following constructs: effectiveness of screen, ease of operation, consistency, format, organization, navigation effectiveness, and benefits. The instrument framework was used to validate the worthiness/value of the media, and assessed based on the interface design. The framework presented in the table 2.
-
b) Instrument for the Material/Subject Expert
An instrument for the material/subject experts is based on the following aspects: material quality and benefits of the materials. The framework is presented in the table 3.
-
c) Instrument of the Use of Learning Multimedia by Students
Instrument of the use of the learning multimedia includes the following aspects: interface, operation, and benefits. This instrument was given to students. The framework of the instrument is presented in the following table. 4.
Table 3. Instruments for the Material/Subject Expert
|
No. |
Constructs |
Indicators |
|
1. |
Material quality |
(syllabus)
objectives
students |
|
2. |
Material benefits |
- Assistance in training - Helping students understand - Giving attention focus |
Table 4. Instruments for Students
|
No. |
Constructs |
Indicators |
|
1. |
Media interface |
|
|
2. |
Media operation |
- Ease of operation - Navigation |
|
3. |
Benefits |
attention |
-
5) Data Analysis Technique
The data analysis technique used in this research is descriptive analysis. The analysis was done by describing the obtained data without making generalization [17]. To determine the worthiness/value of the learning media, 4 rating scale was used. The result of the category is from the addition of score n x the number of respondents’ x the number of points, where n=value given by the respondents.
-
IV. Results
-
A. Data Analysis
The worthiness of the designed media is valued based on the results of the questionnaire distributed to the material/subject expert, learning multimedia expert, and students. The results are presented in this section.
-
1. Students’ Evaluation
-
2. Material Experts’ Evaluation
-
3. Multimedia Expert’s Evaluation
Based on the results of the evaluation, it is found that the percentage of the multimedia in terms of the interface of the media is 82.68%, the operation aspect 90.75%, and benefit 87.92%. Overall, the value given by the students is 86.42%. Therefore, the multimedia can be valued as ‘very worthy’ (table 5).
Based on the results of the material expert’s evaluation, it is found that the percentage of the multimedia in terms of the material quality is 77.94%, and benefit 87.50%. Overall, the value given by the material expert is 78.95%. Therefore, the multimedia can be valued as ‘very worthy’ to be used in learning (table 6).
Table 5. Students’ Evaluation Scores
|
No. |
Constructs |
Score Observer |
Score Expectation |
Percentage (%) |
|
1 |
Media interface |
463 |
560 |
82.68 |
|
2 |
Media operation |
363 |
400 |
90.75 |
|
3 |
Benefits |
211 |
240 |
87.92 |
|
TOTAL |
1037 |
1200 |
86.42 |
|
Table 6. Material Experts’ Evaluation Scores
|
No. |
Constructs |
Score Observer |
Score Expectation |
Percentage (%) |
|
1 |
Material quality |
106 |
136 |
77.94 |
|
2 |
Material benefits |
14 |
16 |
87.50 |
|
TOTAL |
120 |
152 |
78.95 |
|
Based on the results of the multimedia expert’s evaluation, it is found that the percentage of the multimedia in terms of the interface is 77.27%, ease of operation 87.50%, consistency 83.33%, format 84.38%, organization 83.33%, navigation effectiveness 83.33%, and benefit 87.50%. Overall, the value given by the multimedia expert is 82.42%. Therefore, the multimedia can be values as ‘very worthy’ (table 7).
Table 7. Multimedia Experts evaluation
|
No. |
Constructs |
Score Observer |
Score Expectation |
Percentage (%) |
|
1 |
Screen Effectiveness |
68 |
88 |
77.27 |
|
2 |
Ease of Operation |
14 |
16 |
87.50 |
|
3 |
Consistency |
20 |
24 |
83.33 |
|
4 |
Format |
27 |
32 |
84.38 |
|
5 |
Organization |
20 |
24 |
83.33 |
|
6 |
Navigation |
20 |
24 |
83.33 |
|
7 |
Benefits |
42 |
48 |
87.50 |
|
TOTAL |
211 |
256 |
82.42 |
-
B. Product Modification
Based on the feedback from the material expert, the multimedia expert, and students, there are some aspects of the multimedia which need to be revised, such as the interface/screen design and font used. The result of the revision is presented in the figure 5 to figure 9.
-
V. Conclusions and Suggestions
-
A. Review of the Revised Product
Based on the research and development, it is revealed that the design of the digital interactive book for the learning of industrial metrology was conducted through some stages: (1) early data collection, (2) planning, (3) early production or production of a prototype, (4) pilot test, (5) improvement of the prototype, (6) field test, and (7) improvement of the final/operational product. In the planning stage, there were some aspects designed: (a) data design, (b) design of architecture, and (c) interface design. The digital interactive book for the learning of industrial metrology belongs to the category of audio visual learning media because it displays texts, images, and measurement simulation at the same time.
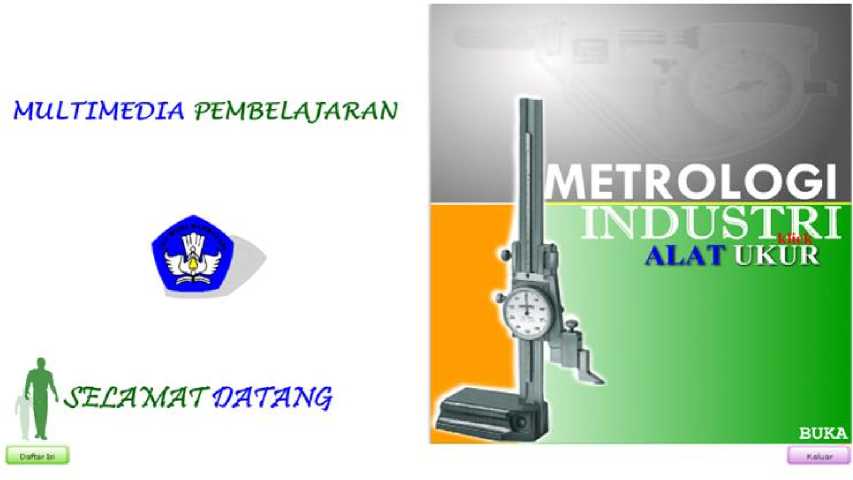
Fig.5. Main menu interface of multimedia
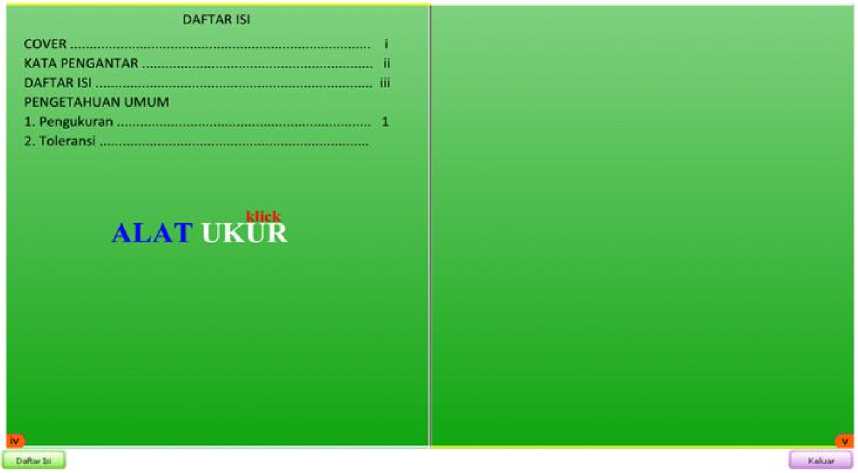
Fig.6. List of the contents menu of multimedia
Based on the statements obtained from 20 students and 2 expert lecturers, as well as from other evaluations, it is found that the learning multimedia are interesting, can be easily understood, easy to operate, having explanations of each aspect according to the manual book, and having good images. This can be seen from the results of the questionnaire which was distributed to the 20 students and the 2 expert lecturers. The designed multimedia can be said as ‘very worthy’.
-
B. Suggestions
The digital interactive book multimedia designed for the learning of industry metrology can be valued as ‘very worthy’. Therefore, in the process of teaching-learning of industrial metrology, students and lecturers can use the digital interactive book. With the designed multimedia, students can easily learn industrial metrology whenever and wherever they are. It is because the simulation of the use of measurement instruments/tools has been included in the multimedia. This will help students understand the materials of industrial metrology.
There are two interactive measurements instruments/tools in the simulation of the digital interactive book, which are a caliper and a micrometer. Other instruments/tools are still in the forms of noninteractive texts. Therefore, in the development of the multimedia, more simulations of interactive measurement instruments/tools need to be included.
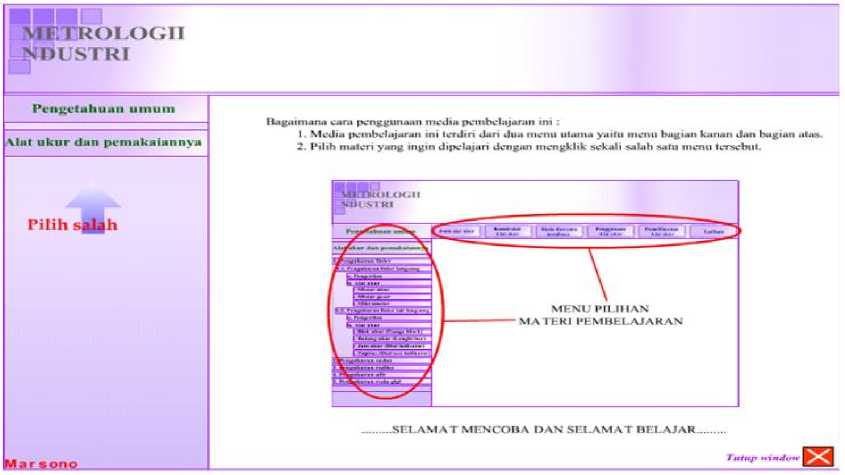
Fig.7. Menu interface measurement of multimedia
METROLOG I INDUSTRI

Konttrukii
Pengcanaea Met eker
I. Pcngukuran tinier
1.1. Pcagukuraa Hitler Ungwng
I*. Pcngcrllan
РгтсНЬагмеп AIM ukur
^ Mlstar мкмг
Mlkromcic*
■g*ung
■ . Pengertiea ь Alai ukur
IMoL uLui «laugc block!
Pilih salah satu mat
Mistar ukur rncrupakan alat ukur tinier langsung yang paling sederhana dan banyak dikcnal orang Hiasanya bcrupa plat, dunana pada kedua sisi dari salah satu
pennukaunnya dibcri xkula (metnk dan
Pcngukuran dilakukan dengan
mcncmpclkan mieiar ukur pada obyck ukur schingga panjang dan obyck ukur dapat langsung dibaca pada skala mistar ukur Keccrmaum pcmbacaan tidak dapat lebih kceil dan I 2 mm. olch sebab itu mistar ukur tidak dapat digunakan untuk pcngukuran dengan kcccrmatan tinggi Dalam mctrologi industri. mistar ukur hanya dipakai untuk memperkirakan duncnsi obyck ukur serta untuk mclakukan penggambaran secara kasar
1 ........ •" I lodikator)
in tudui
Pcngukuran ulii
5. Pcngukuran км1а gigl

Fig.8. Submenu interface of multimedia
PENGUKURAN RADIUS DAI AM DENGAN MENGUKUR JARAK KETIGA ROI.
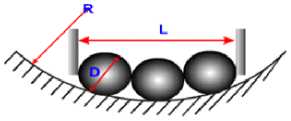
Langkah pcngukuran :
-
1. Letakkan tiga buah kalibcr bola pada bagian dalam.
-
2. Ukur jarak ketiga kalibcr rol tcrscbut
Rumus yang dipakai :
D
Keterangan:
R = radius dalam satuan derajat
D = ukuran diameter kaliber bola (mm)
L = jarak tepi luar dua kaliber bola yang ada di pinggir
Marsono
^) sclanjutnya
Tutup wi
Fig.9. Measurement tools simulation interface of multimedia
References Designing A Digital Multimedia Interactive Book for Industrial Metrology Measurement Learning
- J. Li, L. Wang, L. L. Wiliams, and C. A. Allan, "Development of a novel computer application to teach counting in K-2 classroom using the unified process method", I.J. Modern Education and Computer Science, vol. 10, pp. 1-11, 2015.
- M. Adri. "Strategi Pengembangan Multimedia Instructional Design". Jurnal Invotek, vol. 8. No. 1, 2007.
- Paltimer, J.R., "Effect of computer algebra systems on concept and skill acquisition Calculus". Journal for Research in Mathematics Educations, 1991.
- Soenarto, S. "Pembahasan Hasil Penelitian: Pengembangan Multimedia Pembelajaran Interaktif Mata Kuliah Tata Hidang". Jurnal Inotek, vol. 9, no 1, 2005.
- Suyanto, M. Multimedia Alat Untuk Meningkatkan Keunggulan Bersaing. Yogyakarta: Andi, 2003.
- Arsyad, A. Media Pembelajaran. Jakarta: PT. Raja Grafindo Persada, 2002.
- J. A. Kulik, C. C. Kulik, and R. L. Bangert-Drowns, "Effectiveness of computer-based education in elementary schools," Computers in Human Behavior, vol. 1, pp. 59–74, 1985.
- N. Balacheff and J. J. Kaput, "Computer-based learning environments in mathematics," International Handbook of Mathematics Education, Springer: Netherlands, pp. 469–501, 1996.
- Agnew, P. W. Multimedia in the Classroom. Massachusetts: Allyn and Bacon, 1996.
- M. Dominic and S. Francis, "An adaptable e-learning architecture based on learners' profiling", I.J. Modern Education and Computer Science, vol. 3, pp. 26-31, 2015.
- L. Rajendran and R. Veilumuthu, "A Cost Effective Cloud Service for E-Learning Video on Demand". European Journal of Scientific Research, pp. 569-579, 2011.
- Sleigh. "Learning Styles – from Theory to Practice. Training and Development in Australia". Australian Institute of Training and Development, 29(2), pp.44, 2002.
- M. A. Tadlaoui, S. Aammou, M. Khaldi, and R. N. Carvalho, "Learner modeling in adaptive educational system: a comparative study", I.J. Modern Education and Computer Science, vol. 3, pp. 1-10, 2016.
- Chandra, H. Membuat Sendiri Animasi Profesional dengan 3ds max 4.2. Jakarta: Elex Media Komputindo, 2002.
- Newby, T. J. et. al. Instructional Technology for Teaching and Learning. New Jersey, USA: Merrill an Imprint of Prentice-Hall, 2000.
- A. Hadi. Animasi dengan Macromedia Flash Berikut Actionscript. Jakarta: Salemba Infotek, 2002.
- Sugiyono. Metode Penelitian Bisnis. Bandung: Alfabeta, 2004.
