Designing multilayer dielectric filter based on TiO2/SiO2 for fluorescence microscopy applications

Author: Mai Hanh Hong
Journal: Компьютерная оптика @computer-optics
Section: Дифракционная оптика, оптические технологии
Article in issue: 2 т.44, 2020.
Free access
This study presents a new construction design of a distributed Bragg reflector (DBR) filter and a Fabry-Pérot (FP) filter by using needle technique as a synthesis method. The optimized DBR and FP filters having a proper number of layers with controlling thickness TiO2/SiO2 are utilized to transmit only a certain narrow band of wavelengths while blocking the others. As a proof of concept, the filters are designed to selectively transmit only a very narrow band of wavelength at 780 nm which is the near infrared (NIR) fluorescent emission from Alexa Fluor 750 dye. The obtained results show that the optimized filters represent advanced spectral performance which can be used to improve the sensitivity and the imaging contrast in fluorescence microscopy.
Bragg reflectors, dbr filter, fabry-perot, fabry-pérot filter, thin film, thin film deposition, needle method
Short address: https://sciup.org/140247103
IDR: 140247103 | DOI: 10.18287/2412-6179-CO-618
Text of the scientific article Designing multilayer dielectric filter based on TiO2/SiO2 for fluorescence microscopy applications
Fluorescent dyes are frequently used as cell and tissue labels in fluorescence microscopy and cell biology [1 –3]. They can be conjugated to a variety of antibodies, streptavidin, peptides, proteins, tracers, and amplification substrates [4]. In fluorescence microscopy imaging, after conjugating onto biological specimens, they can emit a wide range of wavelength spanning from visible (VIS) to near infrared (NIR) under a continuous illumination of a light source, thus, generates images [5–8]. In common fluorescence microscopes, the detectors normally present better sensitivity in VIS range than in the NIR range. As a result, the fluorescent intensities detected in NIR range are lower than that in VIS range. Very often, they are even lower than the reflected, scatter or even diffracted light from excitation light sources. Thus, the images obtained from specimens conjugated with NIR dyes are normally dimmer with lower imaging contrast compared to specimens conjugated with VIS dyes. Technically speaking, the image contrast can be improved by allowing only NIR emission to reach to the detector while blocking other emissions. This can be done in a fluorescence microscope by implementing band-pass filters which allow only NIR light to transmit while filtering out others.
Band-pass filters based on thin film technology has been attracted a lot of attention in microscopy imaging [9– 11]. They consist of alternating layers of high and low refractive index materials with particular thicknesses. They function based on the principle of multiple reflections and interferences between high and low index material interfaces [10, 12]. Technically speaking, the performance of band-pass filters can be altered by changing the character- a grant to Dr. Hanh Hong Mai. Grant NO.
istic of the component films i.e. refractive index of layers and optical thicknesses [12– 15]. DBR filter is a type of band-pass filters. In order to satisfy the interfering condition, their layers are defined as quarter-wave thick of the center wavelength. A DBR filter normally exhibits a very high reflectivity in a certain range of wavelengths around a center wavelength. This high reflection region is known as the DBR stopband, and is governed by the refractive index contrast between the constituent layers [9, 12, 13]. The higher the refractive index contrast, the broader the stopband is obtained. A Fabry-Pérot (FP) filter, on the other hand, consists of a cavity between two highly reflecting DBR filters. By inserting a half wavelength cavity, a very narrow band of a designed wavelength can be highly transmitted within the stopband [14– 19].
Taking advantages of band-pass filters based on thin film technology, in this work, an optimal design of DBR and FP filters based on needle technique which can transmit only a narrow band in NIR range while blocking others will be introduced. The filters are based on a stack of TiO 2 /SiO 2 which are vital dielectric materials with wide band-gap energies and high refractive index contrast [9,20–22]. TiO 2 is selected for high refractive index layer of 2.5 and SiO 2 as a low refractive index layer of 1.45. As a proof of concept, a combination of an optimized DBR and a FP filters was designed with a central wavelength of 780 nm to selectively transmit a narrow band of wavelength at 780 nm emitted from a NIR fluorescent Alexa Fluor 750 dye while blocking the others [3]. Additionally, in order to clarify the accuracy of the optimal filter designs, comparisons between the initial and optimized filter spectrum, and between optimized and experimental filter spectrum are also taken into account.
1. Theoretical basis
Consider a band-pass filter surrounded by an environment. Light from the source falls on the filter at an angle ϑ o , and a wave front penetrates the filter surface can be considered as planar. To calculate the transmission and reflection spectra of a multilayer band-pass filter, transfer matrix method is normally applied. Herein, a band pass filter consisting of q thin film layers is represented as a system matrix which is the product of the individual layer matrices, taken in the correct order, given by [9]:
Technically speaking, the optimal position of needle to be added is where derivative of merit function is negative. Mostly a few single needle layers are added and trans-mission/reflection spectrum is calculated. The addition of needle layers stops at the point where there is no improvement in the target transmission/reflection spectrum.
B
cos 8 r (i sin 8 r)/ nr inr sin 8r cos 8r
П m
,
where, B and C are the normalized electric and magnetic fields at the front interface
8 r = 2nn r d r cos 9 r / X ;
Top DBR—
■—High Refractive index '
4— Low Refractive index'
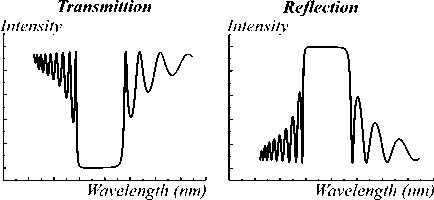
Fig. 1. Reflection spectrum and transmission spectrum of a DBR filter
n r is the refractive index of layer, d r is the physical thickness layer, q is the number of layers next to substrate, ϑ r is the reflected angle which can be derived from an incident angle ϑ o by Snell’s law. η m is the substrate admittance.
The expression for transmittance of a multilayer system which is defined as the ratio of the output intensity from thin film assembly to input intensity, is given as follow: The system matrix finally will be converted back into reflection and transmission spectra.
*
R =
T =
| П oB - C | | П oB - C| (noB + cJinoB+cJ ,
4 n o Re( n s )
( n o B - c )( n o B + C ),
Top DBR—
Cavity—
Bottom DBR—
— High Refractive index
^ - Low Refractive index ‘
Transmittion
Reflection
Intensity Intensity
Wavelength (nm) Wavelength (nm)
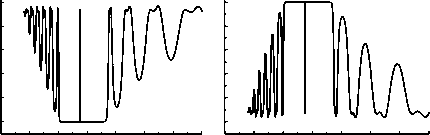
Fig. 2. Reflection and transmission spectrum of a FP filter consisting of a cavity and two DBRs
η o is the incident medium of admittance, n s is the refractive index of the substrate, and Re( n s ) represents the real part of refractive index of substrate. Based on the transfer matrix method a reflection spectrum and transmission spectrum of a DBR and a FP filter are calculated and presented in Fig. 1 and Fig. 2. Here, a spectrum region where the DBR and the FP filter provide extremely high reflectance is the stopband. Within a stopband, a sharp, high intensity peak denoting high transmission of a very narrow band of wavelengths appears. It is generated from the haft wavelength cavity in between the two DBRs of a FP filter.
-
2. Optimization of multilayer filters
It is often difficult, or even impossible, to manually design a filter respecting all the requirements for a given application. However, it is possible to optimize a filter using synthesis methods. The most commonly used synthesis method is the needle method [9, 10, 23]. The needle method was first described by Tikhonravov in 1982 [24]. The essence of needle technique is that using an algorithm to identify convenient places to insert new layers that will improve the discrepancy between the target and solution which is well known as merit function.
-
3. Requirements of designed filters
In this work, the proposed filters are utilized to improve the sensitivity and imaging contrast in fluorescence microscopy. An example of a fluorescence microscopy is shown in Fig. 3. It consists of a light source, biological specimens conjugated with different dyes including Alexa Fluor 750 dye, a FP filter and a detector. In common fluorescence microscopes, the light source is a Halogen lamp which covers a broad range of wavelength from UV to NIR range (from 200 nm to 2000 nm). The detector, on the other hand, normally covers a shorter range of wavelength from 250 nm to 1000 nm. Its sensitivity in NIR range (from 750 nm to 1000 nm) is very poor compared to that in VIS range. The working range (stopband) of a FP filter is shortest which is normally less than 300 nm. That means unwanted wavelengths coming from outer side of the stopband can also reach to the detector, causes poor imaging contrast and low sensitivity. Therefore, filtering out the wavelengths outside the filter stopband is always of high demand.
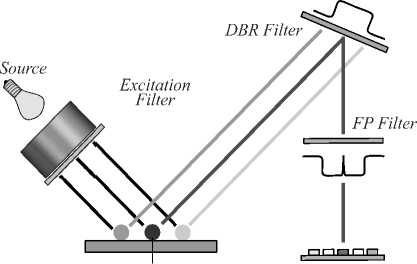
In order to improve the sensitivity and image contrast in NIR range, one solution is to include a compact of optimal DBR and FP filters in the setup to allow only a very narrow NIR band of a specific wavelength to pass through. The proposed exemplary fluorescence microscopy is demonstrated in Fig. 4. An optimized DBR and a FP filter will be implemented in the setup to allow only the wavelength of 780 nm to transmit, thus, reaching to the detector, while blocking other wavelengths outside the stopband. Additionally, the transmitted peak is required to have high intensity while still exhibiting a narrow peak width (FWHM).
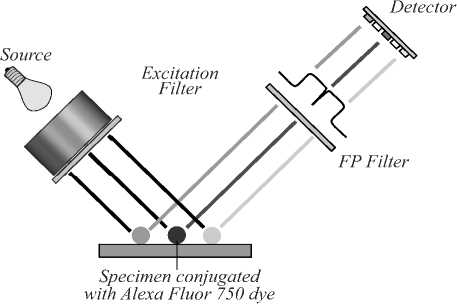
Fig. 3. An exemplary fluorescence microscopy. It consists of a light source, a FP filter and a detector. Wavelengths outside the stopband are also detected in this setup
Specimen conjugated Detector with Alexa Fluor 750 dye
Fig. 4. A proposed exemplary fluorescence microscopy.
An optimized DBR and a FP filter are included in the setup to only transmit 780 nm while blocking the wavelengths outside the stopband
-
4. Optimization designs and discussion
In this work, the open-source software, Open Filters, and its needle function are used to optimize the designs of DBR and FP filters based TiO 2 / SiO 2 [23, 25]. To decrease the stimulation time, an initial DBR design close to the required design can be synthesized using H(LH) p layer configuration [11, 16, 20, 26, 27], where H and L are quarter-wave thick of high and low refractive index layers and p is the number of repeated high and low refractive index pairs. Similarly, an initial FP filter design with layer structure of H(LH) q 2L H(LH) q was chosen, in which H(LH) q represents the top and the bottom DBR, 2L describes a half wavelength cavity. The repeated high and low refractive index pairs q in this design is 4. The center wavelength in both cases is 780 nm.
In this case, the high refractive index is denoted for TiO 2 , and low refractive index is denoted for SiO 2 . p in this case is chosen to be 10. The angle of the incident light was chosen as 0o degrees. Note that, the transmitted and reflected light in all cases were selected as unpolarized light.
The DBR reflection spectrum of the initial design is presented in Fig. 5 showing in a stopband of 225 nm (from 675 nm to 900 nm) with high reflectivity of almost 0.97 and two sharp edges. However, there are fringes with high reflectivity outsides the stopband. That means the DBR filter not only reflect the wavelength range inside but also outside the stopband. The reflected light outside the stopband will cause noise signal, which create a significant impact on the low sensitivity and low contrast of microscopy imaging. By using needle function, an optimized DBR filter design with 26 layers and total thickness of 2340 nm was obtained. Compared to the initial design, the optimized DBR filter still maintains high reflectivity within the stopband, remains the stopband width of 225 nm, however, the fringes outside the stopband are significantly suppressed. The data of the optimized DBR filter design is presented in Table 1.
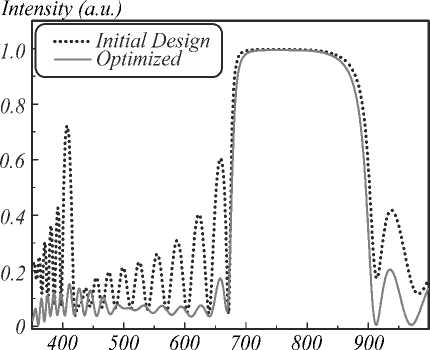
Wavelength (nm)
Fig. 5. Reflection spectra of an initial and an optimized design of a DBR filter
Fig. 6 represents the FP transmission spectrum of the initial design, showing in a stopband of 250 nm and a sharp, high intensity peak (narrow band of wavelength) at 780 nm. However, outsides the stopband there are fringes with fluctuated transmission intensity. By using needle function, an optimized FP filter design with 22 layers and total thickness of 2144 nm was obtained. Compared to the initial design, a small shift to shorter wavelength of 30 nm is observed. However, the stopband width is maintained 250 nm. Most importantly, the transmission peak remains a high intensity at 780 nm. This allows the fluorescent emission of Alexa Fluor 750 dye can be transmitted thoroughly the DBR and the FP without attenuation. Similar to the previous case, the fringes outside the stopband is significantly suppressed. The data of the optimized DBR filter design is presented in Table 2.
In order to verify the optical quality and the accuracy of the optimized filters, a comparison between the simulated and experimental transmission spectra of an optimized DBR filter is taken into account. To simplify the deposition process, an optimized filter with only 13 layers of TiO2 / SiO2 is considered. Based on the thickness data of the optimized design, a DBR filter was deposited by using vacuum coating systems (Univex 400). Comparing simulated data and experimental data, good correlations in the stopband position and stopband width are observed (Fig. 7). Similar to the simulated spectrum, the experimental spectrum also exhibits negligible fringes outside of the stopband. A small shift to longer wavelength of the stopband is most likely caused by variation of the real layer thicknesses. Furthermore, an increase in reflection (equivalent to a decrease in transmission) at the edge of the stopband (at wavelength of 950 nm) is also observed. It is due to the high absorbance of TiO2 in NIR range [28].
Table 1. Layer thickness of TiO 2 /SiO 2 based DBR filter with a central wavelength of 780 nm
|
Layer No. |
Material |
Thickness (nm) |
Layer No. |
Material |
Thickness (nm) |
|
1 |
TiO 2 |
90.25 |
14 |
SiO 2 |
135.87 |
|
2 |
SiO 2 |
146.13 |
15 |
TiO 2 |
81.65 |
|
3 |
TiO 2 |
82.52 |
16 |
SiO 2 |
138.04 |
|
4 |
SiO 2 |
134.21 |
17 |
TiO 2 |
84.05 |
|
5 |
TiO 2 |
80.36 |
18 |
SiO 2 |
147.95 |
|
6 |
SiO 2 |
134.95 |
19 |
TiO 2 |
15.30 |
|
7 |
TiO 2 |
80.02 |
20 |
SiO 2 |
30.11 |
|
8 |
SiO 2 |
134.89 |
21 |
TiO 2 |
14.46 |
|
9 |
TiO 2 |
80.77 |
22 |
SiO 2 |
144.88 |
|
10 |
SiO 2 |
135.12 |
23 |
TiO 2 |
75.39 |
|
11 |
TiO 2 |
81.04 |
24 |
SiO 2 |
10.74 |
|
12 |
SiO 2 |
135.33 |
25 |
TiO 2 |
7.36 |
|
13 |
TiO 2 |
81.47 |
26 |
SiO 2 |
57.47 |
Table 2. Layer thickness of TiO 2 /SiO 2 based FP filter with a central wavelength of 780 nm
|
Layer No. |
Material |
Thickness (nm) |
Layer No. |
Material |
Thickness (nm) |
|
1 |
TiO 2 |
77.95 |
12 |
SiO 2 |
18.49 |
|
2 |
SiO 2 |
138.73 |
13 |
TiO 2 |
73.34 |
|
3 |
TiO 2 |
75.86 |
14 |
SiO 2 |
133.07 |
|
4 |
SiO 2 |
129.57 |
15 |
TiO 2 |
71.73 |
|
5 |
TiO 2 |
73.79 |
16 |
SiO 2 |
129.47 |
|
6 |
SiO 2 |
128.23 |
17 |
TiO 2 |
73.79 |
|
7 |
TiO 2 |
68.95 |
18 |
SiO 2 |
130.95 |
|
8 |
SiO 2 |
133.26 |
19 |
TiO 2 |
73.27 |
|
9 |
TiO 2 |
78.68 |
20 |
SiO 2 |
131.28 |
|
10 |
SiO 2 |
262.87 |
21 |
TiO 2 |
68.29 |
|
11 |
TiO 2 |
10.07 |
22 |
SiO 2 |
62.08 |
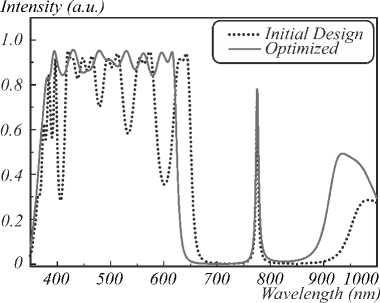
Fig. 6. Transmission spectra of an initial and an optimized design of a FP filter
Intensity (а.и.)
1.0
0.8
0.6
0.4
0.2
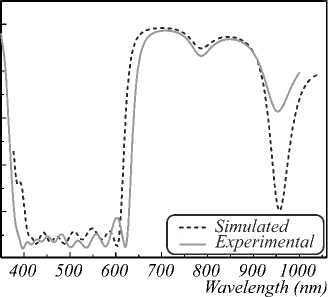
Fig. 7. Simulated and experimental reflection spectra of an optimized DBR filter with 13 layers
Conclusion
In this work DBR and FP filters are designed and optimized to transmit the NIR fluorescent emission at 780 nm from Alexa Fluor 750 dye conjugated onto biological specimens while blocking other wavelengths. It has been shown that the optimized filters still maintain the most important characteristic properties of initial filter designs such as high reflectivity within the stopband, remaining stopband width, and high transmission at the 780 nm peak. Furthermore, by using needle technique, the fringes outside the stopband is significantly suppressed which helps to block all other wavelengths outside the stopband. The simulated reflection spectrum of an optimized DBR filter design containing 13 layers of TiO2 / SiO2 show a good correlation with experimental spectrum. The obtained results can be considered as an important base for the applications of optimized DBR and FP filters in microscopy imaging.
References Designing multilayer dielectric filter based on TiO2/SiO2 for fluorescence microscopy applications
- Matsunaga T, Okochi M, Nakasono S. Direct count of bacteria using fluorescent dyes: Application to assessment of electrochemical disinfection. Anal Chem 1995; 67: 4487-4490. DOI: 10.1021/ac00120a010
- Yuan L, Lin W, Yang Y, Chen H. A unique class of near-infrared functional fluorescent dyes with carboxylic-acid-modulated fluorescence ON/OFF switching: Rational design, synthesis, optical properties, theoretical calculations, and applications for fluorescence imaging in living animals. J Am Chem Soc 2012; 134: 1200-1211. DOI: 10.1021/ja209292b
- Invitrogen. Alexa fluor® dyes: Simply the best and brightest fluorescent dyes and conjugates. Molecular Probes Inc; 2005: 1-36
- Oliveira E, Bértolo E, Núñez C, Pilla V, Santos HM, Fernández-Lodeiro J, et al. Green and red fluorescent dyes for translational applications in imaging and sensing analytes: A dual-color flag. ChemistryOpen 2018; 7(1): 9-52. DOI: 10.1002/open.201700135
- Young MR. Principles and technique of fluorescence microscopy. J Cell Sci 1961; s3-102: 419-449
- Drummen GPC. Fluorescent probes and fluorescence (microscopy) techniques - Illuminating biological and biomedical research. Molecules 2012; 17: 14067-14090.
- DOI: 10.3390/molecules171214067
- Ettinger A, Wittmann T. Fluorescence live cell imaging. In Book: Waters JC, Wittman T, eds. Quantitative imaging in cell biology. Vol. 123. Ch 5. Academic Press; 2014: 77-94.
- DOI: 10.1016/B978-0-12-420138-5.00005-7
- Thorn K, Kellogg D. A quick guide to light microscopy in cell biology. Mol Biol Cell 2016; 27: 219-222.
- DOI: 10.1091/mbc.e15-02-0088
- MacLeod HA. Thin-film optical filters. 4th ed. Taylor & Francis Book; 2010.
- ISBN: 978-1-4200-7302-7
- Marthinsen H. Numerical methods for optical interference filters. Norwegian University of Science and Technology; 2009
- Habib M, Ullah A. Simulation of near Infrared interference bandpass filters for spectroscopic applications. 2016 International Conference on Computing, Electronic and Electrical Engineering (ICE Cube) 2016: 234-238.
- DOI: 10.1109/ICECUBE.2016.7495230
- Nazar A, Ali AH, Jasem NA. New construction stacks for optimization designs of edge filter. IOSR J Appl Phys 2016; 8(3:II): 20-26.
- DOI: 10.9790/4861-0803022026
- Nazar A. Design optical filters using two different synthesis approaches. Journal of Kufa - physics 2011; 3(1): 45-58
- de Denus-Baillargeon M-M, Abel-Tibérini L, Lequime M, Carignan C, Épinat B, Gach J-L, et al. Developing high-performance reflective coatings for the tunable filter and the high-order interferometer of the 3D-NTT. Soc Photo-Optical Instrum Eng Conf Ser 2008; 7013: 111.
- DOI: 10.1117/12.789498
- Butt MA, Fomchenkov SA, Khonina SN. Dielectric-Metal-Dielectric (D-M-D) infrared (IR) heat reflectors. J Phys Conf Ser 2017; 917: 62007.
- DOI: 10.1088/1742-6596/917/6/062007
- de Denus-Baillargeon M-M, Schmitt T, Larouche S, Martinu L. Design and fabrication of stress-compensated optical coatings: Fabry-Perot filters for astronomical applications. Appl Opt 2014; 53(12): 2616-2624.
- DOI: 10.1364/AO.53.002616
- Butt MA, Strelkov YuS. An approach to developing a Fabry-Perot filter by a single fabrication step for gas sensing applications. Proc SPIE 2018; 10774: 107740P.
- DOI: 10.1117/12.2316482
- Butt MA, Khonina SN, Kazanskiy NL. Numerical analysis of a miniaturized design of a Fabry-Perot resonator based on silicon strip and slot waveguides for bio-sensing applications. J Mod Opt 2019; 66(11): 1172-1178.
- DOI: 10.1080/09500340.2019.1609613
- Butt MA, Khonina SN, Kazanskiy NL. Label-free detection of ambient refractive index based on plasmonic Bragg gratings embedded resonator cavity sensor. J Mod Opt 2019; 66(19): 1920-1925.
- DOI: 10.1080/09500340.2019.1683633
- Butt MA, Fomchenkov SA, Ullah A, Habib M, Ali RZ. Modelling of multilayer dielectric filters based on TiO2/SiO2 and TiO2/MgF2 for fluorescence microscopy imaging. Computer Optics 2016; 40(5): 674-678.
- DOI: 10.18287/2412-6179-2016-40-5-674-678
- Butt MA, Fomchenkov SA, Ullah A, Verma P, Khonina SN. Biomedical bandpass filter for fluorescence microscopy imaging based on TiO2/SiO2 and TiO2/MgF2 dielectric multilayers. J Phys Conf Ser 2016; 741: 012136.
- DOI: 10.1088/1742-6596/741/1/012136
- Butt MA, Fomchenkov SA, Khonina SN. Multilayer dielectric stack notch filter for 450-700 nm wavelength spectrum. CEUR Workshop Proceedings 2017; 1900: 1-4.
- DOI: 10.18287/1613-0073-2017-1900-1-4
- Nazar A. Open Filters: For optimum design wideband ARC's at oblique incidence of light and effect dispersion of material coating. Journal of College of Education 2012; 2: 760-773
- Tikhonravov AV, Trubetskov MK, DeBell GW. Application of the needle optimization technique to the design of optical coatings. Appl Opt 1996; 35: 5493-5508.
- DOI: 10.1364/AO.35.005493
- Larouche S, Martinu L. OpenFilters: open-source software for the design, optimization, and synthesis of optical filters. Appl Opt 2008; 47: C219.
- DOI: 10.1364/AO.47.00C219
- Tang H, Gao J, Zhang J, Wang X, Fu X. Preparation and spectrum characterization of a high quality linear variable filter. Coatings 2018; 8: 308.
- DOI: 10.3390/coatings8090308
- Jen Y-J, Lin M-J. Design and fabrication of a narrow bandpass filter with low dependence on angle of incidence. Coatings 2018; 8: 231.
- DOI: 10.3390/coatings8070231
- Sta I, Jlassi M, Hajji M, Boujmil MF, Jerbi R, Kandyla M, et al. Structural and optical properties of TiO2 thin films prepared by spin coating. J Sol-Gel Sci Technol 2014; 72(2): 421-427.
- DOI: 10.1007/s10971-014-3452-z
