Detecting Anomalies in Students' Results Using Decision Trees

Author: Hamza O. Salami, Ruqayyah S. Ibrahim, Mohammed O. Yahaya
Journal: International Journal of Modern Education and Computer Science (IJMECS) @ijmecs
Article in issue: 7 vol.8, 2016.
Free access
Examinations are one of the most important activities that take place in institutions of learning. In many Nigerian universities, series of meetings are held to manually examine and approve computed student examination results. During such meetings, students' results are scrutinized. Reasonable explanations must be provided for any anomaly that is discovered in a result before the result is approved. This result approval process is prone to some challenges such as fatigue arising from the long duration of the meetings and wastage of man-hours that could have been used for other productive tasks. The aim of this work is to build decision tree models for automatically detecting anomalies in students' examination results. The Waikato Environment for Knowledge Analysis (WEKA) data mining workbench was used to build decision tree models, which generated interesting rules for each anomaly. Results of the study yielded high performances when evaluated using accuracy, sensitivity and specificity. Moreover, a Windows-based anomaly detection tool was built which incorporated the decision tree rules.
Decision trees, examination results, anomaly detection, educational data mining, result anomaly
Short address: https://sciup.org/15014882
IDR: 15014882
Text of the scientific article Detecting Anomalies in Students' Results Using Decision Trees
Published Online July 2016 in MECS
Examinations are one of the most important activities that take place in institutions of learning. In fact, examinations can be considered as the climax of the semester’s activities in educational institutions. After examinations are written, subject teachers assess students’ answers and allocate marks to the students. The collection of student grades in the different subjects/courses is used to compute an overall result for the student. In many Nigerian universities, series of meetings are held to manually examine and approve computed student results. First, the grades of students in each subject are approved during departmental meetings. Thereafter, a College/School Board meeting attended by all teaching staff in the college is held to approve computed results for every student in the college. Finally, (a committee of) the University Senate meets to approve computed results for every student in the university. Once anomalies are identified in any result during a meeting, the official presenting the result must provide satisfactory explanations for the anomalies before the result is approved.
Undoubtedly, accurate computation of student results is very important. The current manual system of examining and approving student results in many Nigerian universities is however faced with several disadvantages such as:
-
1. Wastage of man hours: The series of meetings required to consider and approve student results is time consuming and wastes time that university staff could have utilized for more productive activities
-
2. Fatigue: Meetings for approving examination results usually last for many hours. Once the participants in such meetings become tired, they lose focus. This can negatively affect the output of such meetings. The consequence of such fatigue is errors that are usually found in approved results.
-
3. Miller’s law: According to Miller’s law, the number of objects an average human being can hold in working memory is 7 ± 2 [1]. This implies that when humans are flooded with lots of information at once, they are only able to grasp at most nine pieces of information. During meetings for approving results, meeting participants may fail to observe certain anomalies in student results due to the huge volume of information the participants try to assimilate at once.
Anomaly is defined as a set of data points that significantly differs from the remaining data. Anomaly detection is the process of finding a pattern that does not conform to the expected normal behaviour [2]. Anomalies are sometimes called surprises, outliers, exceptions, discordant observations, peculiarities, aberrations, or contaminants depending on the application domain [3].
In anomaly detection, models of normal data are built, then attempts are made on observed data to detect normal observations [4]. Anomaly detection has been applied in diverse fields such as network intrusion detection, fault detection, cyber-intrusion detection, fraud detection, medical anomaly detection, industrial damage detection, image processing, textual anomaly detection and sensor networks [3].
Decision tree learning is commonly used in data mining to build models capable of predicting the value of a target variable from several input variables or attributes. A decision tree is a tree data structure made up of decision nodes and leaves [5]. Starting from the root, decision nodes specify tests on an attribute, and depending on which test is passed, a path is followed down to a leaf node, which specifies a class value. Popular decision tree algorithms include ID3, C4.5 and Classification and Regression Trees (CARTs) [6].
The rest of this paper is structured as follows: Related works are discussed in Section II while Section III focuses on anomalies in student results. Decision trees are the subject of Section IV and experimental results are discussed in Section V. Tool support for our anomaly detection system is covered in Section VI. Finally, the paper is concluded in section VII.
-
II. Related Works
Extensive uses have been made of anomaly detection in a wide range of application domains including identification of malicious webpages, detection of unwanted behaviour in social networks and network anomaly detection.
Ref. [7] proposed a hierarchical framework for identifying malicious webpages. The first stage of the framework utilizes a misuse detection model built on the C4.5 decision tree algorithm to detect known malicious webpages. In the second stage, an anomaly detection model built on the one-class support vector machine is used to detect unknown malicious webpages. The framework achieved a significantly high malicious webpage detection rate but has a slightly high false positive rate.
Ref. [8] used Principal Component Analysis (PCA) for distinguishing potentially bad unwanted behaviour from normal behaviour in a social network. The PCA is an unsupervised anomaly detection technique which is used to find patterns in high dimensional data. After detection, the K Nearest Neighbor algorithm was used to identify the category of anomalous users. Experimental results show 66% detection rate with less than 0.3% false positive rate.
Ref. [9] utilized extreme learning machines (ELMs) for classifying traffic and detecting anomalous behaviors on the Internet. ELMs are feedforward neural networks with a single-hidden layer, whose weights are randomly chosen. Ref. [10] proposed a two-stage system that combines self-organizing maps and the k-means clustering algorithm for detecting anomalous activities on a network.
Ref. [11] compared the performance of three machine learning algorithms namely, Naïve Bayes, decision trees and support vector machines (SVM) in detecting real- time anomalies on a network. Overall, SVM produced the highest detection accuracy. Similarly, Ref. [12] investigated the performance of Naïve Bayes, decision table algorithm, the C4.5 decision tree algorithm and a variant of the C4.5 to detect offline denial of service attacks on a network. Experimental results showed that Naïve Bayes produced the lowest prediction accuracy of approximately 75%, while the other three algorithms resulted in prediction accuracies of almost 98%.
As can be deduced from the reviewed works, even though anomaly detection has been applied in various areas, anomaly detection in the education domain has not caught the attention of researchers. Although prediction of students’ performance is the most popular application of data mining in education, other common areas of application include recommending tasks to students, providing feedback for supporting instructors and personalizing to students [13].
-
III. Anomalies in Students’ Examination Results
Anomalies in students’ examination results are any noteworthy observations in the students’ results requiring additional detailed explanation. It is important to note than an anomaly is not necessarily a bad thing. For example, when 36 out of 40 students score an A in a course, the students’ performance in the course cannot be referred to as bad, However, because there is an abnormally high proportion of As in that course, the situation is considered to be an anomaly.
In order to gain insight into what lecturers considered to be anomalies in students’ results, we convened a mock departmental results approval meeting. The meeting helped us to accomplish two main objectives: (i) to list and explain the different anomalies that occur in student examination results (ii) to obtain experimental dataset by asking the meeting participants to identify anomalies in some students’ results.
The five lecturers who attended the meeting were from the School/Faculty of Information and Communication Technology, Federal University of Technology, Minna, Nigeria. Each of these lecturers had been teaching undergraduate and/or postgraduate students in the university for at least two years, and had been involved in a number of departmental results approval meetings.
Two groups of anomalies were identified: course-based anomalies which consider the general performance of students in a particular course, and student-based anomalies which consider the performance of a single student in one course.
-
A. Course-based anomalies
These are anomalies which are related to the general performance of all students of a particular course. Seven features were used to describe each course: percentage of grades that are As, percentage of grades that are Bs, percentage of grades that are Cs, percentage of grades that are Ds, percentage of grades that are Es, percentage of grades that are Fs, and number of students that enrolled for the course.
Three course-based anomalies were identified during the mock departmental results approval meeting: (i) High failure rate anomaly, which occurs when a significant proportion of the class has failed a course. (ii) Low grades anomaly, which arises when students generally perform poorly in a course. Note that students may get low grades in a course without necessarily failing the course. (iii) Too many good grades anomaly, which happens when lots of students have high grades in a course. Table 1 shows examples of each course-based anomaly.
-
B. Student-based anomalies
These are anomalies which are related to the performance of a certain student in a particular course. The performance of every student who enrolled for a course is described using three features: the student’s continuous assessment (CA) score, which ranges from 0 to 40; the student’s examination score, which ranges from 0 to 60; and the student’s total score, which is the sum of the CA and exam scores. The four student-based anomalies identified during the mock meeting are: (i) Disproportionate CA vs Examination Scores anomaly, indicating a mismatch between a student’s CA and exam scores, such as when a student performed very well in the CA but poorly in the exam, or when a student performed excellently in the exam after having performed poorly in the CA. Examples of disproportionate CA vs Examination Scores anomaly are when a student scores 5 out of 40 in the CA then scores 55 out of 60 in the examination, or when a student scores 39 out of 40 in the CA but only 10 out of 60 in the examination. (ii) Perfect CA score anomaly, which occurs when a student scores 40 out of 40 marks in the CA. (iii) Perfect exam score anomaly, which occurs when a student scores 60 out of 60 marks in the exam. (iv) Borderline failure anomaly, which happens when a student fails a course by earning a total score of 39 marks, which is one mark less than the pass mark of 40. Table 2 shows examples of each student-based anomaly.
-
IV. Decision Trees
In learning from feature based examples, one of the most common choices is a decision tree [14]. It is a classification technique which generates from a given dataset a tree and set of rules representing the model of different classes. It is usually a flowchart-like structure and is characterized by advantages such as generation of easily understandable rules, ability to handle categorical and numerical attributes, as well as ability to indicate the most important fields for classification [14].
Construction of decision trees from a given training dataset is referred to as tree induction. Tree induction is usually a top-down approach and at each step of the tree, a variable which best splits the set of items is chosen [15]. Tree induction algorithms mainly vary based on the criteria which they use in splitting the nodes.
The popular ID3 induction algorithm was developed by Ross Quinlan of the University of Sydney, Australia in 1986. The splitting criteria for ID3 is information gain, thus at each node, the attribute that minimizes the information needed to classify a sample is chosen as the test attribute for that node. Nodes are recursively split until either the number of training instances arriving at a node falls below a threshold or all training instances at that node belong to the same class. ID3 cannot handle missing values or numeric attributes.
The C4.5 algorithm is an improvement over the ID3 that provides methods for handling numeric attributes, missing values, noisy data, and generating rules from trees [5]. C4.5 supports pruning of decision trees which reduces the problem of overfitting. C4.5 begins with all the training instances associated with the root node. At each node, the algorithm shown in Fig. 1 is executed without backtracking assuming there are T instances associated with a node [16].
-
V. Experimental Results
This section discusses experiments carried out to validate the proposed method of detecting anomalies in student results.
-
A. Experimental dataset
As mentioned in Section III, all the experimental data was obtained from a mock departmental result approval meeting involving five lecturers. Participants at the meeting helped us to identify course-based anomalies for 50 courses and student-based anomalies in 671 student results. In some cases, lecturers disagreed on whether a particular result was anomalous or not. In such cases, we followed the opinion held by majority of the lecturers. In all cases, anomalous results were labelled as positive targets (1), whereas normal results were labelled as negative targets (0).
Table 1. Examples of Course-based Anomalies
|
% % % |
% |
% % No. of |
|
|
As Bs Cs |
Ds |
Es Fs Students |
Anomaly |
|
20 10 20 |
10 |
10 30 45 |
High failure rate |
|
5 10 25 |
30 |
25 5 51 |
Low grades |
|
60 30 5 |
0 |
5 0 80 |
Too many good |
|
grades |
|||
|
Table 2. Examples of Student-based Anomalies |
|||
|
CA Exam |
Total |
||
|
Score Score |
Anomaly Score |
||
|
34 20 |
54 Disproportionate CA |
vs Exam Scores |
|
|
40 49 |
89 Perfect CA score |
||
|
34 60 |
94 Perfect Exam score |
||
|
16 23 |
39 Borderline failure |
||
FormTree(T)
ComputeClassFrequency(T);
If OneClass or FewCases return a leaf;
Create a decision node N;
For Each Attribute A
ComputeGain(A);
N.test = AttributeWithBestGain;
if N.test is continuous find Threshold;
For Each T’ in the splitting of T if T’ is Empty
Child of N is a leaf else
Child of N = FormTree( T’ ) ComputeErrors of N ;
return N
Fig.1. Pseudo code for Constructing C4.5 Decision Trees
The dataset for course-based anomalies had 50 courses instances and seven features. For each of the 50 courses, lecturers decided if any of the three course-based anomalies had occurred by studying a subset of the seven features for the course. Table 3 shows the features that lecturers decided are relevant for the different anomalies. For example, whereas only the proportion of Fs obtained in a course is useful in determining if the high failure rate anomaly occurred, the percentages of As, Bs and Cs as well as the number of students in the class help to determine if there were too many good grades in a course. Statistical properties of the dataset are given in Table 4. The dataset was randomly divided into 40 instances (80%) for training and 10 instances (20%) for testing.
The dataset for student-based anomalies had 671 student result instances and three features. The four student-based anomalies did not always use all the three features. For example, in order to determine if the borderline failure anomaly occurred, lecturers only focused on the student’s total score, and ignored the CA and Exam scores. On the other hand, only the CA score was used to decide if the perfect CA score anomaly had occurred. Table 5 shows features that are relevant to each of the student-based anomalies. Statistical properties of the features in the dataset are given in Table 6. The dataset was randomly divided into 405 (approximately 60%) for training and 266 (approximately 40%) for testing.
Table 3. Relevance of Features to Course-Based Anomalies
|
Feature |
Anomaly |
||
|
High failure rate |
Low grades |
Too many good grades |
|
|
%A |
^ |
||
|
%B |
^ |
||
|
%C |
^ |
||
|
%D |
^ |
||
|
%E |
^ |
||
|
%F |
^ |
^ |
|
|
No. of Students |
^ |
^ |
|
Table 4. Statistical Properties of Features for Course-based Anomalies
|
Feature |
Mean |
Standard Deviation |
Min |
Max |
|
%A |
14.66 |
10.67 |
0.00 |
36.84 |
|
%B |
18.50 |
9.79 |
4.59 |
31.58 |
|
%C |
22.59 |
9.27 |
5.56 |
40.16 |
|
%D |
23.25 |
8.50 |
10.53 |
40.63 |
|
%E |
11.25 |
8.68 |
0.00 |
30.39 |
|
%F |
9.44 |
8.89 |
0.00 |
31.43 |
|
No. of Students |
83.58 |
55.99 |
11.00 |
250.00 |
Table 5. Relevance of Features to Student-based Anomalies
Anomaly
|
Feature |
Disproportionate CA vs Exam Scores |
Perfect CA score |
Perfect Exam score |
Borderlin e failure |
|
CA Score |
^ |
^ |
||
|
Exam |
^ |
^ |
||
|
Score |
||||
|
Total |
^ |
|||
|
Score |
Table 6. Statistical Properties of Features for Student-based Anomalies
|
Feature |
Mean |
Standard Deviation |
Min |
Max |
|
CA Score |
17.45 |
11.01 |
0 |
40 |
|
Exam Score |
36.78 |
14.80 |
0 |
60 |
|
Total Score |
54.23 |
19.01 |
0 |
100 |
-
B. Evaluation criteria
Many evaluation criteria can be used to determine the performance of classification models. Commonly used evaluation criteria for data mining and machine learning journals include sensitivity, specificity and accuracy.
Each of these criteria is briefly discussed below:
-
i. Sensitivity: This measure shows the proportion of positive targets correctly classified as positive. It can be computed using (1). In this research, it shows the percentage of anomalous occurrences which are correctly identified as anomalous. The higher this percentage, the better.
TP
Sensitivity =---------- (1)
TP + FN
-
ii. Specificity: This measure shows the proportion of negative targets which are correctly classified as such. It shows the percentage of normal occurrences which are correctly identified as normal. The higher this percentage, the better. Specificity can be computed using (2).
TN
Specificty =--------- (2)
TN + FP
-
iii. Accuracy: This is the percentage of samples that were correctly classified. It can be computed using (3).
Accuracy =
TP + TN
TP + FP + TN + FN
Where TP = number of true positives, TN = number of true negatives, FP = number of false positives and FN = number of false negatives.
-
C. Experimental setup
All experiments were performed using the Waikato Environment for Knowledge Analysis (WEKA) workbench, which is a collection of popular machine learning algorithms and pre-processing tools. WEKA’s j48 classifier implements the C4.5 decision tree algorithm. The values for two important parameters for the C4.5 algorithm were chosen after running a few initial experiments. The confidence level for pruning was set to 0.25, while the minimum number of instances per leaf was fixed at 2.
-
D. Results and discussion
This section discusses the experimental results for student-based anomalies followed by course-based anomalies. The decision tree generated by WEKA after training for each anomaly is shown. Leaf nodes are shown as rectangles while ovals represent internal nodes. Each leaf node is labelled as normal or anomalous. The first number that appears within the parenthesis represents the number of instances that reach that leaf, while the second number indicates the number of misclassifications. Whenever there is only one number in the parenthesis, it shows that there are no misclassifications for instances that reach that leaf. For example, the leftmost leaf node labelled ‘Normal (42/1.0)’ in Fig. 2 indicates that any instance that reaches this leaf is classified as normal (i.e., not anomalous). Moreover, only one of the 42 instances that reached this node was wrongly classified as normal.
-
1) Results for student-based anomalies
-
a) Disproportionate CA vs exam scores anomaly
Fig. 2 shows the decision tree model built for the disproportionate CA vs Exam scores anomaly. It can be observed that if a student scores at most 12 in the CA and gets more than 40 marks in the examination, the scores are disproportionate and thus anomalous. Similarly, if a student scores between 9 and 12 marks in the CA, followed by an exam score of at least 32 marks, it is considered an anomaly. Both scenarios are cases of low CA score and high exam score. On the other hand, if a student scores at least 12 in the CA but earns only a maximum of 15 marks from the examination, the scores are considered anomalous because of their disproportionality. This is a case of good CA score but poor exam score.
During training, 386 student results were correctly classified while 19 were misclassified, yielding an accuracy of 95.3%. Testing results showed that 245 out of the 266 student results were correctly classified, producing an accuracy of 92.1%.
-
b) Perfect CA score anomaly
This anomaly can easily be detected by checking if the CA score is equal to 40. As shown in Fig. 3, there was no misclassification during training for any of 405 instances. Similarly, all the 266 instances were correctly classified during testing. Consequently, both training and testing accuracies were 100%.
-
c) Perfect exam score anomaly
Like the perfect CA score anomaly, this anomaly can easily be detected by checking if the exam score is equal to 60. As shown in Fig. 4, there was no misclassification during training for any of the 405 instances. Likewise, all the 266 instances were correctly classified during testing. Thus, both training and testing accuracies were 100%.
-
d) Borderline failure anomaly
Fig. 5 shows the decision tree for this anomaly. As can be observed from the figure, the model assumes that all instances are normal. Out of the 405 instances used for training, 403 were correctly classified as normal, while two anomalous instances were misclassified as normal. The training accuracy is 99.5%. Testing results show all 266 instances were correctly classified as normal, producing 100% accuracy. Notice that even though this anomaly can easily be detected by comparing the total score with 39, the decision tree will always fail to detect this anomaly. This can be attributed to the high imbalance in the training dataset: only two out of the 405 training instances were anomalous.
The performance of the decision tree models for student-based anomalies are shown in Table 7. It can be observed that most of the decision tree models produced very good results. However, the decision tree for detecting the borderline failure anomaly was unable to identify any of the two anomalous cases during training, resulting in a sensitivity value of zero. Moreover, during testing, sensitivity could not be computed as there were no anomalous cases in the testing dataset. The poor performance of the decision tree is largely due to the few instances of borderline failure cases in the training dataset.
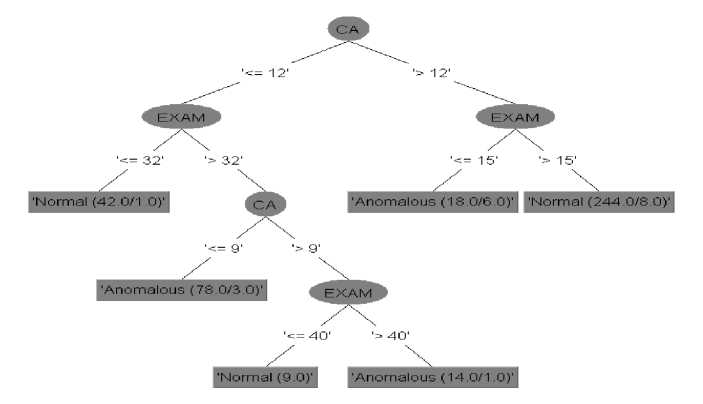
Fig.2. Decision Tree Model for Disproportionate CA vs Examination Scores Anomaly
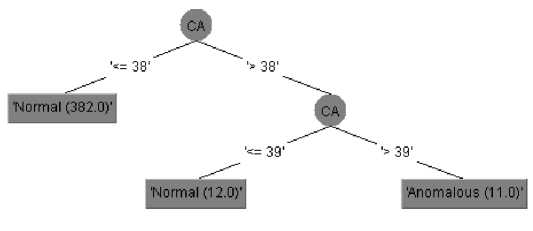
Fig.3. Decision Tree Model for Perfect CA Score Anomaly
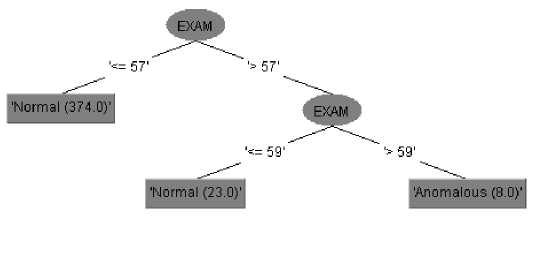
Fig.4. Decision Tree Model for Perfect Exam Score Anomaly
'Normal (405.0/2.0)'
Fig.5. Decision Tree Model for Borderline Failure Anomaly
Table 7. Evaluation of Decision Tree Models for Student-Based Anomalies
|
Anomaly |
Sensitivity (%) |
Specificity (%) |
Accuracy (%) |
|
|
Disproportion ate CA vs |
Training |
91.74 |
96.62 |
95.31 |
|
Exam Scores |
Testing |
92.96 |
91.79 |
92.11 |
|
Perfect CA |
Training |
100.00 |
100.00 |
100.00 |
|
score |
Testing |
100.00 |
100.00 |
100.00 |
|
Perfect Exam |
Training |
100.00 |
100.00 |
100.00 |
|
score |
Testing |
100.00 |
100.00 |
100.00 |
|
Borderline |
Training |
0.00 |
100.00 |
99.51 |
|
failure |
Testing |
* |
100.00 |
100.00 |
* sensitivity could not be computed because there were no anomalies in the testing dataset
-
2) Results for Course-based Anomalies
-
a) Low grades anomaly
Fig. 6 shows the decision tree model for this anomaly. The tree shows that there are low grades in a course when significant proportions of the class score Ds (over 14%) and Es (over 21%). Of the 40 training instances, 39 were correctly classified resulting in an accuracy of 97.5%. For the testing, 9 out of 10 course instances were correctly classified yielding 90% accuracy.
-
b) Too many good grades anomaly
Fig. 7 shows the decision tree model for this anomaly. The model erroneously assumes that course results can never be too good. All the 40 course instances were classified as normal, even though one of them was anomalous. The accuracy on the training and testing datasets were 97.50% and 90%, respectively.
-
c) High failure rate anomaly
Fig. 8 shows the decision tree model for this anomaly. There is a high failure rate when a significant proportion (at least 11%) of the class fails a course. Two of the forty course instances were misclassified during training, whereas two of the ten course instances were misclassified during testing. Thus, training and testing errors were 95% and 80%, respectively.
Table 8 shows the performance of course-based anomaly section models. The decision tree for detecting high failure rate succeeded in identifying all instances of the anomaly, even though it misclassified a few normal instances, resulting in less-than-perfect specificity values. On the other hand, the decision tree for identifying low grades anomalies missed a few anomalous instances but correctly classified all normal instances. In the case of the too many good grades anomaly, sensitivity was zero for training and testing datasets since all course instances were considered normal. The decision tree’s inability to detect any anomaly is as a result of the few instances of the anomaly; there was only one anomalous case each in the training and testing datasets.
-
VI. Detection of Anomalies in Results in a Real Environment
This section discusses an implementation of our result anomaly detection approach in a real environment. A Windows-based anomaly detection tool was developed using Microsoft Visual Basic .NET programming language. The developed tool implemented the decision tree models for each course-based and student-based anomaly. Detecting each anomaly was straightforward, since each decision tree can be reduced to a set of IF THEN constructs in most programming languages. For example, the decision tree of Fig. 2 can be represented by the following IF THEN statement:
IF (CA <= 12 AND Exam > 32 AND CA <=9) OR (CA <= 12 AND Exam > 32 AND CA > 9 AND Exam > 40) OR (CA > 12 AND Exam <=15) THEN
CA is disproportional to Exam
ELSE
Normal Case
END IF
The tool accepts the registration number, name, test score and exam score for each student that enrolled in a particular course from a tab-delimited text file. It then computes and displays the total score and grade for every enrolled student. Thereafter, each student’s scores are examined and any student-based anomaly that is detected is indicated next to the student’s details. In order to detect course-based anomalies, the tool uses the number of students in the class and the proportion of the class that scored the different grades.
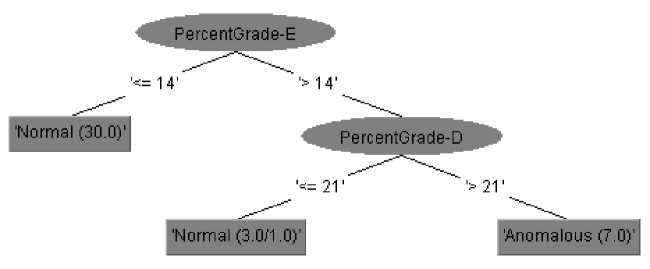
Fig.6. Decision Tree Model for Low grades Anomaly
'Normal (40.0/1.0)'
Fig.7. Decision Tree Model of Too Many Good Grades Anomaly
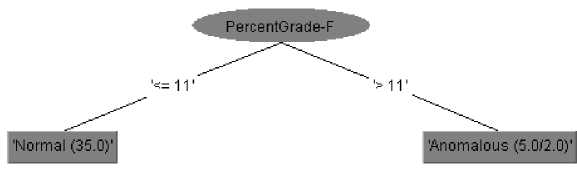
Fig.8. Decision Tree Model for High Failure Rate Anomaly
Table 8. Evaluation of Decision Tree Models for Course-Based Anomalies
|
Anomaly |
Sensitivity (%) |
Specificity (%) |
Accuracy (%) |
|
|
High failure rate |
Training |
100.00% |
94.59% |
95.00% |
|
anomaly |
Testing |
100.00% |
75.00% |
80.00% |
|
Low |
Training |
87.50% |
100.00% |
97.50% |
|
grades anomaly |
Testing |
66.67% |
100.00% |
90.00% |
|
Too many good |
Training |
0.00% |
100.00% |
97.50% |
|
grades |
Testing |
0.00% |
100.00% |
90.00% |
Fig. 9 and Fig. 10 show screenshots of the tool for two different courses, CPT 124 and DCPT 020, respectively. As can be observed from Fig. 9, the low grades anomaly was identified in CPT 124 in addition to several studentbased anomalies. However, in Fig. 10, even though only a few student-based anomalies were identified in DCPT 020, two course-based anomalies namely the low grades and high failure rate anomalies were detected.
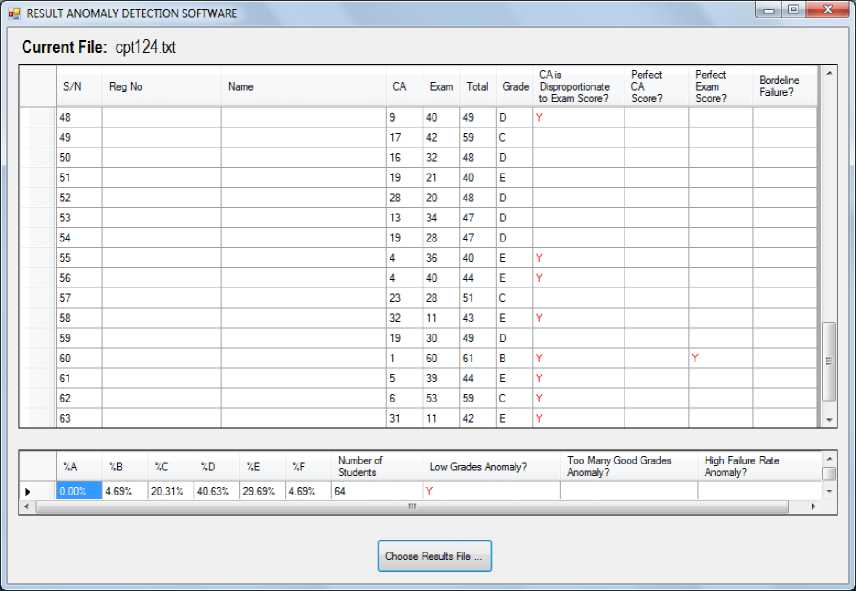
Fig.9. Screen shot from developed tool for CPT 124, having several student anomalies and the “Low grades” course-based anomaly
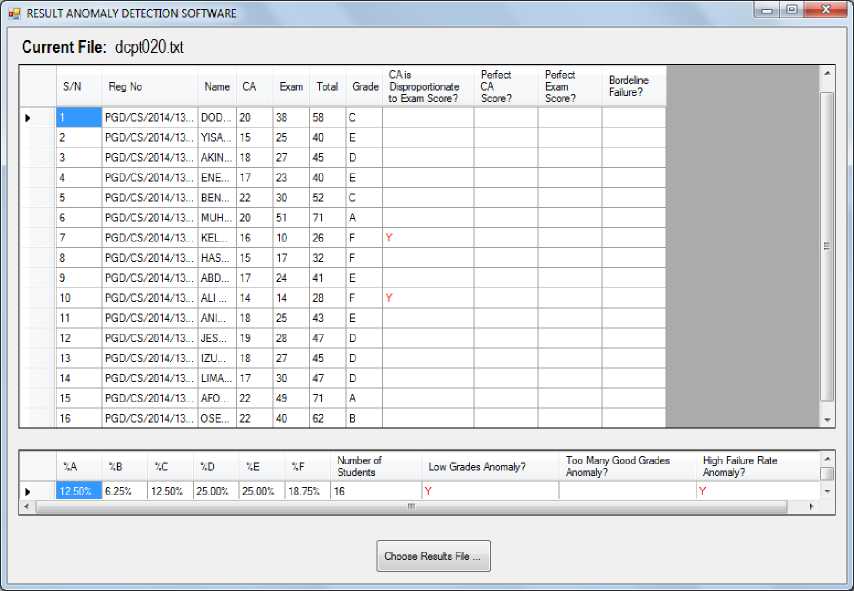
Fig.10. Screen shot from developed tool for DCPT 020, with few student-based anomalies and two course-based anomalies
-
VII. Conclusion and Future Work
This research showed how decision tree models can be used to detect anomalies in student results. Experimental results indicated that the decision tree models efficiently detected anomalies in student results in most cases. However, when there were few anomalous instances in the training dataset, the decision trees were poor at identifying anomalies.
To address the issue of poor performance as a result of insufficient anomalous instances in the training dataset, we plan to improve our anomaly detection system in the following ways: (i) whenever our tool is used to detect anomalies, the student results input to the system are appended to the training dataset, which will be used to periodically build new decision trees. (ii) users would be allowed to provide feedback to the system whenever the tool misses anomalies (false negative case) or when it misclassifies normal results (false positive case). This feedback will also be incorporated into the training dataset.
Our result anomaly detection tool is expected to drastically minimize wastage of man hours spent in result approval meetings because officials who prepare student results can use the tool to identify anomalies and prepare satisfactory explanations prior to the result approval meetings. For example, when a disproportionate CA vs exam scores anomaly is being discussed during a meeting, an official who has identified the anomaly beforehand and checked his/her records can easily explain that a student performed very well in the CA, but poorly in the exam because the student fell ill at the end of the semester.In future work, we plan to use decision trees to track anomalies in students’ computed end-of-semester results, such as when a student’s performance drops significantly (so that the student can be advised) or when it improves considerably (so that the student can be encouraged).
Acknowledgment
The authors would like to acknowledge the five lecturers from the School of Information and Communication Technology, Federal University of Technology, Minna, Nigeria who described and identified the different anomalies that occur in student examination Authors are also grateful to the anonymous reviewers whose valuable comments helped to improve the original manuscript.
References Detecting Anomalies in Students' Results Using Decision Trees
- G. A. Miller, "The magical number seven, plus or minus two: some limits on our capacity for processing information," Psychological Review. 63(2), p. 81, 1956.
- S. Agrawal and J. Agrawal, "Survey on anomaly detection using data mining techniques," Procedia Computer Science, 60, pp. 708-713, 2015.
- V. Chandola, A. Banerjee and V. Kumar, "Anomaly detection: a survey," ACM Computing Surveys (CSUR), 41(3), p. 15, 2009.
- K. H. Rao, G. Srinivas, A. Damodhar and M. V. Krishna, "Implementation of anomaly detection technique using machine learning algorithms," International Journal of Computer Science and Telecommunications, 2(3), pp. 25-31, 2011.
- S. Ruggieri, "Efficient C4.5 [Classification Algorithm]," . Knowledge and Data Engineering, IEEE Transactions on, 14(2), pp. 438-444, 2002.
- T. M. Lakshmi, A. Martin, R. M. Begum and V. P. Venkatesan, "An analysis on performance of decision tree algorithms using student's qualitative data," I.J. Modern Education and Computer Science, 5(3), pp. 18-27, 2013.
- S. Yoo and S. Kim, "Two-phase malicious webpage detection scheme using misuse and anomaly detection," International Journal of Reliable Information and Assurancee, 2(1), pp. 1 – 9, 2014.
- B. Viswanath, M. A. Bashir, M. Crovella, S. Guha, K. P. Gummadi, B. Krishnamurthy and A. Mislove, "Towards detecting anomalous user behaviour in online social network". Proceedings of 23rd USENIX Security Symposium. San Diego, CA: USENIX, USENIX Security Symposium (USENIX Security 14), 2014, pp. 223-238.
- Y. Wang, D. Li, Y. Du and Z. Pan, "Anomaly detection in traffic using L1-norm minimization extreme learning machine," Neurocomputing, 149 (2015), pp. 415-425, 2015.
- A. S. Aneetha and S. Bose, "The combined approach for anomaly detection using neural networks and clustering techniques," Computer Science & Engineering, 2(4), pp. 37 – 46, 2012.
- S. Zhao, M. Chandrashekar, Y. Lee and D. Medhi, "Real-time network anomaly detection system using machine learning," 11th International Conference on the Design of Reliable Communication Networks, Kansas City, United States, 2015, pp. 267-270.
- B. Vrat, N. Aggarwal and S. Venkatesan, "Anomaly detection in IPv4 and IPv6 networks using machine learning," 12th IEEE India International Conference (INDICON), New Delhi, India, December 2015, pp. 1-6.
- C. Romero and S. Ventura, "Data mining in education," Wiley Interdisciplinary Reviews: Data Mining and Knowledge Discovery, 3(1), pp. 12-27, 2013.
- L. Rokach and O. Maimon, "Decision trees" - Chapter 9. In Data Mining and Knowledge Discovery handbook, pp. 165-192, 2005.
- Y. Li, H. Xing, Q. Hua, and X. Wang, "Classification of BGP anomalies using decision trees and fuzzy rough sets," In Systems, Man and Cybernetics, IEEE International Conference on (SMC), October 2014, pp. 1312–1317.
- I. H. Witten and E. Frank,. Data mining: practical machine learning tools and techniques. Morgan Kaufmann, 2011.
