Detection of botnet using flow analysis and clustering algorithm

Author: Prachi, Sherya, Shruti, Vanshika
Journal: International Journal of Modern Education and Computer Science @ijmecs
Article in issue: 5 vol.11, 2019.
Free access
With the increase of digital data on the internet, computers are at higher risk of getting corrupted through cyber-attacks. Criminals are adopting more and more sophisticated techniques to steal sensitive information from the web. The botnet is one of the most aggressive threats as it combines lots of advanced malicious techniques. Detection of the botnet is one of the most serious concerns and prominent research area among the researchers. This paper proposes a detection model using the clustering algorithm to group bot traffic and normal traffic into two different clusters. Our contribution focused on applying K-means clustering algorithm to detect botnets based on their detection rate (true and false positives). Experimental results clearly demonstrate the fact that with the help of clustering we were able to separate the complete dataset into two entirely distinguishable clusters, where one cluster is representing the botnet traffic and other one representing the normal traffic.
Botnet, Flow Analysis, Machine Learning, Network Traffic, Clustering, Detection
Short address: https://sciup.org/15016850
IDR: 15016850 | DOI: 10.5815/ijmecs.2019.05.04
Text of the scientific article Detection of botnet using flow analysis and clustering algorithm
Published Online May 2019 in MECS DOI: 10.5815/ijmecs.2019.05.04
The Internet is the largest and most versatile source of information in the world today. People's dependency on the internet for their daily tasks and business model is increasing day by day. Despite being the widest source of data, information on the internet is prone to threats and is not secure. With continuous advancement in technologies, criminals have also gained expertise in these technologies to commit crimes against individuals to physically or mentally annoy them to fulfill their personal desires using computer networks in the form of cybercrime. These cyber-attacks can be spread with the help of botnets which is used to launch several distributed attacks. Recent cybersecurity research justifies that more than 40% of computers are infected with some kind of bot and hence is a part of some malicious activities of a botnet [1][2]. Botnet provides a platform to conduct a wide range of malicious attacks and hence is regarded as one of the most serious threat on the internet [3].
Various techniques have been proposed by authors for botnet detection in recent past. These techniques are explained through a series of papers but several challenges still remain unaddressed.
In general, botnet detection approaches can be categorized into 2 categories: active and passive. In active monitoring, command and control server gets notified about the botnet analysis being carried out through injecting test packets which generate extra traffic in the network, leading to early detection of botnet detection system whereas, in passive botnet detection the analysis is performed with the help of spoofing. In this type of detection method, we just have to observe network traffic and look for suspicious communication without any increase in network traffic.
Intrusion Detection Systems (IDS) can easily incorporate packet inspection techniques. IDS is one of the most effective technology for identifying and analyzing the traffic against network attacks (Denning, 1987 [5]). Majority of IDS aimed for detection of a botnet are rule-based (Zhang et al., 2005; Roesch, 1999 [6]). In a rule-based IDS, signatures of incoming traffic and previously identified botnet traffic is matched. This mechanism does not work when network traffic is rapidly changing because rule-based IDS are built on a specific rule set which does not work on all kind of traffic. As our traffic varies, rules to detect that traffic also need to be changed making it an inefficient and tedious process to deal with.
To overcome these problems, authors in the literature suggested usage of flow record analyses. In this technique, packet headers are analyzed after clustering them in a flow (Strayer et al, 2008 [7] ; Zhao et al, 2012).
According to Zeidanloo et al, 2010 [8] and Wurzinger et al, 2009 [9], packet headers are used by flow-based analysis and payload is used by behavior-based analysis and some of them use combination of both.
Apart from flow-based and behavior-based analysis system, authors also investigated on two other kind of botnet detection systems: BotHunter (quickly identify and isolate infected systems, and figure out who really owns your computers) (Gu et al, 2007 [10]) and Snort (IDS) (Roesch, 1999 [6]). Analysis on CTU-13 (13 botnet datasets) (Gracia et al, 2014 [11]) determined that the flow-based detection method outperformed all other detection methods.
Therefore, in this paper, we will focus on building a detection model that uses only packet headers for botnet detection. We would also be using machine learning techniques to automate the process and provide an edge over other detection models.
The remainder of the chapter is presented as follows: Related work regarding botnet is described in section 2. The proposed methodology is summarized in Section 3. Section 4 evaluates and describes the results. The conclusion is presented in section 5
-
II. Related Works
Since, last few years, botnet detection is one of the most leading research areas among researchers. Many researchers in the past have mentioned their techniques for detecting botnet but not all were able to find the solution for recent botnets. A variety of encryption and obfuscation techniques are being used by bots to hide their malicious content so they are not accurately detected through payload analysis. Payload analysis is also timeconsuming in nature.
BotHunter, presented in 2007, is a framework for botnet detection, based on Snort (Gu et al, 2007 [10]). BotHunter closely monitors network traffic to detect all phases of botnet lifecycle. After monitoring, payload analysis is performed by the BotHunter on the basis of various Snort rules. After that, a correlation engine is utilized to compute the score which determines the probability of network infection. It has its own pros and cons. Bothunter is precise if bot traverses all phases but doesn’t work with encrypted data because it is based on payload analysis.
Developed in 2008, BotMiner was designed for botnet detection based on the common group behavior of individual bot belonging to the same botnet (Gu et al, 2008 [12]). It analyses and clusters a similar kind of behavior that is continuously being performed on the various machines in the network. BotMiner follows a two-phase clustering approach. In the first phase, clustering is done on the basis of a similar kind of communication behavior. In the second phase, grouping is done on the basis of malicious activities. BotMiner achieved a 99% detection rate with approximately 1% false positive rate.
Zeidanloo et al, 2010 [8], proposed a system for general Internet Relay Chat and Peer-to-Peer based botnets focusing on the behavioral and communication similarity amid many bots of a botnet.
In 2012, Zeidanloo et al [13], proposed a methodology similar to BotMiner for detection of a botnet by analyzing characteristics of network traffic. It is a three-stage approach. Stage 1: filtering, Stage 2: malicious activity detection and Stage 3: monitoring of network traffic. However, the accuracy of this methodology was not evaluated.
All the above-mentioned methodologies are based on the group behavior analysis where botnets execute malicious behavior prior to their detection, making them unsuitable for early detection. They are not suitable if a single machine is compromised by the botnet on the observed network.
Giroire et al, 2009 [14] presented an approach which was based on communication at the host end and does not require any group behavior analysis. This methodology was associated with an assumption that bot needs continuous communication with their bot-master to carry out their desired functions. This communication was in the form of command and responses leading to some kind of regularity observed during a longer period of time. Authors used a white-list of trustworthy destinations to differentiate normal and malicious destinations. This methodology generated a lesser number of false positives on real-world network traffic.
Zeidanloo et al [16] find botnets without prior knowledge. They utilize behavior and communication patterns of machines to identify the presence of botnet.
A comparison was done by K. Huseynov et al. [17] between the algorithms K-means and AntColony to determine decentralized botnets. Host-based features were used by them in order to quickly and accurately detect botnets. According to the authors, K-means offer a higher detection rate and low false positives
From the discussion above, it is seen that the majority of the botnet detection methodologies can only detect a particular type of botnet. This paper proposes a botnet detection system to detect different type of botnets with high accuracy and a lesser number of false positives.
-
III. The Proposed Work
This paper harnesses the benefits of flow analysis (analysis of packet flows) for botnet detection using unsupervised machine learning technique-Clustering.
Earlier detection techniques were more focused towards payload analysis of packets. However, such techniques are now obsolete. This is because payload analysis fails when the network traffic is high or content is hidden using data encryption or code obfuscation technique. Moreover, packet inspection techniques raise privacy-related issues.
Therefore, this paper uses header analysis for botnet detection. The network flows are fed into a machine learning algorithm to yield a model with high accuracy, adaptability and novelty detection.
Our work has been divided as follows: dataset collection thereafter analysis tools and techniques and finally we interpret and discuss our results.
-
A. DataSet
A good dataset captures real-world traffic comprising of all important features. In this paper, we have used the CTU-13 dataset [18] that was collected in 2011 by the CTU University. The traffic captured consists of botnet traffic (from infected hosts), normal traffic (from verified hosts) and background traffic.
The malicious dataset comprises of data from 6 different botnets namely, Neris, Rbot, Virut, Menti, Sogou and Murlo [18]. The normal and background traffic is collected from 20 virtual machines running in the university network [19]. The dataset is made of 13 scenarios captured from various botnet samples. Every scenario comprises a particular malware that used different protocols and executed various actions as shown below:
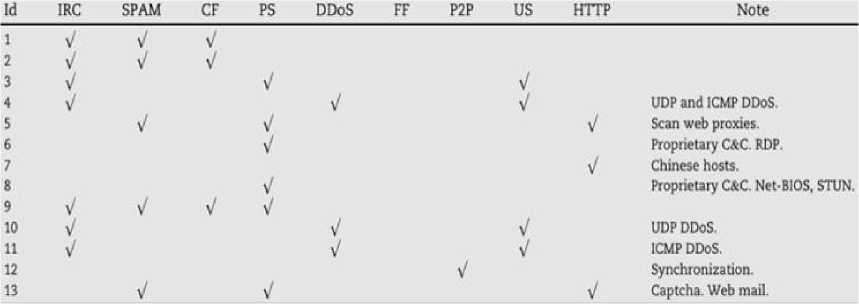
Fig.1. Characteristics of botnet scenarios
The scenario captures three types of traffic-botnet, normal and background traffic in a pcap file.
-
B. Data collection and Analysis Tools
In this paper, different tools were used to analyze the above-collected data using various machine learning algorithms in Weka . Since the CTU-13 dataset was captured in 2011 so there is a high possibility of missing the latest type of network traces. Consequently, in addition to the above-mentioned dataset, we also collected our data in order to capture the latest real-time network traffic.
Wireshark [19] is an open source tool used for network analysis, traffic capturing, troubleshooting network problems etc. It is also known as a packet sniffer and it captures information like the source and destination of a packet, time of arrival, the protocol used, length of the packet and some other additional information. In this paper, we have captured network traces from Wireshark in the form of a pcap (packet capture) file.
Nfdump is an open source software that is compatible with most of the Cisco Netflow versions [20]. Nfdump can capture flow from real-time traffic with the help of Softflowd or can export flows from already captured traffic. Nfdump extracts 48 features from the packet flow by default. In this paper, we have used Nfdump t o build network flows out of the captured data.
WEKA (Waikato Environment for Knowledge) [21] is a collection of machine learning algorithms for data mining tasks. It is a free and open source software written in Java. Weka can be used for:
Clustering is an example of unsupervised machine (used for unlabelled data) learning techniques used to associate similar objects within a group. It can be done in 2 different ways: Partitional Clustering and Hierarchical clustering [22]. Partitional clustering has been used in this paper because of its higher efficiency as seen experimentally.
Classification is the process of identifying the category of a new observation on the basis of an input training (labeled) dataset whose category membership is known [23]. Weka provides the use of the following classifiers:
Bayes: It is a statistical classifier based on the Bayes Theorem that assumes the features are independent of each other. This assumption leads to a loss in accuracy.
Support Vector Machine: It is a binary classifier that outputs a hyperplane, separating the two classes.
Trees: The outcome of the algorithm is a tree in which a node represents a choice and the leaf represents the decision.
Neural Network: The algorithm mimics the functioning of a human brain. The network consists of nodes (called neurons) arranged in layers. Network accepts an input does some processing and passes on the output to the next layer. The final output is obtained from the last layer.
Regression: It used to map the relationship among variables (dependent and explanatory) and predict a continued valued output based on the given input. The regression model can be of different type based on the number of explanatory variables and the relationship between the variables as shown in the figure below.
Authors have used clustering in this paper to find structure in the collection of unlabeled data available and hence differentiate abnormal traffic. The dataset used in this paper is unlabelled because no attributes of the data have any tag associated with it. Tags are helpful in classifying objects into categories.
Although clustering can be done with a variety of tools, this paper uses W eka for clustering due to its impressive visualization-graphs, trees, charts etc. and striking user interface which helps in the quick interpretation of results.
-
IV. Results and Discussion
In K-means clustering (also known as hard C-means) each element is assigned to a single cluster whereas in C-means clustering (soft C-means) there can be overlapping between clusters [24].
C-means tends to be slow due to more work and calculations required.
Therefore, authors have used the K-means clustering algorithm because it offers more simple and robust features. It is also efficient in terms of cost and its complexity is of the order of O(K*d*n), where k is the number of clusters, d is the number of iterations and n is the sample size.
K-means clustering groups data points into k clusters based on the distance measured from the cluster center (Centroid).
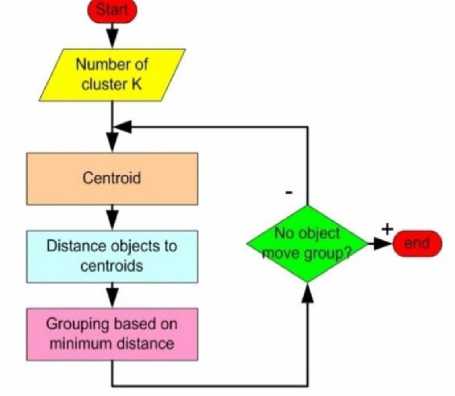
Fig.2. K-means clustering flow chart
Manhattan Distance:
n
-
d man ( x , У) = EI( x - y ) (2)
= 1
where, (x i ,y i ) is the ith data point and n is the sample size.
Stepwise procedure to perform Clustering:
Step 1 : The entire dataset, CTU-13 and our selfgenerated network traces, were replayed in Wireshark to get a thorough mix of traffic.
Step 2 : Thereafter, the entire dataset was pre-processed in Nfdump to generate network flows.
Step 3 : Nfcapd [25] facility was used to convert the generated network flows in the form of a CSV format.
Step 4 : Weka is used to perform clustering on the CSV file obtained above.
Step 5 : K- means clustering is used by specifying the K value equal to 2, to differentiate the dataset into 2 clusters, malicious and non-malicious traffic.
Step 6 : Subsequently, we have chosen Euclidean distance as the distance measure to compute centroids because it has been shown in the literature that Euclidean distance shows more distortion in comparison to Manhattan distance and hence gives better results [26].
Step 7 : One of the attributes in k-means clustering is seed value. It is used to generate a randomized number which in turn is used for cluster assignments. It is suggested that the algorithm is run for different values of seed and the performance is evaluated and compared accordingly. However, during evaluation its value is kept as default because in large datasets changing the value of seed doesn’t impact the results significantly [27].
Step 8 : With the aforementioned inputs, the algorithm is run on Weka and results are interpreted as follows.
-
A. Interpretation
After analyzing the results, it became clear that the algorithm clustered the entire dataset into 2 clusters and took 3 iterations to complete. The sum of squared error within a cluster which depicts variation amongst the cluster has come out to be 3519.852970330293 units. Therefore, it is evident that the traffic used for clustering depicts variation in behaviour, i.e. the traffic contains a good mix of both botnet and normal type of network flows.
kMeans
It has 2 classical methods for measuring distances: Euclidean Distance:
deuc ( x , У ) =
n
. ECx. - y. )2
V / = 1
where, (x i ,y i ) is the ith data point and n is the sample size.
Number of iterations: 3
Within cluster sum of squared errors: 3515.852970330293
Initial starting points (random):
Cluster 0: 1799,38:43.5,147.32.84.165,195.88.191.59,TCP,60
Cluster 1: 331,36:45.9,122.224.6.164,147.32.84.165,TCP,2974
Missing values globally replaced with mean/mode
-
Fig.3. Weka clustering output
The table below shows the 2 clusters and the value of each attribute (average) for that cluster in the form of a matrix. It can be implied from the matrix that:
Majority of the packets in clusters use the TCP protocol.
Cluster one clearly owns a majority (71%) over the other.
Cluster 0 has packets carrying normal data and cluster 1 has malicious packets.
Final cluster centroids:
Cluster#
Attribute Full Data 0 1
(1999.0) (1417.0) (582.0)
No. 1000 963.2505 1040.7801
Time 36:57.8 36:57.8 36:46.5
Source 147.32.84.165 147.32.84.165 195.38.191.59
Destination 147.32.84.165 195.86.191.59 147.32.84.165
Protocol TCP TCP TCP
Length 423.6968 76.1496 1269.8729
-
Fig.4. Final cluster centroids
Cluster 0: This cluster is purely in majority with 71% of the points lying in cluster 0. Cluster 0 mainly uses the TCP protocol and has an average length of 76.15 units. It can be noted that most of the communications in cluster 0 are from the IP address 147.32.84.165 to 195.88.191.59 both being legitimate addresses. The IP 147.32.84.165 points to the source device in the university network and the IP 195.88.191.59 points to an authentic server used by the university during capturing of traffic.
Cluster 1: This cluster contains 29% of the data points. This cluster also uses TCP protocol and has an average length of 1269.87 units. Most of the communications in this cluster has a source IP of 165.88.191.59 which is a rogue IP address. The identity of the rogue IP address was confirmed using findmyip [28] (IP location finder) which indicated the host location of 165.88.191.59 as Russia. 147.32.84.165 is the most common destination, which is legitimate.
The figure below shows the dispersion of traffic instances over cluster 0 and cluster 1 in a graphical form.
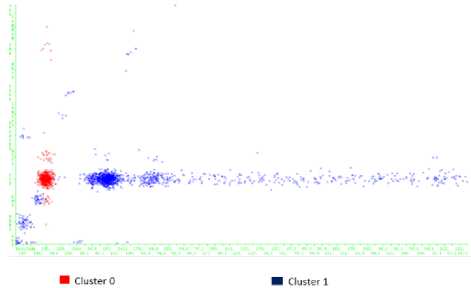
X= Destination Y= Source
Fig.5. Dispersion of traffic instances over clusters
-
B. Evaluation
Since clustering is an unsupervised machine learning technique so it is not possible to determine true positives or false positives. Some other evaluation measures are required to evaluate the accuracy of the algorithm. In this paper, the following novel evaluation measures have been used:
Silhouette Coefficient:
b - a max(a, b)
-
a : average distance between a sample point and all other points in the same cluster
-
b : average distance between a sample point in one cluster with all other points in another cluster.
0.8
0.7
0.6
0.5
The higher value of s relates to a model with well-defined clusters. The value of s ranges between -1 to 1. If s=0, there is an overlapping between clusters.
Table 1. Silhouette Coefficient for K-means and C-means clustering n=2 clusters
Silhouette Index
K-means 0.70497875
C-means 0.588200401
Silhouette Index
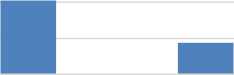
Fig.6. Variation in Silhouette Coefficient
Calinski-Harabaz Index: Calinski-Harabaz Index is the ratio of dispersion within and between clusters, a higher value indicates well-defined clusters [13]. The following formula is used to determine the index:
s ( k ) =
Tr ( Bk ) * N - k
Tr ( Wk ) k - 1
Here, k is the number of clusters
W k is the dispersion within the cluster B k is the dispersion between the clusters N is the number of data points
k
Wk = ££ ( X — c q X X — c q ) (5)
q = 1 x e Cq
B k = T. n q ( c q - c lCq - c T (6)
q where Cq is the set of points in cluster q cq is the centre of cluster q nq is the number of points in cluster q k is the number of clusters x represents the data point attribute c is the centre of E
Table 2. Calinski-Harabaz Index for K-means and C-means clustering n=2 cluster
Calinski-Harabaz Index
K-means 0.71527824
C-means 0.59985247
Calinski-Harabaz Index
0.75
0.7
0.65
0.6
0.55
0.5


Fig.7. Variation in Calinski-Harabaz Index
-
V. Conclusions
This paper proposed a highly accurate botnet detection model using clustering techniques. Apart from detection accuracy, some of the most essential features of botnet detection include early detection, novelty detection and adaptability of the model. This paper builds a botnet detection system that addresses two of the above challenges namely early and novelty detection. The evaluation methods that have been used above are usually higher for convex clusters, hence new or improving existing measures is required to generalize their behavior especially in case of density based clusters obtained through DBSCAN. Use of other clustering algorithms like extended K-means, canopy clustering or hierarchical clustering is also intended to evaluate the clusters hence formed.
References Detection of botnet using flow analysis and clustering algorithm
- Hogben, G. (ed.), “Botnets: Detection, measurement, disinfection and defence,” ENISA, Tech. Rep., 2011.
- Symantec Inc.: Symantec global internet security threat report, trends for 2010. Security Report XVI, Symantec Inc.
- Raffaello Perrotta, and Feng Hao “Botnet in the Browser”, IEEE Security and Privacy Magazine 16(4), Sept. 2017
- P Wang, B Aslam, CC ZoU, (2010). Peer-to- peer botnets. Handbook of Information and Communication Security, pp. 335-350.
- Denning, D. E. (1987). An intrusion-detection model. IEEE Transactions of Software Engineering, 13(2), 222–232.
- Roesch, M. (1999). Snort—Lightweight intrusion detection for networks. In Proceedings of the 13th USENIX conference on System administration (pp. 229-238), Seattle, Washington.
- Strayer W.T., Lapsely D., Walsh R., Livadas C. (2008). Botnet Detection Based on Network Behavior. In: Lee W., Wang C., Dagon D. (eds) Botnet Detection. Advances in Information Security (vol 36, pp. 1-24). Springer, Boston, MA.
- Zeidanloo, H. R., Manaf, A. B., Vahdani, P., Tabatabaei, F., & Zamani, M. (2010). Botnet detection based on traffic monitoring. In International Conference on Networking and Information Technology (pp. 97-101), Manila, Philippines.
- Wurzinger P., Bilge L., Holz T., Goebel J., Kruegel C., Kirda E. (2009) Automatically Generating Models for Botnet Detection. In: Backes M., Ning P. (eds) Computer Security-European Symposium on Research in Computer Security (Vol 5789, pp. 232-249). Springer, Berlin, Heidelberg.
- Gu, G., Porras, P., Yegneswaran, V., Fong, M. (2007). BotHunter: Detecting malware infection through IDS-driven dialog correlation. In Proceedings of 16th USENIX Security Symposium on USENIX Security Symposium (pp. 167–182), Boston, MA, USA.
- García, S., Grill, M., Stiborek, J., Zunino A. (2014). An empirical comparison of botnet detection methods. Computers and Security Journal, 45, 100-123.
- Gu, G., Perdisci, R., Zhang, J. and Lee, W. (2008). BotMiner: clustering analysis of network traffic for protocol- and structure- independent botnet detection. In Proceedings of the 17th conference on Security symposium (pp. 139-154). San Jose, CA.
- Zeidanloo H. R., Rouhani S. (2012). Botnet detection by monitoring common network behaviors. Lambert Academic Publishing.
- Giroire F., Chandrashekar J., Taft N., Schooler E., Papagiannaki D. (2009) Exploiting Temporal Persistence to Detect Covert Botnet Channels. In: Kirda E., Jha S., Balzarotti D.(eds) International Workshop on Recent Advances in Intrusion Detection: Recent Advances in Intrusion Detection. Lecture Notes in Computer Science (vol 5758, pp. 326-345). Springer, Berlin, Heidelberg
- Francisco Villegas Alejandre, Nareli Cruz Cort´es, Eleazar Aguirre Anaya. Botnet Detection using Clustering Algorithms. In : Instituto Polit´ecnico Nacional,Centro de Investigaci´on en Computaci´on, Mexico City,Mexico
- Huseynov, K., Kim, K., Yoo, P.: Semi-supervised Botnet Detection Using AntColony System. In: 31th Symposium on Cryptography and Information Security,Kagoshima, Japan, Jan. 21-24 (2014)
- Zeidanloo HR, Manaf AB, Vahdani P, Tabatabaei F, Zamani M. Botnet detection based on trafc monitoring. In: 2010 international conference on networking and information technology (ICNIT). New York: IEEE; 2010. p. 97–101.
- https://mcfp.weebly.com/the-ctu-13-dataset-a-labeled-dataset-with-botnet-normal-and-background-traffic.html
- An empirical comparison of botnet detection methods" Sebastian Garcia, Martin Grill, Honza Stiborek and Alejandro Zunino. Computers and Security Journal, Elsevier. 2014. Vol 45, pp 100-123. http://dx.doi.org/10.1016/j.cose.2014.05.011
- http://whatis.techtarget.com/definition/Wireshark
- Prachi, Detection of Botnet based attacks on network: using Machine Learning Techniques, Handbook of Research on Network Forensics and Analysis Techniques, Chapter 7, pp. 101-116, Apr 2018
- https://www.scribd.com/doc/90174459/Data-Analysis-using-WEKA
- Zeynel Cebeci, Figen Yildiz, Comparison of K-Means and Fuzzy C-Means Algorithms on Different Cluster Structures, Journal of Agricultural Informatics, 2015 Vol. 6, No. 3:13-23
- Ying Zhao and George Karypis, Comparison of Agglomerative and Partitional Document Clustering Algorithms, April 2002,
- https://en.wikipedia.org/wiki/Statistical_classification
- https://www.systutorials.com/docs/linux/man/1-nfcapd/
- Archana Singh, Avantika Yadav, Ajay Rana, K-means with Three different Distance Metrics, International Journal of Computer Applications, Volume 67– No.10, April 2013
- http://www.findmyip.org
