Detection of Rows in Agricultural Crop Images Acquired by Remote Sensing from a UAV

Author: Ramesh K N, Chandrika N, Omkar S N, M B Meenavathi, Rekha V
Journal: International Journal of Image, Graphics and Signal Processing(IJIGSP) @ijigsp
Article in issue: 11 vol.8, 2016.
Free access
Detection of rows in crops planted as rows is fundamental to site specific management of agricultural farms. Unmanned Aerial Vehicles are increasingly being used for agriculture applications. Images acquired using Low altitude remote sensing is analysed. In this paper we propose the detection of rows in an open field tomato crop by analyzing images acquired using remote sensing from an Unmanned Aerial Vehicle. The Unmanned Aerial Vehicle used is a quadcopter fitted with an optical sensor. The optical sensor used is a vision spectrum camera. Spectral-spatial methods are applied in processing the images. K-Means clustering is used for spectral clustering. Clustering result is further improved by using spatial methods. Mathematical morphology and geometric shape operations of Shape Index and Density Index are used for spatial segmentation. Six images acquired at different altitudes are analysed to validate the robustness of the proposed method. Performance of row detection is analysed using confusion matrix. The results are comparable for the diverse image sets analyzed.
Row Crops, Unmanned Aerial Vehicle, KMeans, UAV Remote Sensing, Mathematical morphology
Short address: https://sciup.org/15014084
IDR: 15014084
Text of the scientific article Detection of Rows in Agricultural Crop Images Acquired by Remote Sensing from a UAV
Published Online November 2016 in MECS
Today, UAVs are being increasingly used for Agriculture applications in remote sensing[1][18]. Remote sensing from a UAV known as Low Altitude remote Sensing (LARS) compliments traditional remote sensing using satellites. Several characteristics of UAV and remote sensing from UAV lend itself well to agricultural applications. UAVs images can be acquired even on cloudy days, they provide greater flexibility in scheduling imagery acquisition helping in temporal analysis. Other advantages of UAVs are their lower cost, and the lower probability of serious accidents compared with piloted aircraft. UAVs can fly at low altitudes, allowing for acquisition of high spatial resolution imagery which can be used to observe small individual plants and patches. Torres-Sanchez [2] used a conventional UAV with vision spectrum and multispectral cameras for vegetation detection in herbaceous crops of maize, wheat and sunflower. Berni [6] described remote sensing products using rotatingwing and fixed-wing UAVs equipped with commercial off-the-shell (COTS) thermal and narrow band spectral imaging sensors. Results obtained with a low cost UAV system for vegetation monitoring applications yielded comparable estimations, if not better, than those obtained with more traditional manned airborne sensors. Salim Malek [8] described a method based on computer vision for detection and localization of crop rows, especially of small-grain crops, was described. The method was intended for use in a system for automatic guidance of agricultural implements in selective treatment of rows and/or inter-row spaces.
Row detection and counting in crops is an important activity in site specific monitoring and management of farms. Row crop detection is fundamental to determining canopy, crop vigor and crop density. Rows detection helps in detection of crop specific regions apriori to provide more reliable correlation of NDVI and other parameters [3]. It also finds application in autonomous path planning and navigation of ground robots. Manual detection of row crops is more precise however they are laborious and time consuming. Automated detection of rows by analysis of images acquired by remote sensing from a UAV provides an interesting option.
Several researches have carried out row detection using aerially acquired images. Comba [4] described a new algorithm for detection of grape vine rows based on dynamic segmentation, Hough space clustering and total least squares to automatically detect the grape vine rows. Puletti [5] used unsupervised classification for grape vine row detection. The red channel of RGB image was pre processed using a high pass filter and was later analyzed using Ward’s modified technique.
Salim Malek [8] classified crop rows with in maize crop-field to distinguish small weed seedlings at early stages for in-season site specific herbicide treatment. An object-based image analysis (OBIA) procedure was applied. Senthilnath et. al. [7] used Spectral-spatial methods in processing of RGB images acquired by remote sensing from UAV. This technique [9] leverages spectral clustering of spectral vision band the results of spectral clustering is further improved by performing spatial segmentation.
From authors survey of literature it is observed that there is no evidence of use of spatial methods for detection of row crops in RGB image acquired by remote sensing from a UAV. In this paper, we propose an unsupervised clustering method followed by spatial method detecting and counting rows. K-means algorithm is used to spectrally cluster the RGB image data set. Clustering is further improved by use of spatial segments which includes the mathematical morphological operations of Skeletonization, region growing and segmentation based on geometric properties of shape index and density index. Further Houghline transform is used to detect the lines. The lines are aggregated to arrive at the number of rows in the crop using a novel aggregation technique.
The paper is organized as follows. Section 2 describes the methodology. The results are discussed in section 3. The conclusion is summarized in section 4.
-
A. UAV Description and Data Acquisition
In this study, UAV is built using components off-the shelf. In this work, the UAV used is a quadcopter which comes under the multi-rotor aircraft category [7]. The camera used in UAV is a Raspberry PI which is having 2592×1944, 5 mega pixels sensor resolutions with very high HD video resolutions. Images are taken in an open field tomato crop acquired by UAV with different altitudes. It is having very low cost and low endurance. To have a stable platform during image acquisition VTOL is used in a quadcopter. The payload is of 0.1kg and weight during take-off is 2.1kg.
The spatial resolution of the frames extracted in an image are only based on the altitudes took from an UAV.
Due to change in an altitude as the quadcopter flies there may be vary in the altitudes, depth and in spatial resolutions. The video is analyzed only in an offline mode to have a better aerial view of the tomato plant crop. Only when tomato crops shed their leaves, fruits will be visible in aerial view. From the video taken using UAV, the images are cropped when the row crops are clear to analyze.
-
II. Methodology
In this paper, a Spectral-spatial method is proposed used for detection and counting of row crops in the RGB image dataset acquired using remote sensing from a UAV. Unsupervised clustering is used for spectral classification. The results of clustering are improved by the use of spatial segmentation. Houghline transform is used to detect lines. Several line more than the number of rows is detected. The lines are aggregated using a novel technique to arrive at the number of crows. The proposed method is depicted in Fig (1).
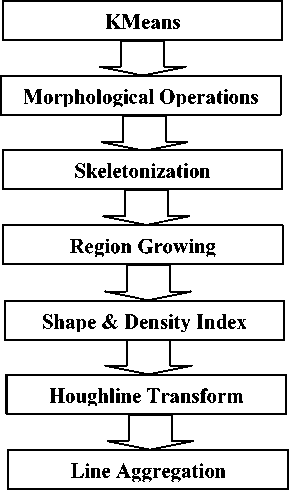
Fig.1. Spectral-Spatial Method
-
A. Spectral Methods:
K-means Clustering Algorithm:
Kmeans algorithm is used for spectral clustering [11], [12], [13]; The Kmeans clustering is used because it is a very robust and also simple clustering algorithm. The image is an RGB image of 676 X 530 pixels. The Kmeans algorithm assigns every pixel to a cluster. The cluster centers are updated. The cluster assignment and cluster centers are updated until the exit criteria is met. The Kmeans clustering calculated as shown below in the equation (1).
ln
I = EE НУ" c k ll2 (1)
i = 1 k = 1
Where || y i — ck ||2 is the distance measure between the cluster centre and the data points, k denotes the number of clusters, i is the number of pixels in the image.
-
B. Spatial Methods:
Since the RGB image is a vision spectrum with low spectral resolution of 3 bands i.e., Red, Green and blue bands, the extraction of the row is incomplete. In such case there is a high misclassification of the row crop pixels which leads to the incorrect and will not produce the clustering efficiently. To address misclassification from K-means clustering, spatial segmentation is used [7].
The key spatial methods used in the row crop detection are as follows:
-
(i) Mathematical Morphology: The main goal of the morphology [10] in image processing is to remove the imperfections such as noise, texture which is in different forms and the shapes. Some of the spatial features are applied to the clustered image to eliminate the misclassified regions by using the morphological operations discussed as below.
Erosion: The white pixels in the binary image which are present in the foreground are eroded. The structuring element is a very important parameter in the morphology [7]. The structuring element is a very small range of pixels each with size of either zero or one. The eroding of the binary image is done by the structuring element called ‘disk’. The pixels with size zero and one specify the exact shape of the binary image. The erosion of the image b is defined by b ϴ d, where d is the structuring element. A new binary image is produced h = b 0 d E (Y) of a set. Y is defined by the structuring element d. It is calculated as shown in the equation (2).
Y = { y | V d e d , d + ( — b ) e Y } (2)
Closing: The closing of a binary image is dilation followed by erosion. Closing is applied here to remove the thin interiors in the image in which each row is divided into individual contiguous figure. In the binary image the counters which are in white pixel is always increased by one unit. A ‘line’ structuring element is used. Here P is the original image and Q is the closed image. The holes in foreground of an image will be filled only if it is smaller than Q. We are defining A for closed operation. The closing operation is defined as shown in equation (3).
A = ( P ® R ) © R (3)
-
(ii) Skeletonization: The noise in the image is removed. The threshold value in the image depends on the resolution of the entire image. The Skeletonization [14], [15] gives the exact representation of the shape but the
original size of the object remains the same and also the topology of the image is same. The eroded image is then dilated and subtracted from the eroded image to get the exact skeletonized image. Y is defined by the structuring element. S k indicates Skeletonization of an image Y; k is successive erosions applied for original image by using structuring element. Q is the closed image. The Skeletonization of an image Y is carried out by equation (4).
S k ( Y ) = [ Y ® kQ ] — [( Y ® kQ ) = Q ] (4)
-
(iii) Region Growing: Some of the connected objects in the skeletonized image are disconnected. To connect the disconnected objects region growing methodology [14], [15] is applied. The image is dilated with the structuring element ‘line’. The neighboring pixel is always coordinate from the centre of the pixel in the image. The region growing of an image A is carried out as shown in equation (5). Where T i is the connected region, i = 1, 2, 3…n and T is the region.
T i = T (5)
-
(iv) SI & DI Index: Shape and density index are 2 geometric properties used in image segmentation. The connected objects in the image due to more white pixels which are unwanted for the process are removed by applying the SI & DI [14], [15]. The threshold is used with some specific value for the process. By applying the SI & DI, the complete noise and the unwanted texture is removed. The SI and DI are calculated as shown in the following equations (6) and equation (7).
DI ( j ,1) = ^(1 * Area ) /1 + ^(var sum) (6)
SI ( j ,1) = n * Perimeter / 4* V1 * Area (7)
-
(v) Houghline Transform: To extract the lines in the image Houghline Transform is applied for the images. Line detection is a major part because each row is identified by an individual line. Canny edge detection is used with the specified threshold value. Here the detected lines are specified inn color red. Based on the threshold value the lines are incremented and counted in a right way. The Houghline Transform is applied using the equation (8), where P is the length from the origin, θ is the orientation, for any point on the line (a, b), θ is constant.
P = A cos O + B cos O (8)
-
(vi) Line Aggregation: At the final step, the proposed method is designed to count the line count of each individual detected line. In this, the line count is done by taking the middle row with the pixels 240 and traversing each other. The line count is increased only when number of black pixels is greater than 50. The threshold value of
black pixel is considered to be >50 which is in between two red lines and increases for correct counting of lines.
-
III. results and discussions
In this section, the results obtained from the UAV images are discussed. The proposed method is applied to six images acquired at different altitudes. To check the consistency, we are taking several images and applying the spectral-spatial classification. The following figures show the different results with the different datasets. The images taken for the implementation are the heterogeneous images at different image altitudes which inturn resulted in image pixel resolution. The original image is an RGB image of 676 X 530 pixels. The Kmeans algorithm assigns every pixel to a cluster. The cluster centers are updated. The KMeans algorithm clustered image is shown in the figure 2(b). Due to the misclassification in the cluster the segmentation is not accurate so we are using morphological operations like erosion, dilation, opening and closing. The eroding of the binary image is done by the structuring element called ‘disk’ with value 6. For a close operation a ‘line’ structuring element is used with the radius 6. The morphological operations are shown in the figure 2(c) and 2(d). The resulted images shows contiguous figure and all rows are separated individually. Due to discontinuities present in the image we eliminate the discontinuities by applying skeletonization. The structuring element ‘Morph Cross’ is used with the radius 3. The skeletonized image is shown in the figure 2(f). Since there are many disconnected objects in the image by applying region growing all disconnected objects are connected. A preprocessing step called dilation is used in region growing. The image is dilated with the structuring element ‘line' with radius 2. Successive dilation is performed with the structuring element 'line'. The dilated image is show in the figure 2(g). The region grown image is shown in the figure 2(h). The noise which is present in the image is removed by applying Shape Index and Density Index to the image. The threshold value for SI must be greater than 0.88 and for Density Index the threshold value must be less than 0.33. The noise is removed in the image and is shown in the figure 2(i). As a next step Houghline transform is applied to extract each line in the image. The threshold value is set to 50. Lines are fairly delineated in the image and are shown in the figure 2(j). Finally line aggregation is done and number of rows present is counted. The lines are aggregated to the actual number of rows and are shown in the figure 2(j). The number of rows are counted and shown in 2(k). UAV Image 1:
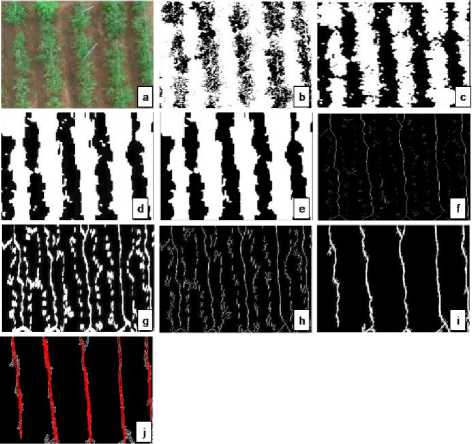
Fig.2. UAV Image1 : (a) Original image (b) Kmeans (c) Erosion (d) Close (e) imfill (f) Skeletonization (g) Successive Dilation (h) Region Growing (i) SI & DI Index (j) Houghline Transform (k) Actual Count = 5 ; Line count=5.
To check the robustness of the proposed method several UAV images at different image altitudes which inturn resulted in image pixel resolution are considered and the spectral-spatial classification is applied. The results for different datasets are as shown below.
UAV Image 2:
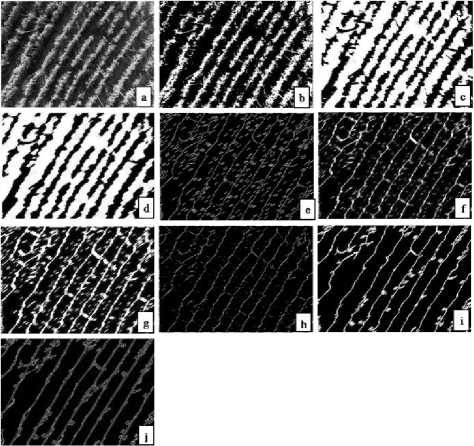
Fig.3. UAV Image 2: (a) Original image (b) Kmeans (c) Dilation (d) Close (e) Skeletonization (f) Succesive Dilation (g) Region Growing (h) Skeletonization (i) Shape and Density Index (j) Houghline Transform (k)
Actual Count = 13; Line count=12.
UAV Image 3:
UAV Image 5:
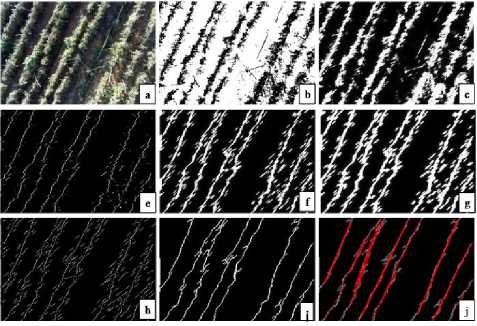
Fig.4. UAV Image3: (a) Original image (b) Kmeans (c) Dilation (e) Skeletonization (f) Succesive Dilation (g) Region Growing (h) Skeletonization (i) Shape and Density Index (j) Houghline Transform (k) Actual count = 8; Line count = 8.
UAV Image 4:
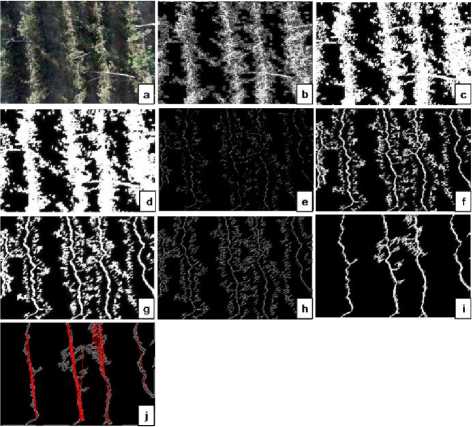
Fig.5. UAV Image 4: (a) Original image (b) Kmeans (c) Dilation (d) Close (e) Skeletonization (f) Succesive Dilation (g) Region Growing (h) Skeletonization (i) Shape and Density Index (j) Houghline Transform (k)
Actual Count = 4; Line count = 4.
The table [2] below shows the performance validation [19] using confusion matrix [7] [9]. Accuracy is checked for all six images and results are presented in the following table. Images 1, 3 and 4 give 100% accuracy. Image 2 is approximately accurate. Image 5 and 6 are acquired at a higher altitude so the results are not accurate. In the Table 1, for all images TP, FP, TN, FN [16], [17] gives the actual number of rows present in each image. In Table 2, TPR, FPR, FNR, TNR and Accuracy is been calculated.
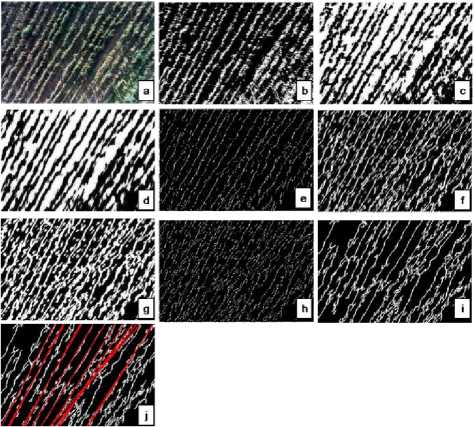
Fig.6. Image 5 :(a) Original image (b) Kmeans (c) Erosion (d) Close (e) Skeletonization (f) Succesive Dilation (g) Region Growing (h)
Skeletonization (i) Shape and Density Index (j) Houghline Transform (k) Actual Count = 15; Line count = 9.
UAV Image 6:
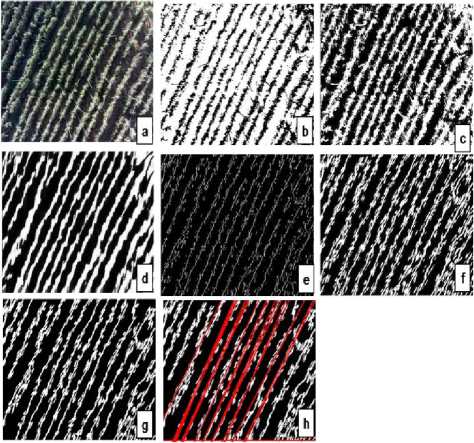
Fig.7. UAV Image 6: (a) Original image (b) Kmeans (c) Erosion (d) Open (e) Skeletonization (f) Succesive Dilation (g) Shape and Density Index (h) Houghline Transform (i) Actual count = 16; Line count = 9.
Table 1. Actual data of the rows in images
|
Proposed Method |
TP |
TN |
FP |
FN |
|
Image 1 |
5 |
0 |
0 |
0 |
|
Image 2 |
12 |
0 |
0 |
1 |
|
Image 3 |
8 |
0 |
0 |
0 |
|
Image 4 |
4 |
0 |
0 |
0 |
|
Image 5 |
15 |
0 |
0 |
9 |
|
Image 6 |
16 |
0 |
0 |
9 |
Table 2. Calculation of Performance Validation
|
Ground Reference |
||||||
|
Proposed Method |
TPR |
TNR |
FPR |
FNR |
F1 Score |
Accuracy % |
|
Image 1 |
1 |
0 |
0 |
0 |
1 |
100 |
|
Image 2 |
0.84 |
0 |
0 |
0.07 |
0.96 |
92.3 |
|
Image 3 |
1 |
0 |
0 |
0 |
1 |
100 |
|
Image 4 |
1 |
0 |
0 |
0 |
1 |
100 |
|
Image 5 |
0.62 |
0 |
0 |
0.37 |
0.77 |
62.5 |
|
Image 6 |
0.64 |
0 |
0 |
0.36 |
0.78 |
64 |
Where,
TP: True Positive
FP: False Positive
TN: True Negative
FN: False Negative
TPR: True Positive Rate = TP/ (TP+FN)
FNR: False Negative Rate = FN/ (TP+FN)
TNR: True Negative Rate = TN/ (TN+FP)
FPR: False Positive Rate = FP/ (TN+FP)
F1 Score: 2TP/ (2TP+FP+FN)
For a good classifier TPR, F1 score and Accuracy is close to 1 or 100% and TNR an FNR is are zero. Fig 8 is a box plot for visualization of the results. It can be observed that the performance parameters are lower for image 5 and image 6. This is because images 5 and 6 are acquired at a higher altitude as compared to the other images. Image 1 is taken at the lowest altitude as compared to the other images hence the performance results are close to the expected results of a good classifier.
The performance of row crop detection for all images is statistically visualized using box plots [20] as shown in Fig 8. It can be observed that TPR, F1SCORE and ACCURACY are closer to 100% indicating good detection of rows. Further, the range and inter quartile range is low for F1SCORE as compared to TPR and ACCURACY. FNR is towards 0 indicating good performance on not detecting false negatives.
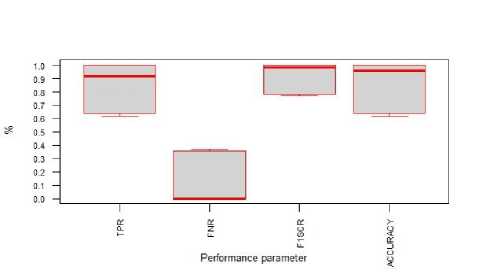
Fig.8. Rows Detection Performance
-
IV. Conclusion
In this study, we successfully carried out detection of rows in open field tomato crop using our proposed spectral-spatial method. Six images acquired using LARS carried out from quadcopter UAV are analyzed using the proposed method. In the proposed Spectral-spatial method, K-means algorithm is used for spectral clustering and spatial methods of mathematical morphology and geometrical operations are used. Six images acquired at various altitudes are analyzed. Results are encouraging; however, this work can be extended to detect rows in vast stretch of crops by analyzing mosaiced images of larger crop extents.
Acknowledgement
The authors thank Mr. Gautham Anand from IISc for the help in providing UAV Remote Sensed Images. We also thank Mr. Nandigam Hari Krishna from NIT, Srinagar for his help in line aggregation sub step.
References Detection of Rows in Agricultural Crop Images Acquired by Remote Sensing from a UAV
- Zhang, Chunhua, and John M. Kovacs. "The application of small unmanned aerial systems for precision agriculture: a review." Precision agriculture 13, no. 6 (2012): 693-712.
- Torres-Sánchez, J., F. López-Granados, and J. M. Peña. "An automatic object-based method for optimal thresholding in UAV images: Application for vegetation detection in herbaceous crops." Computers and Electronics in Agriculture 114 (2015): 43-52.
- Puletti, Nicola, Rita Perria, and Paolo Storchi. "Unsupervised classification of very high remotely sensed images for grapevine rows detection."European Journal of Remote Sensing 47 (2014): 45-54.
- Comba, Lorenzo, Paolo Gay, Jacopo Primicerio, and Davide Ricauda Aimonino. "Vineyard detection from unmanned aerial systems images."Computers and Electronics in Agriculture 114 (2015): 78-87.
- Puletti, Nicola, Rita Perria, and Paolo Storchi. "Unsupervised classification of very high remotely sensed images for grapevine rows detection."European Journal of Remote Sensing 47 (2014): 45-54
- Berni, J. A. J., P. J. Zarco-Tejada, L. Suárez, V. González-Dugo, and E. Fereres. "Remote sensing of vegetation from UAV platforms using lightweight multispectral and thermal imaging sensors." Int. Arch. Photogramm. Remote Sens. Spatial Inform. Sci 38, no. 6 (2009).
- Senthilnath, J., Akanksha Dokania, Manasa Kandukuri, K. N. Ramesh, Gautham Anand, and S. N. Omkar. "Detection of tomatoes using spectral-spatial methods in remotely sensed RGB images captured by UAV."Biosystems Engineering (2016).
- Malek, Salim, Yakoub Bazi, Naif Alajlan, Haikel AlHichri, and Farid Melgani. "Efficient framework for palm tree detection in UAV images." IEEE Journal of Selected Topics in Applied Earth Observations and Remote Sensing 7, no. 12 (2014): 4692-4703.
- Ramesh, K. N., A. Sreenivasa Murthy, J. Senthilnath, and S. N. Omkar. "Automatic detection of powerlines in UAV remote sensed images." In 2015 International Conference on Condition Assessment Techniques in Electrical Systems (CATCON), pp. 17-21. IEEE, 2015.
- Sagar, B. S. D, "Mathematical morphology in geomorphology and GISci". CRC Press, 2013.
- MacQueen, James. "Some methods for classification and analysis of multivariate observations." In Proceedings of the fifth Berkeley symposium on mathematical statistics and probability, vol. 1, no. 14, pp. 281-297. 1967.
- Weiss, Sholom M. "On the performance of bisecting K-means and PDDP." (2001).
- Rollet, R., G. B. Benie, W. Li, S. Wang, and J. M. Boucher. "Image classification algorithm based on the RBF neural network and K-means."International Journal of Remote Sensing 19, no. 15 (1998): 3003-3009.
- Senthilnath, J., Shivesh Bajpai, S. N. Omkar, P. G. Diwakar, and V. Mani. "An approach to multi-temporal MODIS image analysis using image classification and segmentation." Advances in Space Research 50, no. 9 (2012): 1274-1287.
- Song, Mingjun, and Daniel Civco. "Road extraction using SVM and image segmentation." Photogrammetric Engineering & Remote Sensing 70, no. 12 (2004): 1365-1371.
- Omkar, S., V. Sivaranjani, J. Senthilnath, and Suman Mukherjee. "Dimensionality reduction and classification of hyperspectral data."International Journal of Aerospace Innovations 2, no. 3 (2010): 157-164.
- Suresh, Sundaram, Narasimhan Sundararajan, and Paramasivan Saratchandran. "Risk-sensitive loss functions for sparse multi-category classification problems." Information Sciences 178, no. 12 (2008): 2621-2638.
- Sankaran, Sindhuja, Lav R. Khot, Carlos Zúñiga Espinoza, Sanaz Jarolmasjed, Vidyasagar R. Sathuvalli, George J. Vandemark, Phillip N. Miklas et al. "Low-altitude, high-resolution aerial imaging systems for row and field crop phenotyping: A review." European Journal of Agronomy 70 (2015): 112-123.
- Catal, Cagatay. "Performance evaluation metrics for software fault prediction studies." Acta Polytechnica Hungarica 9, no. 4 (2012): 193-206.
- Massart, Desire Luc, and A. J. Smeyers-verbeke. "PRACTICAL DATA HANDLING Visual Presentation of Data by Means of Box Plots." (2005).
