Determination of criteria for assessing the conformity of the refrigerator unit with the control parameters, the algorithm of their definition definition

Author: Shurinova D.A., Kovalenko А.N., Murygin A.V., Suvorov A.G.
Journal: Siberian Aerospace Journal @vestnik-sibsau-en
Section: Informatics, computer technology and management
Article in issue: 1 vol.23, 2022.
Free access
The article describes the results of tests that have been carried out at the manufacturing plant of refrig-eration devices. These results have made it possible to estimate the capability of using a new method of testing refrigeration devices for compliance with the standards established by GOST, which determine the specific heat and power properties of each refrigeration device, depending on its type (single-chamber or with two-chambers, with one compressor or with two, etc.), passing acceptance tests. The graphs of the active power of the device will be presented when it is connected to the power supply network and the de-pendence of the change in the power graph depending on time will be described, the signs of the graphs of faulty refrigeration devices will be described, indicating the cause of the malfunction. The authors indicate the parameters by which it is proposed to compare the obtained power graphs with the reference graphs obtained when testing reliably serviceable refrigeration devices. Based on the results of comparing certain values of the parameters characterizing the device it is proposed to judge the compliance of each individu-al refrigeration device with the standard. It also provides a description of the algorithm that will be used to determine the compliance of the refrigeration device with the established parameters of heat and power characteristics that determine its performance. The implementation of this algorithm will be carried out by writing an appropriate program for the programmable logic controller (PLC).
Refrigerator, heat-and-power characteristics, consumed active power, test method of refrig-eration devises, method of testing refrigerators, development of a verification algorithm.
Short address: https://sciup.org/148329606
IDR: 148329606 | UDC: УДК 62 529 | DOI: 10.31772/2712-8970-2022-23-1-43-51
Text of the scientific article Determination of criteria for assessing the conformity of the refrigerator unit with the control parameters, the algorithm of their definition definition
One of the main components of the refrigeration appliance is the refrigeration unit, which consists of a compressor, condenser and evaporator. The operation of the refrigeration unit as a whole depends on the correct operation of this system, because it is the operation of the refrigeration unit that ensures the maintenance of the temperature regime in the refrigeration appliance. The purpose of the authors of this article is to clearly define the criteria of active power consumption of each refrigeration unit on the graph to assess the performance of the refrigeration unit during acceptance tests of the device according to a shortened method in the rhythm of the conveyor for the first 10 minutes of testing [1; 2].
Features of power consumption graphs
Consider the change in the value of the compressor active power in the first minutes after turning on the power supply for several B-151 model refrigeration appliances, which were found to be suitable when tested according to the existing long-term method (Fig. 1, 2). To draw up reliable conclusions on the experiment, 100 similar graphs were analyzed, obtained when testing different refrigerators of the same model.
When starting the compressor, the initial power peak is due to the initial start of the compressor and can be up to 200W. It is transient - less than a second, so it is difficult to measure it in streaming production, we will not dwell on it in detail, since it does not affect the subsequent shape of the graph, which is more interesting for analysis. After starting the compressor, its power lies in the range of 8090 watts. Over the next 5 minutes, the compressor power grows and increases its value by 20–25 W. Further, the power slew rate decreases by 5–7 W during the fifth to tenth minutes. This behavior of the active power graph of the compressor for model B-151 is explained by the redistribution of the refrigerant in the refrigeration unit system.
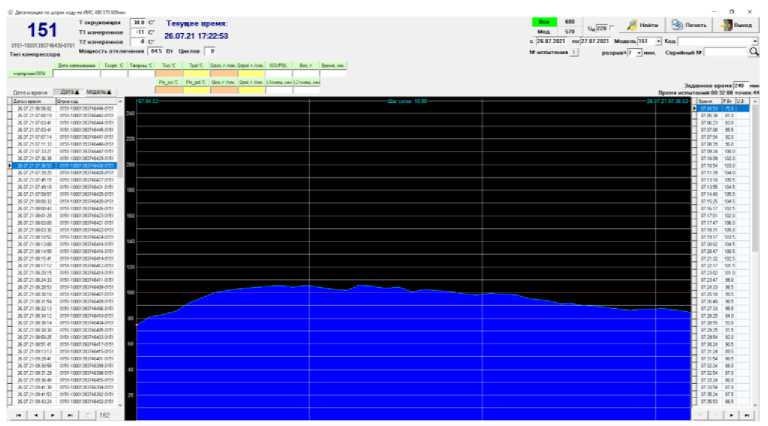
Рис. 1. График изменения активной мощности при подключении холодильника № 1 модели Б151 к сети питания
Fig. 1. Diagram of active power change when refrigerator No. 1, model B151, is connected to the power supply
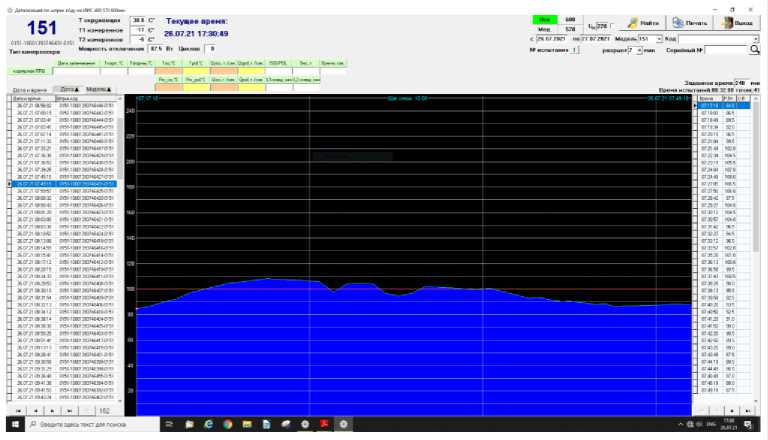
Рис. 2. График изменения активной мощности при подключении холодильника № 2 модели Б151 к сети питания
Fig. 2. Diagram of active power change when refrigerator No. 2, model B151, is connected to the power supply
Initially, freon in all parts of the refrigeration unit is in a gaseous state at the same pressure and temperature. The temperature of all elements of the refrigeration appliance is the same and equal to the ambient temperature. When the compressor is first started, freon is drawn out of the evaporator and forced into the condenser. At the same time, the condenser and evaporator still have the same temperature and it is easy for the compressor to move freon with minimal electrical energy consumption (the starting point of the active power graph). Over the next 5 minutes, the pressure of freon in the condenser increases due to the injection of freon, the temperature of the condenser rises. Consequently the power consumption of the compressor also increases. By increasing the compressor power, it can be in- directly judged that the refrigeration unit is filled with freon and the compressor provides a certain gas flow at the condenser inlet. In the absence of freon in the cooling system, the compressor operates “idle”, the electrical power consumed by it does not change over time. By 6–10 minutes, the freon pressure in the condenser reaches its maximum value, equal to the saturated vapor pressure, and freon undergoes a phase transition to the liquid phase. The maximum vacuum has been created in the evaporator. The flow rate of the gas passing through the compressor becomes constant as the unit begins to enter a steady state of operation. Freon is distributed throughout the cooling system according to this mode. The power consumed by the compressor reaches its maximum value and stops increasing. Thus, the performance of the refrigeration unit can be judged from the graph of the active power consumed by the compressor [3– 5].
Having considered 100 active power graphs for model B-151 refrigeration appliances, one can note a good repeatability of the shape of power graphs obtained during acceptance tests at the same ambient temperature (Fig. 1, 2). If there are malfunctions in the cooling system, the schedule will differ significantly from the above.
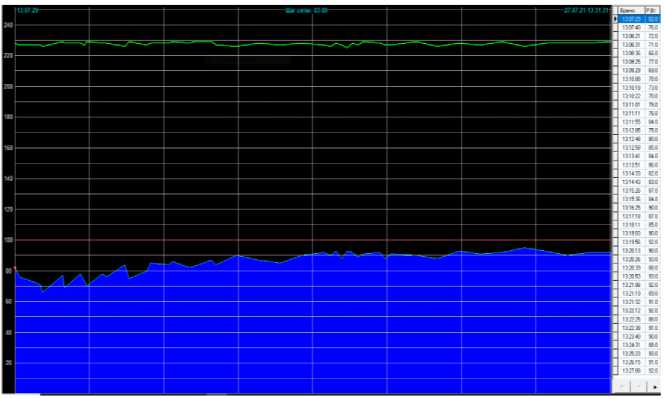
Рис. 3. График изменения активной мощности при подключении бракованного холодильника № 1 модели Б-151 к сети питания
Fig. 3. A graph of changes in active power when the defective refrigerator No. 1, model B-151, is connected to the power supply
Fig. 3, 4 show the graphs of the power of defective products. Types of defects, due to which the power graph will differ from the one described above are the following:
– failure to start the compressor;
-
– freon leakage due to depressurization of the refrigeration unit;
– deviation from normal operation (Fig. 3) (the reason needs to be clarified during additional longterm tests, it is possible to fill the wrong dose of freon or install a compressor of a different model);
– lack of refrigerant in the cooling system (the compressor is not charged) (Fig. 4).
Based on the data obtained during the tests described above, further development of the article’s authors idea is to determine clear criteria for active power parameters, under which it would be possible to reliably judge the compliance of the refrigeration appliance with the established standard.
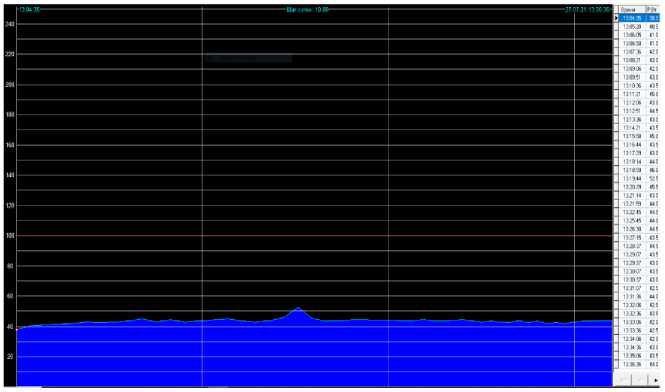
Рис. 4. График изменения активной мощности при подключении бракованного холодильника № 2 модели Б-151 к сети питания
Fig. 4. A graph of changes in active power when the defective refrigerator No. 2, model B-151, is connected to the power supply
We select the parameters by which the comparison is made. We will consider the criteria for assessing the compliance of the power consumption of a refrigeration appliance during acceptance tests on the B-310 model, for which tests similar to those described above were carried out (Fig. 5).
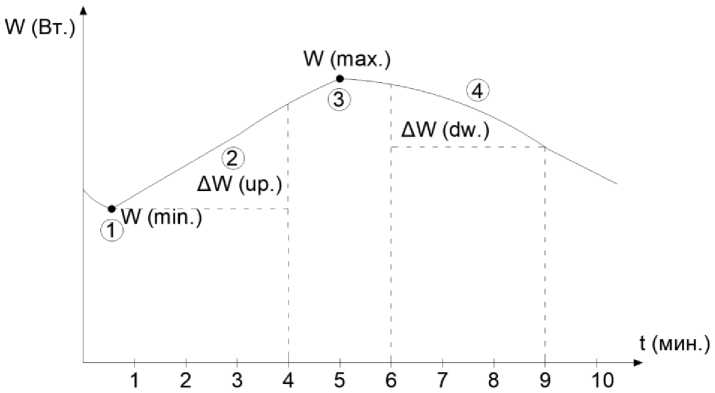
Рис. 5. Схематичное положение необходимых для анализа критериев потребляемой мощности за первые 10 мин после подключения холодильника к сети питания
Fig. 5. Schematic position of the power consumption criteria necessary for the analysis for the first 10 minutes after the refrigerator is connected to the power supply
The criteria for evaluation are:
-
1) the value of the minimum power within 1 min after the start of the test;
-
2) the value of the rate of increase (increase) in power over the next 3 minutes;
-
3) the maximum value of power in the period from 3 to 6 minutes;
-
4) the value of the rate of power reduction in the period from 6 to 9 minutes.
When testing on a production line, arrays of power values measured by an electronic power meter were programmatically obtained [5; 6] for each type of refrigeration appliance. We consider the data from this array to be initial. After a comparative analysis of these data, regularities were identified [7– 12]. Further, we use them in the algorithm for determining the parameters we need ΔW(up) и ΔW(dw) (Fig. 5).
Algorithm for calculating evaluation criteria
Initial data are:
– formed array consisting of 90 values of active power, measured with an interval of 6 s;
– tabular (control) values of parameters for refrigerating appliances of the B-310 model at the corresponding ambient temperature:
– W-min_K – minimum power value;
– W-up_K – change in power during the first sharp jump in its increase, associated with the redistribution of freon in the cooling system;
– W-max_K – maximum power value;
– W-dn_K – change in power during the first jump of its decrease, associated with the redistribution of freon in the cooling system.
Permissible deviations for each of the required parameters are:
– ΔW-min;
– ΔW-up;
– ΔW-max;
– ΔW-dn.
The initial data is formed by software modules, which are not considered in this article.
Description of the algorithm:
-
– waiting for the next refrigerating appliance to approach along the conveyor (determined by the sensor of the presence of the appliance on the conveyor);
-
– definition of model number, ambient temperature, reading of values table parameters (ambient temperature affects the initial parameters, with which we will compare the obtained data, the time depends on the external temperature, after which the refrigeration unit will overcome the stages described above. The closer the ambient temperature is to the set cooling temperature of the device, the faster the compressor will reach the steady state of operation);
-
– preparation for the analysis of the graph of power consumption;
-
– reading the power values accumulated during the test into the array massW (90);
-
– determination of the minimum power. Cyclic polling of 10 array elements (since the minimum power should be on the graph within the first minute of the test, and the measurement is made every 6 s). Determining the minimum value (W_min) and its array entry number (N_min);
-
– determination of the increment of the value of W for a given period of time = 3 min from N_min;
-
– determination of maximum power: cyclic polling of array elements, starting from ΔN to 90th. Comparing values with each other and storing the maximum value in the W_max variable and the number of this value in the N_max variable;
–Recording power increment to W_dn variable and the time interval from the detection of W_max to the end of the test.
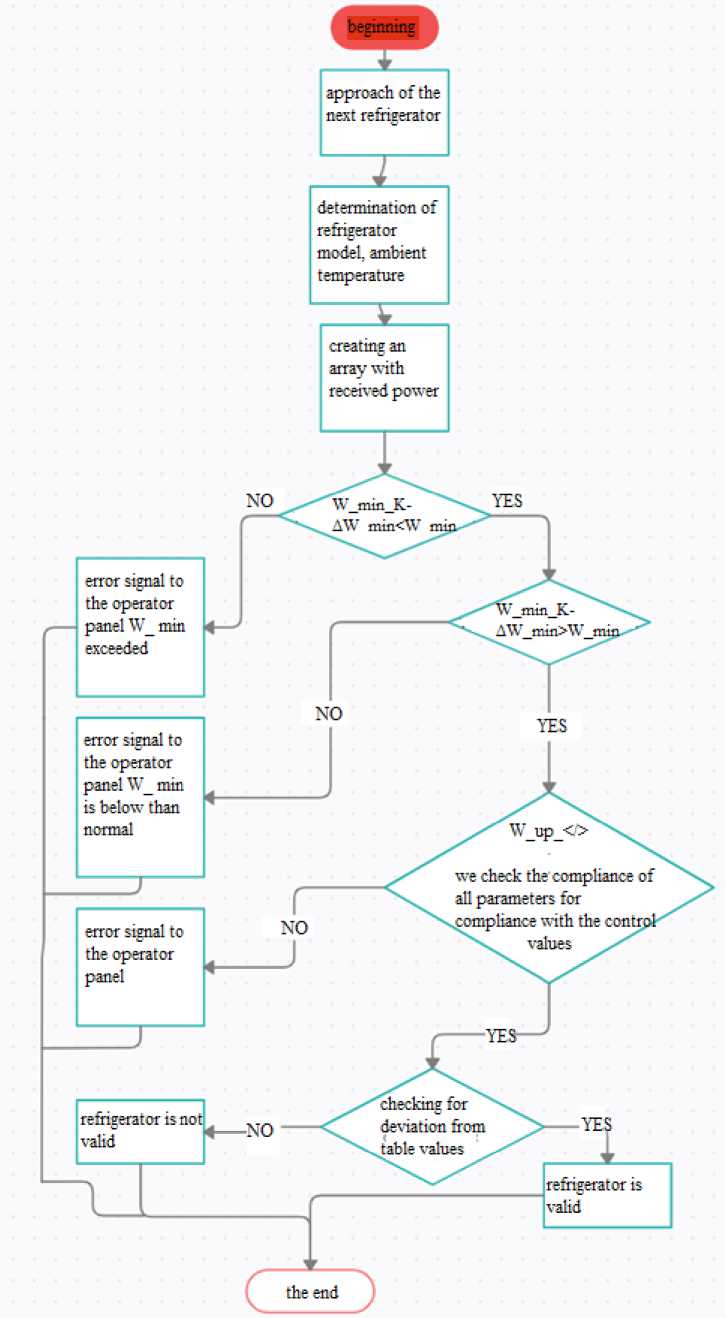
Рис. 6. Алгоритм вычисления критериев оценки
Fig. 6. Algorithm for calculating the evaluation criteria
Conclusion
Based on the results of the tests described in this article, it seems possible to judge on the suitability of each piece of equipment, based on the parameters (Fig. 5). When comparing these parameters of each refrigerator with the reference ones for a certain range of room temperature, it is possible to judge the compliance of the refrigeration unit with the standard. Using the obtained parameters in the algorithm (see Fig. 6), the controller gives the operator the final test result for each individual device [13–15].
References Determination of criteria for assessing the conformity of the refrigerator unit with the control parameters, the algorithm of their definition definition
- Shurinova D. A. [Development of a new methodology for acceptance testing of refrigeration ap-pliances]. Informatika, telekommunikatsii I upravlenie. 2021. Vol. 14, No. 4, P. 52–60 (In Russ.).
- GOST 16317–87. Priboryh olodilnue elektricheskie bitovye. Obshietehnicheskie ysloviya. [State Standard 16317–87: Household electrical refrigeration appliances. General technical conditions (with amendments N 1, 2, 3)]. Moscow, Standartinform Publ., 1987. 22 p.
- Zafar S., Gupta A., Nandi T. K. Design and construction of a pressure wave cryogenic refrigerator. Refrigeration science and technology. 2019, Vol. 15, P. 421–427. Doi: 10.18462/iir.cryo. 2019.0090.
- Mukhamadiev A. A. Information measuring system for monitoring the parameters of a household refrigerator compressor. Electrical and information complexes and systems. 2017, Vol. 13, No. 4, P. 109–114.
- Shurinova D. A., Kovalenko A. N., Murygin A. V., Suvorov A. G. [Review of existing methods for controlling the heat and power characteristics of household refrigerators]. Mechanics of the XXI century. 2020, Vol. 19, P. 164–171.
- Vosmikanalny regylator s RS485 [Eight-channel thermostat with RS-485] (In Russ.). Available at: https://owen.ru/product/trm138/price (accessed: 10.10.2021).
- Shemy podkluchenya TRM138 [Connection diagram for TRM138] (In Russ.). Available at: https://owen.ru/product/trm138/connection (accessed: 13.9.2021).
- Owen Cloud. Oblachny servis. Rykovodstvo polzovatelya. [OwenCloud. Cloud service. User guide]. 09.25.2021. Version 1.07.
- Thomas Kugelstadt. Gidpo structure RS485. Otchet po primeneniy SLLA272C [The RS-485 Design Guide. Application Report SLLA272C]. Febuary 2008–Revised October 2016. 10 р.
- OwenCloud [OwenCloud] (In Russ.). Available at: https://owen.ru/owencloud (accessed: 10.10.2021).
- John Rinaldi. Modbus: The Everyman’s Guide to Modbus. Createspace Independent Publishing Platform, 18 nov. 2015. 92 р.
- Sahba R. A brief study of software defined networking for cloud computing. World automation congress proceedings. 2018. P. 6–9.
- Balonin N. A., Sergeev M. B., Vostrikov A. A. Modern artificial intelligence network technol-ogies: cloud computing. 2018. Wave electronics and its application in information and telecommuni-cation systems, weconf. 2018. P. 44–76. Doi: 10.1109/WECONF.2018.8604476.
- Paskova A. A. Big Data technologies in the automation of technological and business process-es. Scientific Review. Technical science. 2018, No. 4, P. 23–27.
- Torelló À., Defay E. Law of heat exchange in caloric regenerators. International Journal of Refrigeration. 2021, Vol. 127, P. 174–179.
