Determination of New Bio Signal and Tests Alternative to Verbal Pain Scale for Diagnosing Fibromyalgia Syndrome

Author: Muhammed Kürşad Uçar, Mehmet Recep Bozkurt, Ferda Bozkurt
Journal: International Journal of Image, Graphics and Signal Processing(IJIGSP) @ijigsp
Article in issue: 3 vol.8, 2016.
Free access
In this study; values obtained through the analysis of blood samples, taken under laboratory conditions, from patients diagnosed with fibromyalgia syndrome and healthy subjects and the sympathetic skin response parameters were used. With the aim of classifying verbal pain scale, which is one of the psychological test scores used for fibromyalgia syndrome diagnosis; relation between the sympathetic skin response effect on other test data and the verbal pain scale were reviewed by using different conditions of available data. Within this framework, three different algorithms were used for classification with high accuracy rates. These algorithms are: Multi-Layer Feed-Forward Neural Networks, Probabilistic Neural Network and Radial Basis Function Neural Network. For Multi-Layer Feed-Forward Neural Networks classification algorithm, classification was done with three different training algorithms, Levenberg-Marquardt back propagation, Resilient back propagation and the Scaled conjugate gradient back propagation and the results were compared elaborately. Based on the results, by using all variables the following accuracy rates were obtained: 68.2% accuracy with Levenberg-Marquardt training algorithm, 77.3% accuracy with the Resilient back propagation training algorithm, and 68.18% accuracy with the Scaled conjugate gradient training algorithm. These success rates show that there is a relationship between verbal pain scale, sympathetic skin response and other test data.
Biomedical Signal Analysis, Fibromyalgia Syndrome, Verbal Pain Scale, Sympathetic Skin Response, Biomedical Signal Classification
Short address: https://sciup.org/15013955
IDR: 15013955
Text of the scientific article Determination of New Bio Signal and Tests Alternative to Verbal Pain Scale for Diagnosing Fibromyalgia Syndrome
Published Online March 2016 in MECS DOI: 10.5815/ijigsp.2016.03.01
This study was performed in order to shorten the diagnosis time and increase the reliability of fibromyalgia syndrome (FMS) diagnosis. In order to increase the diagnosis reliability, reliable test methods and detection of a biological signal methods were to be used instead of the existing method which uses physiological tests [1].
FMS is a chronic pain syndrome which often appears with widespread musculoskeletal pain, sleep disorder and fatigue [2][3]. It affects mainly muscles and the parts where the muscles are attached to bones. It is a disease which is more common in women[4][5]. As it happens in every illness, in order to begin the right and fast treatment for FMS, quick diagnosis is very important [3][6].
According to the criteria defined by the American College of Rheumatology (ACR - American College of Rheumatology) in 1990; FMS diagnosis is made upon the widespread pain which lasts for at least 3 months on the left half of the body, right half of the body, lower body, upper body and local pain in 11 sensitive points out of 18 when they are examined by finger pressure (palpation) [7][8]. Besides; psychological tests associated with FMS, blood samples taken from patients under laboratory conditions and measured physiological test results also support FMS diagnostic [9]. However; as the psychological test (Phys) may change depending on the patient's psychological state, their reliability is controversial. There is no laboratorial test for diagnosing FMS[7]. In order to correctly diagnose for this disease, the physician must examine the patient thoroughly, and must examine patient’s health records. Usually FMS is diagnosed by the elimination method. Meaning, the physician primarily checks for other illnesses with the same symptoms, if other illnesses don’t exist in patient’s body, they are eliminated. This takes a great deal out of a patient’s life, considering the course of time taken in diagnosis of FMS. Therefore, there is a big need for new methods for diagnosing FMS.
Biological signals are the results of various functions occurring on different systems in the body. It is not possible to understand these signals directly. They imply complicated information related to the incidents that occur inside. In order to be understood; these symptoms need to be interpreted. Today; ability to interpret biological symptoms with computer programs without the need for a mathematical model and to use them as diagnosis for the disease is one of the most important advantages of biological symptoms [10][11]. For the diagnosis of FMS, blood samples from a patient, physiological tests, and the sympathetic skin response (SSR) were used for a biological signal in the study. For the interpretation of the test results, Multi-Layer FeedForward Neural Networks (MLFFNN), Probabilistic Neural Network (PNN) and Radial Basis Function Neural Network (RBFNN) was chosen due to their higher success rates in neutral network based classifications. Furthermore, these three classification algorithms were compared among each other on basis of performance to enhance system’s reliability.
SSR is an instant and temporary electrodermal activity (EDA), which occurs on the skin as a response to stimulation by any internal or external stimulant [12]. Sympathetic skin response is a temporary change of skin potential which can differ according to cases such as any organ or system dysfunction, deformation and so on [3]. As a result of the studies in literature; it has been found that the sympathetic skin response is associated with autonomic nervous system [13][14]. There has been a great deal of studies in literature to determine the relationship between FMS and SSR.
In a study examining SSR values in FMS; it has been identified that the latency parameter on the SSR mark, recorded from the palms and soles of the patients, is longer than those of healthy individuals [15]. In fibromyalgia; autonomic nervous system disorders such as sympathetic hyperactivity, parasympathetic hypo activity and reduction in sympathetic response to different stimulants are commonly seen [16]. However, all those disorders are not specific to fibromyalgia and there are many cases with chronic pain. In another study; it has been stated that there may be a relation between Hamilton Anxiety Test (HAM-A), which is one of the psychological test scores used in FMS, and SSR [17]. In another study; the relationship between SSR and the autonomic nervous system has been analyzed for patients with psychosis and it has been found that while the SSR psychosis relationship in healthy individuals is 82%, it is 100% in those patients [18]. In this study made by Ahuja et al. in 2003; it was considered that SSR markers could be analyzed better by using computer programs and it was concluded that they can be used for the diagnosis of psychological disorders that affect the autonomic nervous system [11]. Cakir et al made the Electroneuromyography (EMG) analysis of sympathetic skin response and F wave in order to define whether or not there is an autonomic dysfunction in fibromyalgia syndrome. In the study, it was determined that FMS patients have higher SSR amplitude values and lower latency values on both sides when compared with the control group. Therefore, this study supports that in sympathetic nervous system of FMS patients, there is a change which indicates autonomic dysfunction [19]. Although it is not definite; it has been concluded in recent years that the Fibromyalgia Syndrome (FMS) may be associated with the autonomic nervous system (ANS) [2][13]. In a study reviewing the relationship between sensitive points in fibromyalgia and psychological status, it has been identified that there is a relation between psychological distress and particularly somatization [20]. In addition to these studies; Ozhan et al examined in detail the relationship between FMS and SSR in their study in 2012 and it was reported that SSR could be used for the diagnosis of FMS [2].
In the light of these studies made in the literature, SSR is thought to be associated with FMS and OSS, and this study was conducted.
-
II. Materials
This section describes the data used in the study. Subjects, Data Acquisition in the title and information of data have been explained. Data and Obtained Parameters in title, Characteristics of the data used in the study are described.
-
A. Subjects and Data Acquisition
Database used in this study has been created within the scope of research project called “Determination of the relationships for the diagnosis of FMS” which is supported by TUBITAK. It was created at Suleyman Demirel University School of Medicine Department of Physical Medicine and Rehabilitation. Database consists of SSR measurements, laboratory (Lab) and physiological (Phys) test data taken from 57 patients, diagnosed with FMS according to 1990 ACR criteria, and 29 healthy subjects. All of the patients and healthy subjects were women. Furthermore, in order to detect pain in patients, verbal pain scale tests were applied.
In order to have more meaningful measurements; before SSR measurements are obtained, limit values of some parameters (age, height, weight), that effect SSR, should be defined [21]. During the study; special attention has been paid to keep the age, height and weights of the subjects within these limits. The subjects were selected from the range of 20-66 years old, 149-186 cm height, and 47-105 kg weight.
Using a measurement system, which consists of finger electrode and stimulant; defined parameters of SSR were taken from the subjects. For stimulation; 20 μA current was transmitted from FMS patients and healthy subjects by means of electrodes. Temporary potential changes on the skin, as a response to this current value, were measured and recorded. As a result of Matlab analysis of this recorded data; parameter values of SSR response latency, maximum amplitude and the time difference between two stimulation were obtained and recorded [2][22].
-
B. Data and Obtained Parameters
Analysis Parameters
This study is an MLFFNN, PNN and RBFNN classification study. SSR parameters, laboratory test data and physiological test data were used as input data. For SSR parameters; SSR response latency (SSRLt), maximum amplitude (SSRMaxA) and time difference between two stimulation (SSRTT) were used. For laboratory test data; C reactive protein test (CRP), rheumatoid factor (RF), white blood cell count (WBC), erythrocyte sedimentation test (SEDIM), hemoglobin concentration (HG) platet hemoglobin and platelet (PLT) data were used. For physiology test data; skin temperature, pulse and respiration rate values were used. As output data; verbal pain scale values, which is one of the physiological test scores, were used.
SSR Parameters
SSR Response Latency (SSRLt), latency time is the most common parameter used in the SSR analysis. In the analysis, the most reasonable results are obtained from this parameter [2]. As seen in Figure 1 stimulant endpoint is taken as a basis when the start point of SSR response latency time is determined. The time between the releases of stimulant, its diffusion on the skin and receipt of the response through electrodes is considered as latency. In Figure 1, stimulus represents the end point of the excitation, and latency represents the SSR Response Latency (SSRLt).
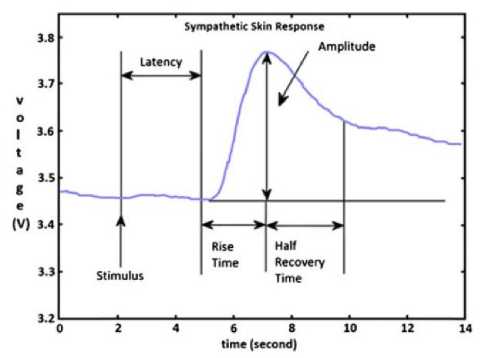
Fig.1. Example of Sympathetic Skin Response waveform [3]
Maximum Amplitude (SSRMaxA), another parameter used in the studies based on SSR measurements, is average amplitude values obtained from SSR wave forms. However, in our study, maximum amplitude value has been used instead of average amplitude. As the amplitude value decreases due to the abrasion on the area that receives stimulant and adaptation of the body to the stimulant; maximum amplitude value has been preferred for the study. In Figure 1Hata! Başvuru kaynağı bulunamadı., Amplitude represents the maximum amplitude.
Time Difference Between Two Stimulations (SSRTT), In the study; this duration has been taken as the time difference between the first beat for SSR measurement and the second beat following this stimulation.
Laboratory test data (Lab)
Laboratory data used in the study and the normal value ranges are shown in Table 1.
Physiological Test Data (Phys)
As physiological test data; skin temperature, pulse and respiration rate data has been used in the study.
Table 1. Ranges of blood values in healthy individuals [2]
|
Test Name |
Abridgment |
Normal Ranges |
|
C reactive protein test |
CRP |
0 — 3 mg / l |
|
Rheumatoid factor |
RF |
0 — 15 IU / ml |
|
Sedimentation test |
SEDIM |
Varies according to age and sex 7 — 25 mm / s |
|
White blood cell count |
WBC |
5.2 x 10³ — 12.4 x 10³ pl |
|
The amount of Hemoglobin |
HG |
13.6 — 17.2 g / dl |
|
Hemoglobin platelet (trombosit) |
PLT |
156.10 3 — 373.10 3 pl |
Verbal Pain Scale (VERBAL)
Verbal Pain Scale is an evaluation method to define the patients pain as well as the variables involving the severity of the pain. Verbal evaluation scales are similar to the numerical scales for the severity of the pain. Words define the severity of the pain and the numerical sorting is done from the least severe to the most severe.
Advantages: Easy implementation. Simple scoring. Reliable and valid level. Very successful in reflecting the multifaceted nature of pain.
Disadvantages: Close relationship with the severity of pain measurements. However, the relationship between the personal factors that affect pain is weak [20] [23].
Verbal Pain Scale is a parameter which indicates the level of the pain as follows;
0: No pain
-
1: Mild Pain
-
2: Moderate Pain
-
3: Severe Pain
-
4: Intolerable Pain
They have been defined as MLFFNN, PNN and RBFNN outputs in the study. Parameters used for the classification can be summarized as shown in Table 2.
Table 2. The parameters used for classification parameters
|
Neural Network Output Parameter s |
Neural Network Input Parameters |
|||
|
Psychological state assessment tests |
Sympatheti c Skin Response |
Physiologica l Test |
Laborator y Test |
|
|
S 55 55 p^ S 5 ^ Ы |
VERBAL |
SSRLt |
Skin Temperature |
CRP |
|
0: No pain
Pain
Pain
4: Intolerable Pain |
SSRMaxA |
Pulse |
RF |
|
|
SSRTT |
Respiratory Rate |
SEDIM |
||
|
WBC |
||||
|
HG |
||||
|
PLT |
||||
-
III. Methods
This study was performed for the use of shortening the time and increasing the reliability of the diagnosis. In order to increase the diagnosis reliability, reliable test methods and detection of a biological signal methods were used instead of the existing method which uses physiological tests.
The study was held on Matlab R2015b [24]. The parameters in Table 2 were used for the detection of parameters that were going to be used instead of verbal pain scale. The parameters in Table 2 were evaluated accordingly with the same order as Table 3 and according to the diagram in Figure 2 with MLFFNN, PNN ve RBFNN.
As for the explanation of Table 3, each parameter for example under PNN (SSR, Phys, Phys+SSR, etc) were classified individually. In the first step only the SSR data was classified with PNN classifier. Reliability of the test was checked by k-fold cross validation for the classification. In the second step only the Phys data was classified. In the next step a new classification was constructed by adding Phys data onto SSR data. Thus, the effects of Phys and SSR data to the classification were examined. In the next step only the lab data was classified. In the next two steps data from the (Lab + SSR and Phys + Lab) Lab, SSR and Phys’s effects on classification was examined. Same procedures were performed for RBFNN and MLFFNN classifier but k-fold cross validation was not used for latter. Instead, sensitivity and specify values were calculated for the gathered results.
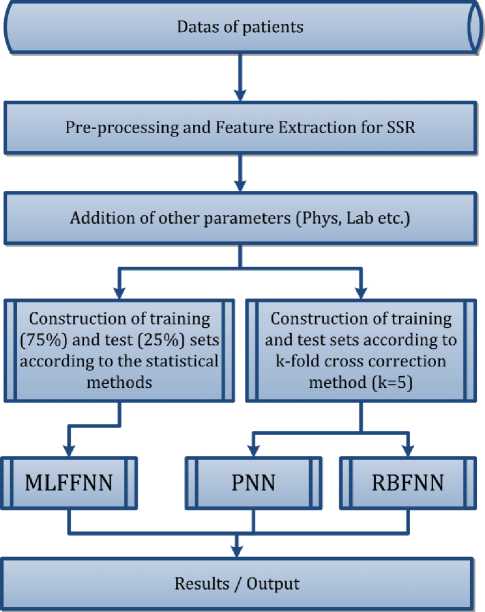
Fig.2. Flow chart
Table 3. The classification process steps
|
Class |
VERBAL (five class) |
||
|
Classification Algorithm |
MLFFNN |
PNN |
RBFNN |
|
Parameters, datas |
SSR |
SSR |
SSR |
|
Phys |
Phys |
Phys |
|
|
Phys + SSR |
Phys + SSR |
Phys + SSR |
|
|
Lab |
Lab |
Lab |
|
|
Lab + SSR |
Lab + SSR |
Lab + SSR |
|
|
Phys + Lab |
Phys + Lab |
Phys + Lab |
|
|
Phys + Lab + SSR |
Phys + Lab + SSR |
Phys + Lab + SSR |
|
-
A. Multi-Layer Feed-Forward Neural Networks (Mlffnn)
Feed-forward neural network used in this study is the type of network in which the cells on the layers are fed only from the cells on the previous layer. This structure is formed to carry out a specific task and there are three main layers namely; input layer, intermediate layer and the output layer. Data input starts from the input layer and proceeds respectively and uni-directionally to intermediate and output layer [8]. There is an extremely complex internal structure. Layer structure is shown in Figure 2 [9].
The working principle of the network is as follows: The information received from the outer world is given to the input layer. There is one neuron for each input. This layer usually does not process the data. The data is transmitted to the intermediate layer. Information processing is performed on the intermediate layer.
The intermediate layer is comprised of one or more layers and it is this layer where data is mainly processed [9]. It is often referred to as the hidden layer .This layer has a neuron for each case in the training set. These neurons contain the values of estimation variables on the course of the value desired to be achieved; which are obtained after the mathematical computations; are transferred to the neurons on output layer. In output layer; weighted values that are collected on intermediate layer are compared and the highest weighted estimation value is produced as the output value for the target category.
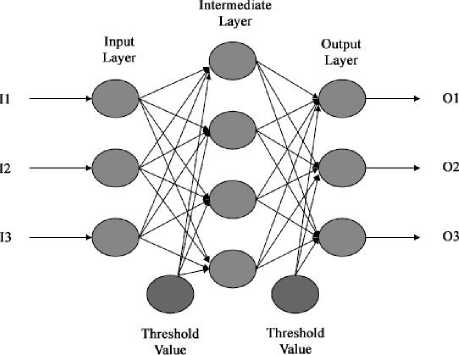
Fig.3. Artificial Neural Network Structure
This type of Artificial Neural Networks (ANN) that work according to supervised learning strategy and back-propagation learning algorithm is widely used in the training [18]. In this study; the widely used Levenberg-Marquardt backpropagation (LM) [10] [14], Resilient backpropagation (RP) [10] and the Scaled conjugate gradient backpropagation (SCG) [16] algorithms were used.
The input data for the MLFFNN was first subject to the normalization process instead of being used directly. The transfer function in the layers were used as "tansig" [24]. Since the "tansig" function was used as the transfer function, normalization was performed between ± 1. The "tansig" function gives results for values within an amplitude of ±1.
When the data was classified, it was separated into two groups called training and test data. When the groups are formed, test data cluster was constructed by using systematical sampling theorem in a way so that it would statistically represent the training data cluster [17]. Training set is 75% of all the data and consist of 64 individuals. Test set is 25% of all the data and consist of 22 individuals. Separation of data into training and test data while using in classifiers were summarized in Table 4.
Structure of artificial neural network used in the simulation is shown in Figure 4. Number of input data has been used as 3-6-9-12 based on the amount of data. 36-9-12 indicates the variables and numbers in Table 2. These variables were used as the input data for MLFFNN. Based on the performance results, the maximum number of hidden layers was set to 3.
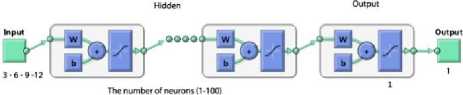
Fig.4. Artificial neural network structure
In ANN analysis, between 1-100 number of neurons have been tested in certain intervals for different algorithms. The test was interrupted when the proper results were obtained and subsequently the results were recorded. Also, in multi-layer network structure, the number of hidden layers were specified as two or three in a year due to the efficiency status.
Based on our results, the network that works best for the pain scale is the RP training algorithm and the network that uses all of the input data. The structure is like the one shown in Figure 4. In this network structure, 1 input layer, 1 hidden and 1 output layer was used. By letting every input data in the input layer correspond to a neuron, a total of 17 neurons were used in the input layer. Similarly, 75 neurons were used in the hidden layer and 1 neuron was used in the output layer.
The accuracy rates of simulations were calculated using the following formula. In all simulations, test data has been processed after training accuracy rate of 100% was achieved.
The number of subjects found
% Accuracy = x 100
Total number of subject
-
B. Probabilistic Neural Network (Pnn)
PNN, known as the kernel or Bayesian analysis is an application that is an organized form of a statistical algorithm for multilayered feed forward networks. It does not provide a general solution for ideal classification problems. PNN is a Bayes – Parzen classifier [18][24].
PNN classifications regard to all points and they are generalization based networks. For the classification process, distance is calculated from the point which will be considered to every other point. Distance function is a radial based function known as kernel function. Since the basis of the function is formed by the measurement of radius, it is referred to as radial-based. Here, the effect, meaning the weight, refers to the distance for the radial based function.
According to the flow chart in Figure 2, classification was done by PNN. After applying normalization between ± 1, classification was performed by using PNN. In order to test the accuracy of the classification, k-fold cross validation process was performed. It was assumed that k=5.
-
C. Radial Basis Function Network (Rbfn)
RBFN is a feed forward network structure consisting of three layers; the input layer, intermediate layer and output layer. There are two characteristics of RBFN. The first and the most important feature of RBFN is that it uses a non-linear radial based function as a transfer function in the intermediate layer. Second characteristic of RBFN is that it maintains a single hidden layer. Another important feature of the radial based function networks is that the information is transferred without changing from the input neurons to the hidden layer neurons. In other words, all the connection weights between the input layer and hidden layer is "1". The outputs of the processor elements in RBFN intermediate layer is determined by the distance between the AAN inputs and the center of the basic function [24] [25].
According to the flow chart in Figure 2, classification was done with RBFN. After applying normalization between ± 1 , classification was performed by using RBFN. In order to test the accuracy of the classification, k-fold cross validation process was performed. It was assumed that k=5.
-
D. k-fold Cross Validation
While performing cross-validation, training data is divided into subsets. One subset is used for training and the rest is used for verification process. This process is repeated for all the subsets in a cross. Since it is proper with the data number, k=5 was accepted in the study. After the classification is performed, accuracy rates were calculated separately for each group according to equation (1) and the final accuracy rate was achieved by taking the average of the five-class’ classification rates.
Table 4. Training and test data group numbers for PNN and RBFN
|
Classifier |
PNN and RBFN |
MLFF NN |
||||
|
Groups |
Group #1 |
Group #2 |
Group #3 |
Group #4 |
Group #5 |
Group |
|
Training Data |
69 |
69 |
69 |
69 |
68 |
64 |
|
Test Data |
17 |
17 |
17 |
17 |
18 |
22 |
|
Accuracy |
The average of the five groups (%) |
|||||
-
IV. Results
In this study, instead of using verbal pain scale, which is regularly used in the process of diagnosing FMS, we attempted to find reliable testing methods and detect a biological signal. According to these constructed characteristics, along with the steps given in Table 3, classification was performed according to the flow chart in Figure 2.
Fibromyalgia syndrome related parameters were used and obtained accuracy rates were evaluated via analysis on MATLAB. Obtained results are shown in Table 5.
Table 5. Classifier results
|
Parameters, Data |
Classification Algorithm |
|||||||||
|
MLFFNN |
PNN |
RBFN |
||||||||
|
LM |
RP |
SCG |
||||||||
|
Training |
Test |
Training |
Test |
Training |
Test |
Training |
Test |
Training |
Test |
|
|
SSR |
100 |
18.2 |
89.1 |
27.3 |
100 |
27.3 |
91.7 |
41.6 |
100 |
26.7 |
|
Phys |
100 |
50 |
93.8 |
50 |
100 |
40.9 |
91.3 |
44.2 |
100 |
33.7 |
|
Phys +SSR |
100 |
40.9 |
100 |
50 |
100 |
36.4 |
100 |
55.6 |
100 |
24.6 |
|
Lab |
100 |
31.8 |
100 |
45.5 |
100 |
36.4 |
100 |
52.2 |
100 |
23.4 |
|
Lab +SSR |
100 |
31.8 |
100 |
40.9 |
100 |
31.8 |
100 |
65.9 |
100 |
22.2 |
|
Phys +Lab |
100 |
63.6 |
100 |
72.7 |
100 |
54.5 |
100 |
71.9 |
100 |
19.4 |
|
Phys +Lab + SSR |
100 |
68.2 |
100 |
77.3 |
100 |
68.9 |
100 |
71.9 |
100 |
24.6 |
Table 6. Calculated sensitivity and specify values for MLFFNN
|
Parameters, Data |
Classification Algorithm |
|||||
|
MLFFNN |
||||||
|
LM |
RP |
SCG |
||||
|
Sensitivity |
Specificity |
Sensitivity |
Specificity |
Sensitivity |
Specificity |
|
|
SSR |
42.86 |
6.67 |
14.29 |
33.33 |
28.57 |
26.67 |
|
Phys |
50.00 |
50 |
57.14 |
46.67 |
25.00 |
50.00 |
|
Phys + SSR |
37.50 |
42.85 |
62.50 |
4.85 |
50.00 |
28.57 |
|
Lab |
37.50 |
28.57 |
12.50 |
64.28 |
25.00 |
42.85 |
|
Lab + SSR |
62.50 |
14.28 |
75.00 |
21.42 |
37.50 |
28.57 |
|
Phys + Lab |
87.50 |
50 |
75.00 |
71.42 |
37.50 |
57.14 |
|
Phys + Lab + SSR |
87.50 |
57.14 |
87.50 |
71.42 |
75.00 |
64.29 |
As for indicated in Table 5, there are three different classifiers in classifications column; MLFFNN, PNN and RBFN. While using MLFFNN classifier for classification, three different training algorithms were used, namely, LM, RP and SCG. Different simulations were performed for each training algorithm. The resulting training and test accuracy rates were given in Table 5. Likewise, in the lower column of PNN and RBFN classifiers, training and testing accuracy rates were given. Also, the data used in “Parameters, Data” titled column in Table 5 were summarized.
Three different training algorithms were used for MLFFNN classifier. The obtained results, according to these training algorithms, were conveyed in Table 5. Furthermore, sensitivity and specificity values were also calculated for these training algorithms and these were summarized in Table 6.
In order for a developed diagnostic method to be used in practice, it must be at least 80% compatible with the gold standard method [17]. By looking at the results that are obtained in our study, the overall accuracy rate is 80%, although the values of sensitivity are around 87.5%. Sensitivity parameter indicates the percentage of positives that are correctly identified as having the condition. Therefore, these results are quite significant and in this regard, it may be said that the developed system can be used in practice. However, the system is still needs to be improved.
-
V. Conclusion
The aim of this study is to identify the parameters in the diagnosis of fibromyalgia syndrome and improve the accuracy of these parameters, which can be an alternative for the verbal pain scale that is currently taken into consideration in the diagnosis of fibromyalgia syndrome. In our experiments, parameters that are analyzed with MLFFNN, PNN and RBFN have been processed under different combinations and different training algorithms; Accuracy rates have been improved with the use of different training algorithms, MLFFNN has been identified as the best classification algorithm and RP has been identified as the best training algorithm.
For convergence speed, accuracy and robustness, RP is considered to be the best algorithm with respect to training parameters [1]. The basic idea for using Rprop, which is a local adaptive learning algorithm, is to bypass the adverse effects. These adverse effects are the weight step size of the partial derivative. RP needs less training and converges faster when RP algorithm is compared to the back propagation-algorithm.
In general, the diseases are not diagnosed upon a single test data; the simulations, supported with all test data, gain importance. As summarized in Table 5, the results of the simulations, made simply on one test data or in pairs, are not so positive. However, it is seen that the results of the simulations, supported with all test data for each of the 3 classification algorithms, is sufficient. It has been concluded that MLFFNN analysis is much more meaningful if it is used with SSR and other test data. This result is consistent with previous studies [11].
Classification success rate has been found to be 68.2% for LM, 77.3% for RP and 68.2% for SCG. These success rates indicate that there is a relationship between verbal pain scale scores, SSR and other test data. In the study of Özgöçmen et.al, it has been stated that there might be a connection between Hamilton Anxiety Test (HAM-A) and SSR [13].
This study can be considered as an interim study for determination of the relations between the other psychological test scores and biological signals.
The resulting accuracy rates can be improved by identifying new SSR parameters and adding them to the simulations as well as by different analysis methods. Also, by increasing the number of training and test data, better results can be achieved in classification analysis.
Acknowledgment
Produced from the master thesis “The SSR Data Processed Through ANN for Classification of Psychological Test Score” under the consultancy of the second author, this study was supported by the SAU Commission of Scientific Research Projects (Project No: 2012-50-01-067).
References Determination of New Bio Signal and Tests Alternative to Verbal Pain Scale for Diagnosing Fibromyalgia Syndrome
- O. Elmas, S. Yildiz, S. Bilgin, S. Demirci, S. Comlekci, H. R. Koyuncuoglu, S. Akkus, O. H. Colak, E. Koklukaya, E. Arslan, O. Ozkan, and G. Bilgin, "Physiological parameters as a tool in the diagnosis of fibromyalgia syndrome in females: A preliminary study.," Life Sci., vol. 145, pp. 51–56, Dec. 2015.
- Ö. Özkan, "Use of sympathetic skin response along with artificial neural networks in diagnosing of fibromyalgia syndrome," Sakarya University, 2012.
- M. Shipley, "Chronic widespread pain and fibromyalgia syndrome," Medicine (Baltimore)., vol. 42, no. 5, pp. 271–274, May 2014.
- S. Bilgin, E. Arslan, O. Elmas, S. Yildiz, O. H. Colak, G. Bilgin, H. R. Koyuncuoglu, S. Akkus, S. Comlekci, and E. Koklukaya, "Investigation of the relationship between anxiety and heart rate variability in fibromyalgia: A new quantitative approach to evaluate anxiety level in fibromyalgia syndrome.," Comput. Biol. Med., vol. 67, pp. 126–35, Dec. 2015.
- S. Fischer, J. M. Doerr, J. Strahler, R. Mewes, K. Thieme, and U. M. Nater, "Stress exacerbates pain in the everyday lives of women with fibromyalgia syndrome-The role of cortisol and alpha-amylase.," Psychoneuroendocrinology, vol. 63, pp. 68–77, Jan. 2016.
- R. Goulart, C. Pessoa, and I. Lombardi, "Psychological aspects of juvenile fibromyalgia syndrome: a literature review," Rev. Bras. Reumatol. (English Ed., Oct. 2015.
- T. V Ting, K. Barnett, A. Lynch-Jordan, C. Whitacre, M. Henrickson, and S. Kashikar-Zuck, "2010 American College of Rheumatology Adult Fibromyalgia Criteria for Use in an Adolescent Female Population with Juvenile Fibromyalgia.," J. Pediatr., vol. 169, pp. 181–187.e1, Nov. 2015.
- M. Boden, "A guide to recurrent neural networks and backpropagation," Electr. Eng., no. 2, pp. 1–10, 2001.
- M. R. Bozkurt, "Preprocessing and Classification of EMG Signals by Using Modern Methods," Sakarya University, 2007.
- M. Riedmiller and H. Braun, "A direct adaptive method for faster backpropagation learning: the RPROP algorithm," IEEE Int. Conf. Neural Networks, vol. 1, pp. 586–591, 1993.
- N. D. Ahuja, a. K. Agarwal, N. M. Mahajan, N. H. Mehta, and H. N. Kapadia, "GSR and HRV: its application in clinical diagnosis," 16th IEEE Symp. Comput. Med. Syst. 2003. Proceedings., 2003.
- T. Saxena, S. Patidar, and M. Saxena, "Assessment of left ventricular ejection force and sympathetic skin response in normotensive and hypertensive subjects: A double- blind observational comparative case–control study," Indian Heart J., Jan. 2016.
- S. Ozgocmen, T. Yoldas, R. Yigiter, A. Kaya, and O. Ardicoglu, "R-R Interval Variation and Sympathetic Skin Response in Fibromyalgia," Arch. Med. Res., vol. 37, pp. 630–634, 2006.
- S. Bolat and Ö. Kalenderli, "Electrode Contour Optimization by Artificial Neural Network with Levenberg-Marquardt Algorithm," in IJCI Proceedings of Intl. XII. Turkish Symposium on Artificial Intelligence and Neural Networks, 2003, vol. 1, pp. 408–412.
- L. S. H. Ngia and J. Sjoberg, "Efficient training of neural nets for nonlinear adaptive filtering using a recursive Levenberg-Marquardt algorithm," IEEE Trans. Signal Process., vol. 48, no. 7, pp. 1915–1927, 2000.
- M. F. Møller, "A scaled conjugate gradient algorithm for fast supervised learning," Neural Networks, vol. 6, no. 4, pp. 525–533, Jan. 1993.
- R. Alpar, Applied Statistic and Validation - Reliability. Detay Publishing, 2010.
- D. F. Specht, "Probabilistic neural networks," Neural Networks, vol. 3, no. 1, pp. 109–118, 1990.
- T. Çakir, D. Evcik, Ü. Dündar, İ. Yiğit, and V. Kavuncu, "Evaluation of Sympathetic Skin Response and F Wave in Fibromyalgia Syndrome Patients," vol. 26, no. 1, pp. 38–43, 2011.
- J. McBeth, G. J. Macfarlane, S. Benjamin, S. Morris, and A. J. Silman, "The association between tender points, psychological distress, and adverse childhood experiences: a community-based study.," Arthritis Rheum., vol. 42, no. 7, pp. 1397–404, Jul. 1999.
- A. Dönmez and N. Erdoğan, "Fibromyalgia Syndrome," Clin. Dev., pp. 60–64, 1990.
- L. Ozdemir, E. Pιnarcι, B. N. Akay, and A. Akyol, "Effect of methylprednisolone injection speed on the perception of intramuscular injection pain.," Pain Manag. Nurs., vol. 14, no. 1, pp. 3–10, Mar. 2013.
- M. McCaffery and A. Beebe, "Pain: Clinical Manual for Nursing Practice: Amazon.co.uk: Margo McCaffery, Alexandra Beebe, Jane Latham: 9780723419921: Books," 1994. [Online]. Available: http://www.amazon.co.uk/Pain-Clinical-Manual-Nursing-Practice/dp/0723419922. [Accessed: 25-Jan-2016].
- C. Mathworks, "Simscape TM User ' s Guide R 2015 b," 2015.
- M. Singh, B. . Panigrahi, and R. P. Maheshwari, "Transmission line fault detection and classification," 2011 Int. Conf. Emerg. Trends Electr. Comput. Technol., pp. 15–22, 2011.
