Determination of osteoarthritis using histogram of oriented gradients and multiclass SVM

Author: Shivanand S. Gornale, Pooja U. Patravali, Kiran S. Marathe, Prakash S. Hiremath
Journal: International Journal of Image, Graphics and Signal Processing @ijigsp
Article in issue: 12 vol.9, 2017.
Free access
Knee Osteoarthritis is most ordinary kind of joint inflammation, which often occurs in one or both the knee joints. Osteoarthritis is additionally called as 'wear and tear' process of joint that results in dynamic disintegration of articular cartilage. Cartilage is smooth substantial layer that ensures movement to occur effortlessly. In Osteoarthritis, the cartilage is inclined towards the destruction as it loses elasticity and becomes brittle. Osteoarthritis is regularly investigated from radiographic evaluation after clinical examination. In any case, a visual evaluation made by the restorative physician depends on experience that varies subjectively and is profoundly reliant on their experience. Subsequently, in order to make diagnostic process more systematic and reliable, evolution of imaging based analysis for early recognition of Osteoarthritis is required. The objective of this study is to develop a machine vision approach for investigation of Knee Osteoarthritis using region based and active shape model. The computation involves histogram of oriented gradient (HOG) method. The processed HOG elements are computed using multiclass SVM for evaluating Osteoarthritis based on Kellgren and Lawrence (KL) grading system. The classification rate of 97.96% for Grade-0, 92.85% for Grade-1, 86.20% for Grade-2, 100% for Grade-3 & Grade-4 is obtained. The results are promising and competitive which are validated by the medical experts.
Osteoarthritis, Knee X-ray, Active contour model, Histogram of oriented gradients, Multiclass SVM
Short address: https://sciup.org/15015923
IDR: 15015923 | DOI: 10.5815/ijigsp.2017.12.05
Text of the scientific article Determination of osteoarthritis using histogram of oriented gradients and multiclass SVM
Published Online December 2017 in MECS
Knee is the well developed and largest synovial joint within a human physical structure. It facilitates hinge and rotating movements as an association among upper and lower leg. In the majority articulate joints, the bone region is secured by a layer of cartilage to hold the knee joint capacity. Cartilage is smooth, firm and versatile layer that looks into the knee movement effectively.
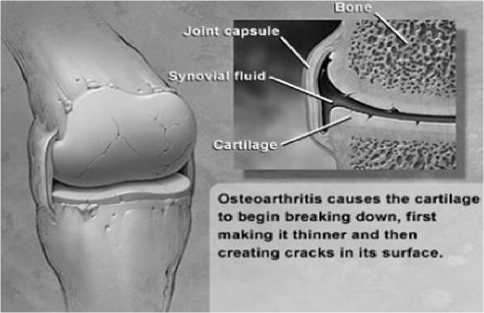
Fig.1. Knee Morphology [27]
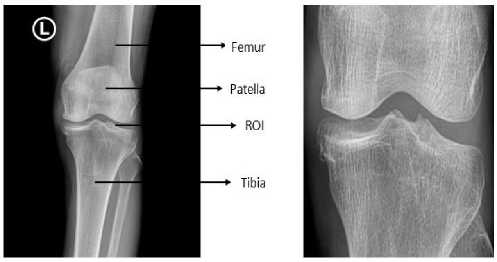
The Fig. 1 shows that, in knee Osteoarthritis, there is dynamic disintegration of articular cartilage that spreads to femur, tibia and patella at the knee joint. In Osteoarthritis (OA), the cartilage becomes noticeably weak and reduces adaptability that is slanted towards the harm [4]. Individuals with articular cartilage don't experience any pain because of the absence of blood stream or nerve endings in cartilage. Pain is experienced only when the bones rub against bones. Knee Osteoarthritis is commonly analyzed from radiographic assessment after clinical examination [5]. Different x-ray parameters identified with Knee Osteoarthritis are narrowing of the joint space between the closures of the bones in the joint, osteophytes, sclerosis, loose bodies and so on. As depicted in the Fig. 2, clinically just a one third of individuals report pain or different indications whose X-ray images indicate OA. Various clinical manifestations are unfaltering or irregular pain in a joint, joint stiffness in the morning or after long standing, swelling in multiple joints, decreased capacity and deformations.
Osteoarthritis
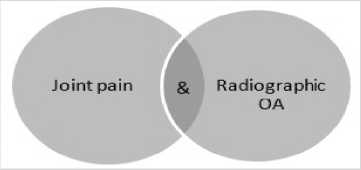

Fig.2. Clinical Manifestations [26]
The clinical reviews have affirmed that knee injury is a prime indicator for the development of knee osteoarthritis. The relationship between the joint injury and knee OA was initially depicted by Kellgren and Lawrence. The Kellgren and Lawrence (KL) grading system is most approved framework for systemization of singular joint into 5 grades [8][18]. The KL grading is shown in the Table 1.
Table 1. KL Grading System
|
KL Grades |
OA Analysis |
|
Grade 0 |
OA related Radiographic elements absent |
|
Grade 1 |
Doubtful OA(narrowing of joint space) |
|
Grade 2 |
Mild OA(definite narrowing of joint space) |
|
Grade 3 |
Moderate OA (multiple osteophytes, sclerosis) |
|
Grade 4 |
Severe OA ( large osteophytes, severe sclerosis, bone deformity) |
Any vague conclusion drawn from X-ray images of Osteoarthritis makes treatment troublesome and defective. Therefore, in order to make symptomatic process more efficient and reliable, it is required to develop a machine vision diagnostics for early detection of Osteoarthritis and severity of the disease in early stage. The more accurate detection will lead to more effective treatment for preventing further harm to delicate tissues and ligament. The main aim of the present work is to incorporate the machine vision approach that leads to more accuracy in the examination of the ailment to some extent.
The Section 2 contains the related work that incorporates diverse computer assisted diagnostics and classification of Osteoarthritis. The Section 3 focuses on the proposed methodology. The Section 4 includes the experimental and medical expert result analysis and, finally, the Section 5 contains the conclusion.
-
II. Related Work
A review of the related work reveals that numerous methodologies have been utilized for the recognition and classification of Osteoarthritis. In the literature, various computer assisted automated and semi automated strategies have been proposed to investigate the disease using X-ray and MRI images of Knee OA.
Aleksei Tiulpin et al. [1] have proposed a knee joint area localization algorithm for analysis of radiographic knee x-ray images. The overall work is divided into two parts: automatically localize the joint area and feature computation using HOG method. The outcomes show that this technique is appropriate for vast scale investigation. Also, the outcomes being one-sided and method being of higher computational complexity, it was proposed to enhance the execution by using the downscale images for joint detection and then up scaling detected region for further analysis.
Lior Shamir et al. [8] have developed a systematic computer assisted technique for recognition of OA using knee x-ray images. WND-CHRM algorithm is used to analyze the images based on various features, namely, Zernike features (first four moments), Tamura texture features, Haralick features, Chebyshev statistics and multiclass histograms. The features are classified using weighted nearest neighbour classifier. The experimental outcome specify the classification rate of 91.5% for Moderate OA against normal OA and 80.4% for Minimal OA differentiated from normal. However, it is observed that the time unpredictability for joint detection is negligible, but to classify an x-ray image it takes 105s. Further, it is proposed to include parallel processing to reduce computational complexities and consider longitudinal knee x-ray images for OA detection.
Prachi G. Bhende et al. [2] have used combination of various feature extraction methods, namely, GLCM, LBP and HOG methods for the assessment of Knee OA. However, the experimental results demonstrated that amongst the various techniques used, the rotational invariant LBP operators yielded good results. Further, it can be enhanced by expanding the neighboring pixels and including some more scale invariant components for the investigation of x-ray images.
Joseph Antony et al. [10] have investigated the use of CNNs to classify knee OA images. The CNNs, namely, VGG 16-layer net, simpler framework like VGG-M-128 and BVLC reference CaffeNet (which is on a very basic level same as AlexNet model), are used to group knee
OA images. Primarily the features were extracted from convolution pooling and fully connected layers of VGG 16, VGG-M-128 and BVLC CaffeNet and trained linear SVM to classify knee OA images. It is observed that VGG-M-128 and BVLC CaffeNet had significantly high classification accuracy as compared to previous related work.
-
S. S. Gornale et al. [3] have used a machine vision approach for the analysis of Osteoarthritis in digital knee x-ray images, wherein the joint region is determined by using active contour segmentation method. From the segmented region, various textural, shape and statistical features are computed and classified using random forest classifier, which yielded the accuracy rate of 87.92%. Further, it is inferred that the accuracy rate can be improved by considering enormous dataset and constructing a superior computational process.
-
S. S. Gornale et al. [4] have done computer assisted analysis and systemization of Knee Osteoarthritis using digital knee X-ray images. The region based, texture based and Zernike moments feature extraction methods are implemented. The computed features are classified using K-NN classifier. The experimental results indicate accuracy rate of 88.88%.
Pooja P. Kawathekar et al. [6] have used distance based active shape model to calculate the radiographic parameter associated with OA in knee X-ray images. The features are figured utilizing local binary pattern technique and are characterized into KL grades utilizing K-NN classifier. The experimental outcomes yielded classification accuracy of 93.8% for KL-0, 70% for KL-1, 4% for KL-2, 10% for KL-3 and 88.9% for KL-4. It is inferred that the LBP based approach yields better outcomes and offers higher quality in the analysis of OA detection.
-
G. W. Stachowiak et al. [13] have considered trabecular bone textures as a prime region to conduct the experiment. The evaluation of OA is done out by building an automatic decision framework utilizing hand and knee x-ray images. The created framework is appropriate in investigation of X-ray images of hands and knees. The authors presumed that the technique utilized not just differentiates OA and healthy knee joints however distinguish pre-radiographic OA bone changes. In future the authors might consider regression model for prediction of OA and try using the model for examination of other ailments like Rheumatoid Arthritis and Osteoporosis.
Lior Shamir et al. [11] have used texture based and WND-CHRM grouping technique for the determination of OA disease in knee X-ray images. The work for the most part focuses on the morphological changes in bone structures accordingly based on severity of disease. The components figured were high contrast features, Haralick features, Tamura features, statistical features and polynomial decomposition of image. The results exhibit that the bone surfaces show no huge distinction between KL grade 0 and KL grade 1. The bone structure modifications were watched only after KL grade 2 onwards. The authors presumed that the experiment concentrated on unbiased analysis of image content and farther the study can incorporate clinical information like, pain, weight, BMI, history of injuries etc which may help in clear analysis of the disease.
Liang Shan et al. [7], have developed atlas based cartilage segmentation technique that builds the bone cartilage atlas for femur and tibia, which is then used for manual femur and tibia segmentation. The work concentrates on the segmentation of femoral and tibial cartilage, with multi-atlas segmentation techniques. The method used in the work ensures the spatial detachment of femoral and tibial cartilage while saving the thin cartilage shape through anisotropic regularization. The atlas generated must help increase segmentation robustness, reduce noise consequences. The femoral and tibial areas are categorized by using k-NN classifier. The classification rate of 78.2% was achieved for femoral cartilage and 82.6% for tibial cartilage. Ultimately the authors reasoned that the segmentation techniques utilized is extremely effective and robust however has high computational cost. Along these lines in future the authors might need to lessen the computational complexities and furthermore focus on discovering cartilage thickness longitudinally.
From the literature, it is observed that several works dealt with Knee X-ray images for identification and grading of OA utilizing diverse methodologies and own datasets for experimentation. However, there is still a need to carefully examine the parameters that are concerned with OA. Further, several authors [22-25] have employed morphological processing of images and edge feature extraction and classification using active contours, Contourlets, HOG, SVM methods to obtain more accurate results suitable for different applications. In this paper, the objective is to build an appropriate and robust image processing algorithm for monitoring the OA ailment in early stage and evaluating according to the standard KL grading framework.
-
III. Proposed Methodology
The proposed methodology comprises the X-ray image preprocessing, segmentation of region of interest (OA region), HOG feature extraction and SVM classification of OA into KL grades. The block diagram of the proposed methodology is shown in the Fig 3.
-
A. Data set
For experimentation of the proposed work, own dataset is prepared by collecting 616 digital knee X-ray images by consulting various hospitals and diagnostic centers of rural and urban population. The knee x-ray images are acquired with 1345x2451 dimensions compliant with DICOM standard (Digital Imaging and Communications in Medicine). These images are primarily based on various attributes, namely, age, gender, blood group, occupation and weight, of patients. Each knee X-ray image was assigned a KL grade by two different medical experts. The two experts are orthopedicians who read 50 to 100 radiographic images every day. The total number
of images with different KL grading by two experts is given in the Table 2.
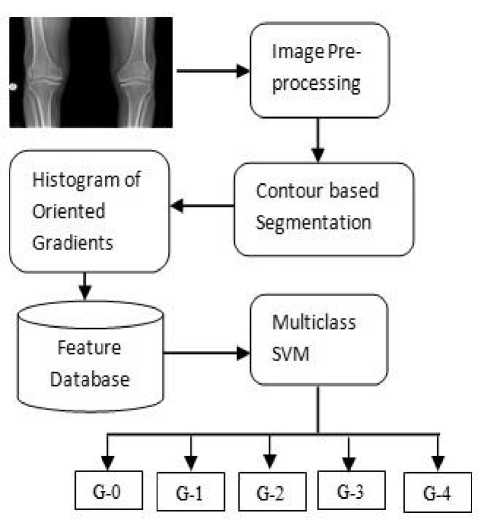
Fig.3. Block Diagram of the proposed methodology (G-0: Normal, G-1: Doubtful, G-2: Mild, G-3: Moderate, G-4: Severe)
C. Image Segmentation
Image segmentation is a process of partitioning an image into multiple sub-areas based totally on most well-understood characteristic of objects in the image. For image segmentation, active contours are in popular use for many applications in medical image processing. Active contour methods detect boundaries of irregularshaped objects which are represented in the Eq. (1).
Ф ( u , v ) =’
d ( u , v , C )
- d ( u, v, C )
( u, v ) e C ( u , v ) e R out ( u , v )e Rin
Table 2. KL grades assigned by two Medical Experts
|
KL Grade |
Medical Expert-I |
Medical Expert-II |
|
Normal(G-0) |
246 |
257 |
|
Doubtful(G-1) |
252 |
241 |
|
Mild(G-2) |
58 |
58 |
|
Moderate(G-3) |
25 |
25 |
|
Severe(G-4) |
35 |
35 |
The parameters R in and R out are the regions inside and outside the contour C. The function d(u,v,C) returns the smallest Euclidean distance from point (u,v) to the contour C [24].
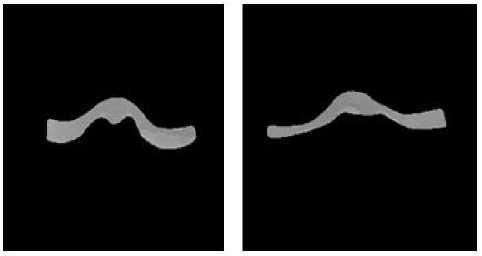
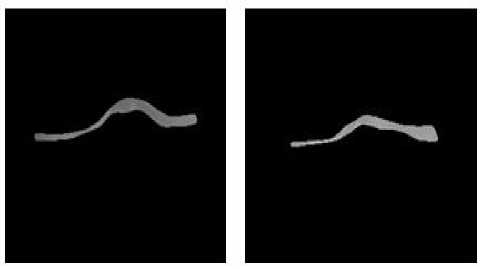
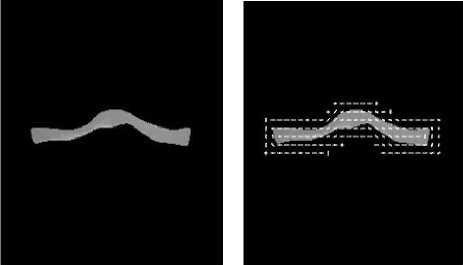
The active contour process can be normally divided into two categories, the explicit active contours presented by point sets and the implicit active contours presented by level set functions [22]. In this work, by using implicit active contour, the region of interest for a given knee x-ray is segmented by considering specific 12x12 window (mask), which act as an input to active contour model of Chan-Vese method. The boundaries of targeted mask are used by active contour as the initial state of contour evolution [17]. The foreground and background regions of the input image are segmented. The region of interest, namely, the region between femur and tibia, is segmented and then used for feature computation. The outcome of image segmentation grade-wise is shown in the Figs. 5(a)-5(e).
-
B. Pre-processing
Image pre-processing is one of the prime steps in digital image processing which is application dependent. X-ray images of a knee are converted into gray scale images. Further, in order to extract proper region of interest, images are cropped to 512x409 pixels and finally rescaled to [255x255]. The input X-ray and pre-processed image are shown in the Fig. 4(a) and 4(b), respectively.
(a) (b)
(a ) (b)
Fig.4(a). Knee X-ray image (b). Pre-processed image
(c) (d)
(e)
Fig.5. Segmented images grade-wise: (a) Normal (G-0), (b) Doubtful (G-1), (c) Mild (G-2), (d) Moderate (G-3), (e) Severe (G-4).
Direction
(c)
-
D. Feature Extraction
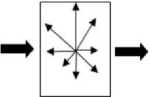
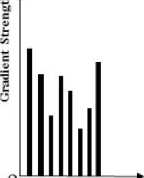
Histogram of orientated gradients (HOG) is a function vector or feature descriptor that is beneficial in image analysis and object recognition. The HOG descriptors constitute the primary traits that encode object characteristics into a series of particular numbers that may be used to distinguish objects from each other [2]. Primarily, the HOG features are computed from blocks of size 12x12 pixels of the segmented knee X-ray image [23].
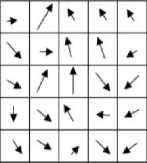
Each block inside the grid is further divided to smaller cells, in which the gradients are computed. Gradients are the rates of local intensity changes at a particular image pixel position [2][9]. Gradient is a vector quantity that has both magnitude and direction [23]. The magnitude and direction of gradient at pixel(x, y) are given in Eqs.(2) and (3), respectively.
V ( x , У ) = 7 V x ( x, y ) 2 + V y ( x , y ) 2 (2)
a( x, y) = arctan[ V x ( x, y)/ V y ( x, y )] (3)
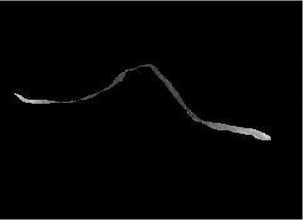
The visualization of HOG of segmented image in the Fig. 6(a) is shown in the Fig. 6(b). The pictorial representation of image gradients and histogram of cell and orientation is shown in the Fig 6(c). Each pixel will now have an orientation and magnitude for the edge lying on it. Assemble a histogram for every orientation in a cell utilizing discrete orientation bins (from 0 to 360 degrees).
(a) (b)
Fig.6(a) Segmented image (b) HOG Visualization of image in Fig.6(a) (c) Image gradients with orientation and cell histogram
Use the magnitude as prime factor in the histogram and link these cell histograms for each block which are further directed into a HOG descriptor vector.
-
E. Classification
The experiment consists of a dataset of 616 digital knee X-ray images with DICOM (Digital Imaging and Communications in Medicine) standards, which are categorized into 5 different classes, namely, normal, doubtful OA, mild OA, moderate OA and severe OA. There are many dominant binary classifiers but these learning techniques for multi-class problems become insolvent [20]. However, error-correcting output code (ECOC) is one of the successful supporting structures to manage such multi-class issues [14][19].
Error-correcting output code can be ordered into two phases: coding design and decoding scheme. The coding design prompts the classes that binary learners train and a decoding scheme decides how these expectations of binary classifiers are accumulated.
In the present work, the number of classes are 5, One-versus-One coding design is considered having 5(5-1)/2 = 10 learners, that are represented from L1-L10. For each binary learner, one group is positive another is negative and the rest are disregarded. The one-versus-one coding design is given in the Table 3
Table 3. Coding matrix with 10 Learners
|
Class |
L1 |
L2 |
L3 |
L4 |
L5 |
L6 |
L7 |
L8 |
L9 |
L10 |
|
Normal |
1 |
1 |
1 |
1 |
0 |
0 |
0 |
0 |
0 |
0 |
|
Doubtful |
-1 |
0 |
0 |
0 |
1 |
1 |
1 |
0 |
0 |
0 |
|
Mild |
0 |
-1 |
0 |
0 |
-1 |
0 |
0 |
1 |
1 |
0 |
|
Moderate |
0 |
0 |
-1 |
0 |
0 |
-1 |
0 |
-1 |
0 |
1 |
|
Severe |
0 |
0 |
0 |
-1 |
0 |
0 |
-1 |
0 |
-1 |
-1 |
The row of coding matrix represents a distinct class and column represents a binary learner. Learner1 (L1) trains on observation having class normal and class doubtful, in which class normal is considered as positive class and class doubtful as negative class. The other learners are trained similarly. The decoding phase decides how well a binary learner groups a perception into the classes. During decoding process, a yield vector is acquired which is contrasted with each codeword in the coding framework and the class whose codeword has the nearest separation to the output vector is picked as the anticipated class [21]. The decoding scheme uses binary loss function that helps in producing minimum binary loss over binary learners, which is given in Eq. (4).
. arg min . X И KI® ( muv, sl )" X ,‘, k\ where,
-
• muv is component ( u,v ) of the coding design matrix M
(the code relating to class u of binary learner l )
-
• sl be the score of binary learner l for an observation
-
• g be the binary loss function
-
• .-: be the predicted class for the observation
ECOC models can improve classification accuracy, even as compared to other multiclass models.
-
IV. Experimental Analyses
For the experimentation of the proposed method, own dataset consisting of 616 digital Knee X-ray images with DICOM standards is built in consultation with medical experts. These images are collected from various hospitals and diagnostic centers. The feature computation involves histogram of oriented gradient (HOG) method. The computed gradients are classified using multiclass SVM classifier. The proposed algorithm is given below.
Input: Digital Knee X-ray image.
Output: Normal or Affected image (grade-wise)
Step-1: Pre-processing of X-ray images that include cropping ROI, gray scale conversion and image resize.
Step-2: Image segmentation using active contour algorithm.
Step-3: Histogram of oriented gradients are extracted from each segmented image for further classification.
Step-4: Classification of computed HOG features using multiclass SVM.
Step-5: End
The proposed method is implemented using MATLAB R2016 (a) with Corei3-4030U Processor and 4GB RAM. The classification results are represented in the confusion matrices with reference to the two medical experts I and II as given in the Tables 4 and 5, respectively.
From the Table 4, it is found that out of 246 images of KL G-0(Normal) class, 241 images were correctly classified and 5 images were misclassified as KL G-
1(Doubtful). Thus, the accuracy rate obtained for KL G-0 is 97.96%. Similarly, for KL G-1 (Doubtful) class, out of 252 images, 234 images were correctly classified and 18 images were misclassified yielding accuracy rate of 92.85%. For KL G-2(Mild) class, out of 58 images, 50 images were correctly classified and 8 images were misclassified obtaining the accuracy rate of 86.20%. Finally, for KL G-3(Moderate) and G-4(Severe) classes, the accuracy rate of 100% is obtained, i.e., no misclassification is observed.
Table 4. Confusion Matrix of classification by the proposed method as compared to Medical Expert-I opinion
|
Class |
Classification by proposed method |
Expert-I Opinion |
||||
|
Normal |
Doubtful |
Mil -d |
Modera -te |
Seve -re |
||
|
Normal (G-0) |
241 |
18 |
5 |
0 |
0 |
246 |
|
Doubtful (G-1) |
5 |
234 |
3 |
0 |
0 |
252 |
|
Mild (G-2) |
0 |
0 |
50 |
0 |
0 |
58 |
|
Moderate (G-3) |
0 |
0 |
0 |
25 |
0 |
25 |
|
Severe (G-4) |
0 |
0 |
0 |
0 |
35 |
35 |
|
Total |
246 |
252 |
58 |
25 |
35 |
616 |
Table 5. Confusion Matrix of classification by the proposed method as compared to Medical Expert-II opinion
|
Class |
Classification by proposed method |
Expert-II Opinion |
||||
|
Normal |
Doubtfu -l |
Mild |
Mode -rate |
Seve -re |
||
|
Normal (G-0) |
252 |
18 |
6 |
0 |
0 |
257 |
|
Doubtful (G-1) |
5 |
222 |
3 |
0 |
0 |
241 |
|
Mild (G-2) |
0 |
1 |
49 |
0 |
0 |
58 |
|
Moderate (G-3) |
0 |
0 |
0 |
25 |
0 |
25 |
|
Severe (G-4) |
0 |
0 |
0 |
0 |
35 |
35 |
|
Total |
257 |
241 |
58 |
25 |
35 |
616 |
From the Table 5, it is observed that for KL G-0 class, out of 257 images 252 images were correctly labeled as ‘G-0’ and 5 images were mislabeled yielding the accuracy rate of 98.05%. Further, for KL G-1 (Doubtful) class, out of 241 images, 222 images were correctly labeled as G-1 and 19 images were misclassified obtaining the accuracy rate of 92.11%. For KL G-2(Mild) class, out of 58 images, 49 images were correctly classified and 9 images were misclassified obtaining the accuracy rate of 84.48%. Finally, for KL G-3(Moderate) and G-4(Severe) classes, the accuracy rate of 100% is obtained, i.e., no misclassification is observed.
The graphical representation of classification accuracy for the five classes with reference to the medical experts I and II is shown in the Fig 7. It is observed that the classification results validated by the two experts are in close agreement.
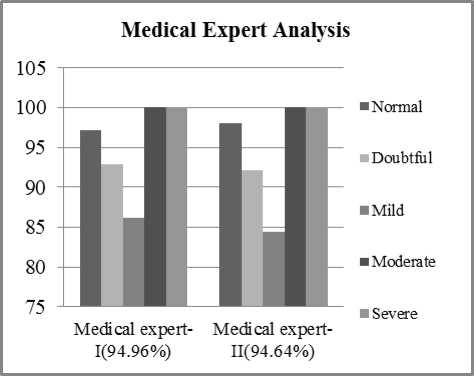
Fig.7. Graphical Representation of expert analysis
The proposed method has yielded better results as compared to the methods in [3] and [4]. In [3], active contour segmentation method is used to acquire the region of interest and then various features, namely, Haralick, texture, geometrical and statistical features, are computed and classified using random forest classifier. The recognition rate of 87.92% is obtained. In [4], Zernike moment features are computed to capture the shape and boundary information for more specific analysis of disease, keeping the segmentation technique same as in [3]. The K-NN classifier is used and better classification rate of 88.88% is obtained as compared to the results in [3]. The proposed method has outperformed the methods in [3] and [4] by achieving classification accuracy of 95% (approx.).
-
V. Conclusion
In this paper, the knee X-ray images annotated by two medical experts, are used for experimentation of the proposed method for automation of OA detection using image processing technique Undoubtedly, the visual inspection by two experts varies in differentiating the KL grading of knee OA. The experimental results validated by the experts are found to be in close agreement. The proposed method is of potential use in the study of disease severity investigation of the patients and also helpful in unbiased assessment of knee OA. Thus, the patients experiencing the OA disease get precision diagnosis and appropriate treatment in early stage itself, which leads to minimal tissue harm, speedier recovery, less medications and alleviation of pain of patients, and thus reducing the overall cost. In this work, active contour algorithm is used to segment the region of interest in knee x-ray image. The HOG features are computed and multiclass SVM is employed for classification. The proposed method has outperformed the methods in [3] and [4] by achieving classification accuracy of 95% (approx.). In future work, the aim is to enhance segmentation accuracy and classification rate by using still better methods for preprocessing, segmentation and classification.
Acknowledgement
References Determination of osteoarthritis using histogram of oriented gradients and multiclass SVM
- Aleksei Tiulpin, Jerome Thevenot, Esa Rahtu, and Simo Saarakkala “A novel method for automatic localization of joint area on knee plain radiographs”, Scandinavian Conference on Image Analysis (SCIA) 2017, 1 February 2017, DOI: 10.1007/978-3-319-59129-2_25, Cited as: arXiv: 1701.08991[cs.CV], pp.290-301,
- Prachi.G.Bhende, Dr.A.N.Cheeran “A Novel Feature Extraction Scheme for Medical X-Ray Images”, International Journal of Engineering Research and Applications, (Part -6) February 2016, ISSN: 2248-9622, Vol. 6, Issue 2, pp.53-60.
- Shivanand S. Gornale, Pooja U. Patravali, Ramesh R. Manza, “Detection of Osteoarthritis using Knee X-Ray Image Analyses: A Machine Vision Based Approach”, International Journal of Computer Applications (IJCA), ISSN-0975-8887, Volume 145, Number 1, July 2016,pp.20-26.
- Shivanand S. Gornale, Pooja U. Patravali, Ramesh R. Manza, “Computer Assisted Analysis and Systemization of knee Osteoarthritis using Digital X-ray images”, Book of Abstract of International Conference on Cognitive Knowledge Engineering(ICKE) , 21-23 December 2016 , Dr.Babasaheb Ambedkar Marathwada University, Aurangabad, Maharashtra.
- Shivanand S. Gornale, Pooja U. Patravali, Ramesh R. Manza“A Survey on Exploration and Classification of Osteoarthritis Using Image Processing Techniques”, International Journal of Scientific & Engineering Research, Volume 7, Issue 6, June-2016 ISSN 2229-5518 ,pp.334-355.
- Pooja P. Kawathekar &Kailash Karande “Severity analysis of Osteoarthritis of knee joint from X-ray images: A Literature review”, 2014 International Conference on Signal propagation and computer technology (ICSPCT 2014), 2014 DOI: 10.1109/ICSPCT.2014.6885008, Electronic ISBN: 978-1-4799-3140-8, CD-ROM ISBN: 978-1-4799-3139-2, ©2005IEEE, pp.648-652.
- Liang Shan, Cecil Charles, Marc Niethammer “Automatic Atlas-based Three-label Cartilage Segmentation from MR Knee Images”, 2012 IEEE workshop on Mathematical methods in Biomedical Image Analysis, MMBIA,2012, Breckenridge, CO, United States, PMCID: PMC3656482, NIHMSID: NIHMS368833, pp.241-246.
- Lior Shamir, Shari M.Ling,William W.Scott, Angelo Bos, Nikita Orlov, Tomasz Macura, D.Mark, Luigi Ferrucci, Ilya G.Goldberg “Knee X-ray Image Analysis Method for Automated Detection of Osteoarthritis”, IEEE Transactions on Biomedical Engineering, February 2009, Volume 56, No.2, DOI: 10.1109/TBME.2008.2006025, pp.407-415.
- Navneet Dalal and Bill Triggs “Histograms of Oriented Gradients for Human Detection”, Proceedings of the 2005 IEEE Computer Society Conference on Computer Vision and Pattern Recognition(CVPR’05), Volume 1, Print ISBN: 0-7695-2372-2, Print ISSN: 1063-6919, DOI:10.1109/CVPR.2005.177, pp.886-893.
- Joseph Antony, Kevin Mc Guinness, Noel E O’Connor, Kieran Moran, “Quantifying Radiographic Knee Osteoarthritis Severity using Deep Convolutional Neural Networks”, International Conference on Pattern Recognition (ICPR)2016, 8th September 2016, ISBN: 978-1-5090-4847-2 DOI: 10.1109/ICPR.2016.7899799.Cited as: arXiv:1609.02469[cs.CV].
- Lior Sharmir, Salim Rahimi, Nikita Orlov, Luigi Ferrucci, Ilya G. Goldberg “Progression analysis and stage discovery in continuous physiological process using image computing”, Hindawi Publishing Corporation, EURASIP Journal on Bioinformatics and Systems Biology, 2010, Article ID 107036,Volume 2010, No.1, DOI:10.1155/2010/107036, PMCID: PMC3171360.
- Thomas G.Dietterich, Ghulum Bakiri, “Solving Multiclass learning problem via Error correcting output codes”, Journal of Artificial Intelligence Research, 1995 Volume 2, Issue 1, DOI:10.1613/jair.105,pp. 263-286.
- G.W. Stachowiak, M. Wolski, , T. Woloszynski, P. Podsiadlo, “Detection and prediction of osteoarthritis in knee and hand joints based on the X-ray image analysis”, Biosurface and Biotribology, Volume 2, Issue 4, December 2016, DOI: 10.1016/j.bsbt.2016.11.004, pp. 162-172.
- Gareth James and Trevor Hastie, “The error coding method and picts”, Journal of Computational and Graphical Statistics, Volume 7, No.3, September 1998, DOI:10.1080/10618600.1998.10474782, pp.377–387.
- Bhagyashri L.Wagaj, M.M.Patil “Osteoarthritis Disease Detection with the help of Image processing technique”, International Journal of Computer Applications (0975-8887), Conference on Emerging Applications of Electronic System, Signal Processing and Computing Technologies 2015,Volume 42, No.19, pp:1-4.
- Bindushree R, Sanjeev Kubakaddi, Nataraj Urs “ Detection of Knee Osteoarthritis by Measuring the Joint Space Width in Knee X ray Images”, International Journal of Electronics & Communication, April 2015, ISSN 2321-5984, Volume 3, Issue 4, pp.18-21.
- V. Caselles, R. Kimmel, G. Sapiro, “Geodesic active contours”, International Journal on Computer Vision, July 1995, Volume 22, Issue 1, DOI: 10.1023/A: 1007979827043, pp. 61-79
- Tati L.Mengko,Rachmat G, Wachjudi, Andriyan B.Suksmono, Dony Danudirdjo “Automated Detection of Unimpaired Joint Space for Knee Osteoarthritis Assessment”, Proceedings of 7th International Workshop on Enterprise networking and computing in Healthcare Industry, 2005. HEALTHCOM, 29th August 2005, ©2005 IEEE, Print ISBN: 0-7803-8940-9, DOI: 10.1109/HEALTH.2005.1500491, pp.400-403.
- Sergio Escalera, Oriol Pujol, Petia Radeva “Separability of ternary codes for sparse designs of error-correcting output codes”, Journal Pattern Recognition Letters, Volume 30, Issue 3, February 2009, Elsevier Science Inc. New York, NY, USA, DOI: 10.1016/j.patrec.2008.10.002, pp. 285–297.
- Allwein, E., R. Schapire, and Y. Singer. "Reducing multiclass to binary: A unifying approach for margin classifiers”, Journal of Machine Learning Research. Volume 1, 2000, DOI:10.1162/15324430152733133, pp.113-141.
- Escalera, S., O. Pujol, and P. Radeva. "On the decoding process in ternary error-correcting output codes." IEEE Transactions on Pattern Analysis and Machine Intelligence, 2010, Volume 32, Issue 7, Print ISSN: 0162-8828, DOI: 10.1109/TPAMI.2008.266, pp. 120–134.
- K.R.Ananth, Dr.S.Pannirselvam “A Geodesic Active Contour Level Set Method for Image Segmentation”, I.J. Image, Graphics and Signal Processing(IJIGSP), MECS Publisher, 2012, Volume 4 , No.5, June 2012, ISSN: 2074-9074 (Print), ISSN: 2074-9082(Online), DOI: 10.5815/ijigsp.2012.05.04, pp. 31-37,
- Leo Pauly, Deepa Sankar, “Non Intrusive Eye Blink Detection from Low Resolution Images Using HOG-SVM Classifier”, I.J. Image, Graphics and Signal Processing (IJIGSP), MECS Publisher, 2016, Volume 8, No.10, October 2016, ISSN: 2074-9074 (Print), ISSN: 2074-9082(Online), DOI: 10.5815/ijigsp.2016.10.02, pp.11-18.
- Nasrin Salehi, Maryam Keyvanara and Seyed Amirhassan Monadjemmi, “An Automatic Video-based Drowning Detection System for Swimming Pools Using Active Contours”, I.J. Image, Graphics and Signal Processing (IJIGSP), MECS Publisher, 2016, Volume 8, No.8, August 2016, ISSN: 2074-9074 (Print), ISSN: 2074-9082(Online), DOI: 10.5815/ijigsp.2016.08.01, pp.1-8.
- Shivananda V. Seeri, J. D. Pujari and P. S. Hiremath, “Text Localization and Character Extraction in Natural Scene Images using Contourlet Transform and SVM Classifier”, I.J. Image, Graphics and Signal Processing(IJIGSP), May 2016, Volume 8, No.5, DOI: 10.5815/ijigsp.2016.05.02, pp.36-42.
- https://www.slideshare.net/ulvanozad/osteoarthritis-32679777.
- http://www.davidlnelson.md/articles/Osteoarthritis.htm.
