Determination of reproduction accuracy of dot area of irregular structure

Author: Mykola Logoida, Bogdana Havrysh, Doroshenko Anastasiya
Journal: International Journal of Information Engineering and Electronic Business @ijieeb
Article in issue: 1 vol.10, 2018.
Free access
The paper deals with the analysis and calculation of the impact of raster element structure on the reproduction accuracy of the area. The process of screening is one of the important stages of preparing images for printing. Depending on the method of forming of an area of a printing element are distinguished: continuous, which is conventionally called analog screening, and screening with their discrete variables - digital screening. Digital screening systems are widely used in computer publishing systems. In the digital screening of forming shape and sizes of raster elements carried out discrete using raster image processor (RIP). A well-known fact is that the value of the dot area is a key information-bearing parameter of discrete screening since reproduction of halftone key in a raster image is carried out by changing the dot area. It is therefore an important and relevant task to determine the dot area.
Raster element, discrete screening, number of gray tones, raster elements of irregular structure, discrete unit of area
Short address: https://sciup.org/15016117
IDR: 15016117 | DOI: 10.5815/ijieeb.2018.01.02
Text of the scientific article Determination of reproduction accuracy of dot area of irregular structure
Published Online January 2018 in MECS
Owing to the achievements in computer graphics the printing industry widely employs the methods of raster and vector graphics for processing texts and illustrations, methods of digital image processing, discrete raster transformation necessary for production and exposure of printing plates. However, raster transformation has its own peculiarity caused by the fact that discretization is achieved through the change of geometrical dimension of the elements while the carrier of information is the area of raster elements placed in a raster cell corresponding to the tone of an image [1, 2, 3]. At the end of former century various new raster structures were developed, such as frequency-modulated (Fig.1), amplitude modulated (Fig.2) and hybrid (AM + FM) structures [4].
With AM screening, the most widely used form of screening today, the position and angle of dots remains fixed, but the size of each dot is varied to reproduce the effect of continuous tone [5, 6].
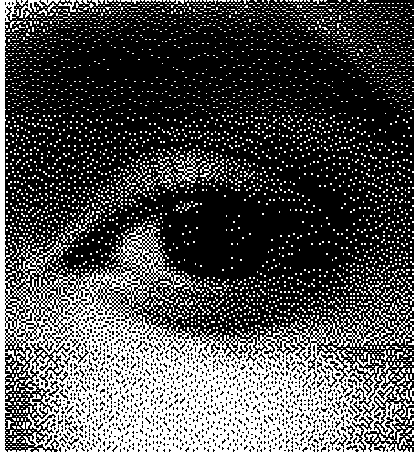
Fig.1. An example of FM screening
On the other hand, FM screening (or stochastic screening) uses dots of the same size, but places them randomly in varying amounts to reproduce continuous tone.
With the FM method, it is possible to produce very fine detailed print and eliminate the moiré and broken lines associated with AM screening. With the FM method, it is possible to produce very fine detailed print, highlight, and shadow areas, and eliminate the moiré and broken lines associated with AM screening [5, 6].
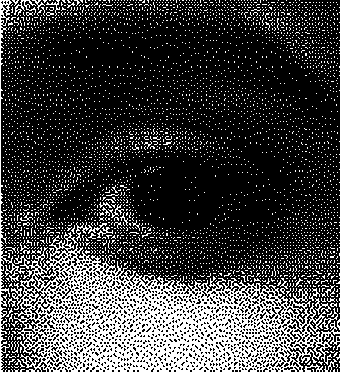
Fig.2. An example of amplitude modulated ascreening
Hybrid screening technologies (Fig. 3) have attempted to combine the benefits of both and eliminated the drawbacks. The ultimate goal is to take advantage of the high-quality and high-productivity capabilities of CtP and provide a screen technology capable of rendering flawless high screen rulings with minimal effort in prepress or on press [7].
Hybrid screening technology represents an attempt to compensate for the shortcomings inherent in AM and FM screening. It applies AM algorithms to midtones, and FM to highlights and shadows. The problem with hybrid methodology occurs at the changeover from AM to FM. In most hybrid techniques, the intersection between AM and FM is discernible with the naked eye, and the complicated screening algorithms can slow the pre-press process [7].
The hybrid screening technologies all ensure that the dot size isn't smaller than what can be safely reproduced in the printing process at hand. In the highlights and deep shadow parts, the hybrid screens use FM (or FM-similar) technology to render the screen. In the midtones, most of the hybrid screens use conventional AM (or AM-like) screening technology, thus avoiding the risk of a grainy look. [5, 6].In this way, the printing characteristics will also be very similar to conventional AM-based screening.
While hybrid screening is attractive for most printing applications, its benefits are most obvious in newsprint and flexo. In flexo (and newsprint), disappearing highlights is a constant problem. This is made worse in flexo with the unstable behavior of the dot gain in the near-highlight areas.
An accurate reproduction elements traditional for printing of round and even square raster upon their discrete formation may be achieved subject to the high resolution of CtP devices. Increase of the accuracy of reproduction of the shape of a raster element results in the reduction of the tones of grey and the interval of tone rendering that significantly decreases the quality of raster prints. Contradiction between dimensions of a raster cell and the number of grey tones may be weakened by approximated formation of canonical shape of raster element of non-regular structure [8].
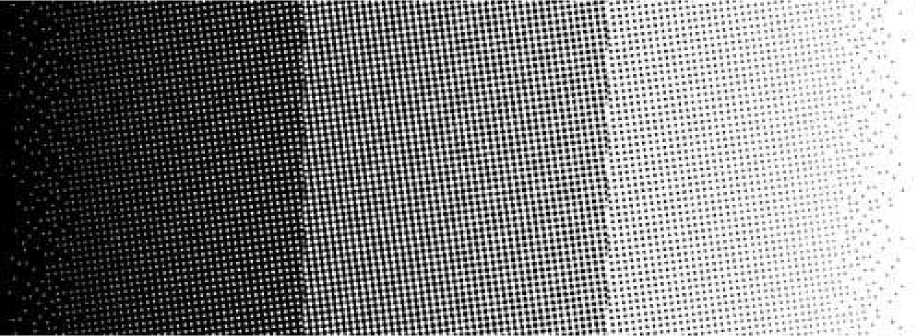
Fig.3. An example of Heidelberg Prinect Hybrid screening
One of the quality indicators of raster image reproduction is the number of gray tones (Fig. 4). Raster elements that have no correct geometrical shape are used quite frequently to increase the number of gray tones. Such units are called raster elements of irregular structure.
The lines of a cell may be composed of individual segments, or microelements on a raster grid. For example, such structures of raster elements are used that consist of four, six or more detached microelements on the raster grid [3, 9, 10].
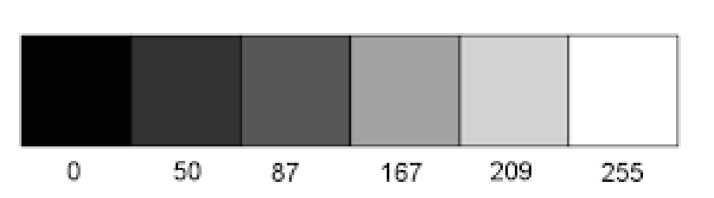
Fig.4. An example of grayscale with different values of the number of gray tones
It should be noted that the set value of the dot area at discrete formation does not depend on the shape of the element and their location on the raster grid. However, it greatly affects the accuracy of the areas of formed elements, exposed platemaking plates and their reproduction in a raster print. Thus, the shape of raster elements should provide minimum distortion of their area in platemaking and printing processes [2, 8].
-
II. Research Problem
Given the irregular structure of the raster element, the lines are made up of individual segments and separate microelements. Each segment and line microelement we assign a weight that corresponds to its length and is determined by the number of discrete units of the area [11]
w ^ , W 2 , W i3 ,.-, W im , i = 1,2,3,..., n , (1)
where m – the number of segments in a line.
Under these conditions, we shall define the line area, which consists of individual segments
m
Si = — w m . (2)
= 1
Then the area of the raster element of irregular structure is nm
S = ZZ w m . (3)
= 1 j = 1
In the event of line scanning, segments reproduction error, formed in the line, constitutes a half of the grade of the grid cell. Then according to the expression (2) we determine the line reproduction error
m
A S , = Z A Sm (4)
j = 1
Hence, the absolute error by the dot area of irregular structure formed of segments is nm
A S = — A S m . (5)
= 1 j = 1
Thus, the absolute error of raster elements of irregular structure depends on the number of segments in lines. By comparing the expressions (6 - to determine the absolute error by the regular dot area)
A S = — A Si , i = 1,2,3..., n , (6)
i = 1
and (5), we conclude that raster elements of irregular structure have a greater error than those of a canonical shape. Maximum value of absolute error by the area comes under the condition that the unit of irregular structure is shaped like a chessboard, then the error for the raster element of n×n size is
2 n
A S max 0.5 . (7)
By comparing the maximum absolute error by the area, the raster element of canonical shape (6) and irregular structure (7), we conclude that it is n/2 times bigger, which is a drawback of irregular structures of raster elements.
We shall also determine the relative error of raster element of irregular structure. If the absolute error is known (5), then the relative error by the area of raster element of irregular structure is aS = —у уASm%.(8)
100 -i:!
Usually, in most cases, printing production makes use of the reduced error to the cell area
100 n m
5Sp = — — Sm %
Sc i=1
where S – a cell area, where the raster element of irregular structure is formed.
Maximum value of the reduced error by the area provided that irregular raster element is shaped like a chessboard
5Smax = 0.5100% = 25% (10)
Thus, the maximum reduced error by the dot area of irregular structure makes 25% and is independent of the dimension of the raster cell, which is a drawback of raster elements of irregular structure.
The magnitude of the error largely depends on the raster element structure. Hence, for example, we shall define and analyze the error of raster elements with different structures (Fig. 5), which are formed in the cell of 8×8 dimension.
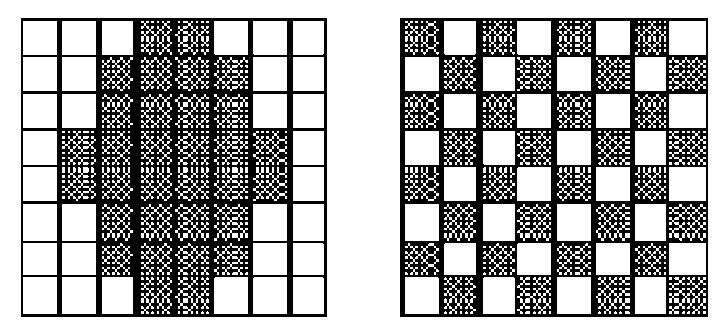
(a) (b)
Fig.5. Chart of raster elements of different structures
The first raster element is formed of eight consecutive continuous lines of different lengths. Instead, the second element is formed of individual microelements, which has the shape of a chessboard. The degree of coverage of both cells is identical and makes 50% given the area of 32 dua (discrete unit of area). With the reference to expressions (5 and 7) we determined the absolute and relative errors of raster element from Fig. 5 a, the results of which are presented in Table 1.
Also, the results of calculations have shown in graphical view on fig. 6.
Table 1. Results of calculations of errors for raster elements formed of eight consecutive continuous lines of different lengths
|
Parameters |
Numeric values |
|||||||
|
Sequence of lines |
1 |
2 |
3 |
4 |
5 |
6 |
7 |
8 |
|
Number of segments |
1 |
1 |
1 |
1 |
1 |
1 |
1 |
1 |
|
Weight of line, w |
2 |
4 |
4 |
6 |
6 |
4 |
4 |
2 |
|
Line area, S , dua |
2 |
4 |
4 |
6 |
6 |
4 |
4 |
2 |
|
Line error A Si, dua |
0.5 |
0,5 |
0,5 |
0,5 |
0,5 |
0,5 |
0,5 |
0,5 |
|
Line relative error, % |
25 |
12.5 |
12.5 |
8.333 |
8.333 |
12.5 |
12.5 |
25 |
|
Line reduced error, % |
6.25 |
6.25 |
6.25 |
6.25 |
6.25 |
6.25 |
6.25 |
6.25 |
|
Element absolute error, % |
4 |
|||||||
|
Element relative error, % |
12.5 |
|||||||
|
Element reduced error, % |
6.25 |
|||||||
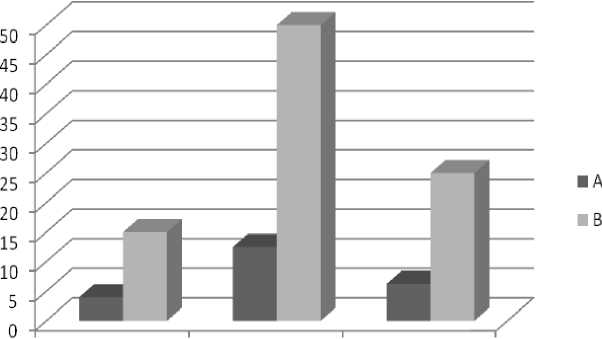
Element absolute Element relative Element reduced error, % error, % error, %
Fig.6. Graphical representation of results of calculations of errors A - for raster elements formed of eight consecutive continuous lines of different lengths, B - for raster element of a chessboard shape
According to the table 1, we can clearly observe the structure of areas distribution, reduced and relative errors of lines, of which the raster element is formed. If the line is continuous, the absolute error by the line area is 0.5dua and doesn’t depend on the length of the line. Instead, the relative error depends on the length of the line, and is within 25 - 8.33%. Short lines have big relative error and long ones - small. However, the reduced error of line does not depend on its length and makes 6.25%. Therefore, to improve the accuracy of reproduction of dot areas one shall avoid short lines that contain 1 - 2 microelements during their formation. It is worth noting that the reduced error of the line is constant, makes 6.25% and is independent of its length. Therefore, the assessment of precision of formed lines that make up the raster element by the reduced error is not objective enough.
The absolute error of raster element equals the sum of line errors and constitutes 4 dua . To decrease the absolute error it is necessary to reduce the number of lines at the expense of lines consisting of 1 - 2 microelements. However, it may cause distortion of the dot shape. Relative error of the raster element is 12.5%. According to regulatory requirements, the accuracy of reproduction the dot area is evaluated by the reduced error, which is 6.25%.
Similarly, we determine the absolute and relative errors of raster element of a chessboard shape (Fig. 5, b ), the results of which are presented in Table 2.
Table 2. Results of calculations of errors for raster element of a chessboard shape
|
Parameters |
Numeric values |
|||||||
|
Sequence of lines |
1 |
2 |
3 |
4 |
5 |
6 |
7 |
8 |
|
Number of segments |
4 |
4 |
4 |
4 |
4 |
4 |
4 |
4 |
|
Weight of line, w |
1 |
1 |
1 |
1 |
1 |
1 |
1 |
1 |
|
Line area, Si , dua |
4 |
4 |
4 |
4 |
4 |
4 |
4 |
4 |
|
Line error Δ Si , dua |
2 |
2 |
2 |
2 |
2 |
2 |
2 |
2 |
|
Line relative error, % |
50 |
50 |
50 |
50 |
50 |
50 |
50 |
50 |
|
Line reduced error, % |
25 |
25 |
25 |
25 |
25 |
25 |
25 |
25 |
|
Element absolute error, % |
16 |
|||||||
|
Element relative error, % |
50 |
|||||||
|
Element reduced error, % |
25 |
|||||||
-
III. Conclusion
Accordingly, we conclude that the structure of distribution of areas, reduced and relative errors of lines of raster elements that are shaped like a chessboard is quite different from those in raster elements formed of a sequence of continuous lines of different lengths. The area of all lines is the same and makes 4 dua . The absolute error of all lines is the same and makes 2 dua , hence four times higher than in the previous case. The relative error of lines is extremely big, which is 50%, and the reduced error - 25%. Thus, the line errors of raster elements formed like a chessboard is several times higher than the lines formed of a sequence of continuous lines, which is their drawback.
The absolute error of raster element is 16 dua, relative – 50%, and reduced - 25%. Thus, the raster element that is of a chessboard shape does not largely meet the regulatory requirements by the accuracy of area reproduction. Therefore, raster elements that are shaped like a chessboard are worse than the elements of irregular shape by the accuracy of the area reproduction.
The considered raster elements that are shaped like a chessboard can be regarded as a special case of frequency-modulated (FM) screening for the relative coverage area of 50%. Under these conditions, we conclude that the absolute error of a segment with 50% coverage was formed based on the algorithm of PWM -screening makes 16 dua , relative error is 50%, and reduced error - 25%. Hence, one of the main causes of loss of gradations of lights and shadows of raster images obtained based on PWM-screening, is a big error by the raster rendition area [11].
On the basis of the above there are reasons to believe that there is uncertainty of PWM-screening method, which, in our opinion outweighs other reasons: imperfect technologies and equipment, materials, dot gain. However, the study on the impact of these causes on the accuracy of areas reproduction is not the task of our research.
References Determination of reproduction accuracy of dot area of irregular structure
- Damera-Venkata Niranjan, Brian L. Evans, ,(2001), FM halftoning via block error diffusion, International Conference On Image Processing ,volume 3.
- Valdec D.1 , Vusić D.2 , Tomiša M.3, “XM SCREENING TECHNOLOGY” ”, [Online]. Available: https://bib.irb.hr/datoteka/317114.XM_SCREENING_TECHNOLOGY.pdf.
- Logoyda M. Simulation process of discrete formation of square raster element of non-regular structure [J]. Technological Complexes, 2015, 1 (11): 36 – 43.
- Peter G. Martin “Pre-press and color in Gimp”, [Online]. Available: http://www.fifi.org/doc/gimp-manual/html/Prepress.html.
- AM-FM-Hybrid-Screening [Online]. Available: https://wftprintpm.wikispaces.com/AM-FM-Hybrid-Screening.
- XM (Cross Modulated) Screening Technology [Online]. Available: https://agfagraphics.com/gs/usa/en/binaries/wp_xm_screening_technology_en_tcm639-37129.pdf.
- Lutskiv M, Logoyda M, Dzhuguryan T. O określeniu liniatury rastra i liczby poziomów szarości [J]. Świat druku, 2015, 4: 74 – 76.
- Gordon Pritchard, “Hybrid AM Screening/XM Screening” Online]. Available: https://www.flexoglobal.com /flexomag/09-May/flexomag-Pritchard.htm.
- Krishna Gopal Dhal, Iqbal Quraishi, Sanjoy Das, “A Chaotic Lévy flight Approach in Bat and Firefly Algorithm for Gray level image Enhancement, International Journal of Image, Graphics and Signal Processing, vol. 7, pp. 69-76, 2015.
- Logoyda M. The accuracy of the area reproduction of square dots in the discrete formation [J]. Scientific papers, 2015, 1 (50): 37 – 44.
- Lutskiv M, Logoyda M, Synthesis of the discrete raster conversion for irregular frames square elements [J]. Scientific papers, 2015, 2 (51): 49 – 57.
