Developing ontology approach using software tool to improve data visualization (case study: computer network)
")
Author: Mahmoud Moshref, Rizik Al-Sayyad
Journal: International Journal of Modern Education and Computer Science @ijmecs
Article in issue: 4 vol.11, 2019.
Free access
The Information Technology system use visualization to represent data in different forms. Some new researches in this field working on extract Knowledge, rapid information retrieval from the graphical diagram. Therefore, data visualization now trends to use ontology approach to build a robust knowledge-based system. The proposed of this paper is to developed ontology approach and use software tools to improve visualized knowledge. Moreover, study data visualization subject in term of ontology and how to facilitate understanding it on the end user. Computer networks ontology adopted as a case study to prove the important of this approach. The Object Role Modeling (ORM) is a visualized notation used to build the prototype for ontology, and OntoGraf module in the Protégé tool used to build ontology.
Data Visualization, Ontology, Visual representations, Ontology visualization, Semantic network visualization
Short address: https://sciup.org/15016843
IDR: 15016843 | DOI: 10.5815/ijmecs.2019.04.04
Text of the scientific article Developing ontology approach using software tool to improve data visualization (case study: computer network)
Published Online April 2019 in MECS DOI: 10.5815/ijmecs.2019.04.04
Visualizing data become an important issue in our day. Information systems represent data in different visualization Techniques. Human Computer Interaction (HCI) is strongly correlated to visualization as it makes things easy to use and understand/interpret [1].
Visualization is a central component of revelation, comprehension, and communication in science [2]. Because studies have proved that, the expression of data in the visualized system greatly relaxes the human without any impediments. In cognitive systems, data visualization has an important role it is crucial and expanding although it a small part from this system [3].
Data visualization involves presenting data in graphical or pictorial form, which makes the information easy to understand. It helps to explain facts and determine courses of action, it is concerned with the design, development, and application of computer generated graphical representation of the data [4].
The traditional methods for data visualization and analysis insufficient, complex and inefficient. Because currently, the quantity of available data is growing in a continuous and considerable manner, millions (or even billions) of data elements accumulates [5]. Therefore, we need Modern methods to represent data and extract knowledge from it.
There are new methods of graphical presentation that can used to visualize knowledge. As users, require easy access and rapid retrieval of not only information, but also knowledge stored by the system. The new trends in visualization go to exploration of the ontological approach to knowledge representation [6].
Ontology considered as the backbone of the Semantic Web. It represents information more meaningfully, for humans and computers alike [7].
Visualization of ontologies needed for showing their content and relations between their elements. A successfully generated visual representation of an ontology allows to reduce time spent working with the ontology [12].
Object Role Modeling (ORM) mapped Ontology Web Language (OWL 2 DL). This mapping allows one to graphically develop his/her ontology [21].
In this research paper, the trend tends to develop an approach based in using ontology and Protégé tools to improve data visualization to approximate information Understanding to human perception (end user) and extract Knowledge from this visualized data. As case study computer network ontology implemented in Protégé tools using OntoG raf.
-
II. Related Work
Many researches are published in data visualization using semantic network or depending on Ontological knowledge representation, Helena Dudycz in [6] present selected aspects of the practical application of semantic network visualization in support of decision-making processes in the narrow context of financial indicators analysis, and in the light of both the rational and the behavioral approach.
Nadia Catenazzi et al., in [8] propose solutions to the issue of ontology visualization, by presenting intuitive and user-friendly ontology editing and visualization environments. It starts describes the Semantic DB system and the OWL easy Viz ontology editor. It benefits both for the ontology developer team, who necessarily involves domain experts, and for any user who has to create resources based on the ontology.
Steffen Lohmanna et al., in [9] present VOWL in detail and describe its implementation in two different tools: Protégé VOWL and Web VOWL. The first is a plug in for the ontology editor Protégé, the second a standalone web application. Both tools demonstrate the applicability of VOWL by means of various ontologies.
Ameen Shaheen et al., in [2] create a visual analysis dynamic tree for the hardware components of a computer system by creating a number of concepts that represent the knowledge of this domain in a dynamic way in order to reduce the size of the layout data visualization. Other aims at supporting the sharing and the reusing of the represented knowledge on other related problems.
Sean M. Falconer et al., in [10] extend COGZ tool to translate ontology mappings into software model transformation rules. Then a visualization of the domain instance data generated. These extensions involved combining techniques from both software modeling and ontology modeling.
Stamatia Dasiopoulou et al., [11] present preliminary results on a framework for the representation and visualization of text as OWL ontologies under an opendomain paradigm, the approach demonstrated on a use case from the patent domain.
R. Sivakumar et al., [19] present a study on application of Protégé Class browser, Protégé OntoViz, OntoSphere, and Protégé TGVizTab visualization methods in the development of different kinds of protégé visualization tools and categorize their characteristics and features so that it assists in method selection and promotes further future research in the area of ontology visualization.
Several visualization tools can used to represent data depending on Ontology development. It can classify according to the target user, into two categories: “Ontology visualization tools for only ontology experts” and “Ontology visualization tools for everyone” [14]. These tools such as Protégé class browser, OWL Viz, GrOWL, SOVA, ProtégéVOWL, and OntoGraf.
Visualization tools can also provide users an opportunity to create and edit ontologies. On the other hand, the growing number and size of ontologies requires sophisticated visualization techniques that are capable to handle algorithmic, perceptual, and visual scalability problems [12].
In these research we use OntoGraf as visualization tool, it implements Classes as labeled rectangles with a small brown circle, and instances as labeled rectangles with a purple diamond, the development platform built in java, and ontology built in Ontology Web Language OWL [14].
-
IV. The Proposed Ontology Approach
For The term, ontology has utilized for various years by artificial intelligence and knowledge representation group [2]. Ontology is a domain model or conceptual Model that used to share knowledge for People.
Ontologies are conceptual models that make the knowledge of a particular domain of interest available to computer systems. As such, they build on the notions of knowledge representation such semantic networks, rules and logic [13].
Some experts on ontology build it on Object Role Modeling (ORM) [15]. ORM is a fact-oriented modeling approach for specifying, transforming, and querying information at a conceptual level [16].
Then they map this graphical notation to Description logic (DL), from DL they built Resource Description Framework (RDF), and OWL. This approach will lead us to get robust and coherent ontology.
The proposed approach represents how data visualization can depend on ontology to refer concepts to user's perception as shown in fig.1.
ORM DL
III. Data Visualization Tools
According to huge amount of data that spread in web data visualization became very important to makes the information easy to understand for end users. Several visualization techniques can used to visualize data such as line graph, bar chart, scatter plot, pie chart …etc.
Users differ in their ability to use data visualization and make decisions under tight time constraints. It is hard to quantify the merit of a data visualization technique [4]. Therefore, this imposes on us to use other visualization techniques, which are more dynamic and effective. Semantic network data visualization or ontology consider as an efficient technique.
Ontology (Concepts, Relations, Individuals)
Ontology Graph (Visualization)
Fig.1. The Structure of the Proposed Approach
ORM used to illustrate the concepts and relations between it. Formulate it to logic notation Using DL. Then built Ontology using Protégé tool [17] to achieve ontology visual graph. DL related to ontology in two ways because we use it to build ontology, and after we built ontology, we use it to create quires about concepts and individuals in the ontology.
-
V. Ontology Domain: Computer Network as Case Study
The ontology, approach development process is to identify the key concepts and then the relation between the concepts and finally classify the concepts based on their properties [18]. In computer network ontology we use 1 main Classes, 8 Sub Classes Of, 67 Individuals, and 17 properties, 16 Object Property, and 1 Data Type Property.
The computer network ontology as a case study have Computer_Network Super class with sub classes Network_Data class, Network_Hardware class, Network_Layer_Function class, Network_layer , OSI_Model class, Network_Protocal class, Network_Topology class, and
Network_Operating_System class.
-
A. RM and DL in SHOIN
The Methodology that followed in this research to visualize computer network depend in approach in fig.1.
The first step, ORM Model used to visualize data and illustrate the relations between classes, fig.2. Shows this classes and the relation between it in both directions.
The next step represents the DL to map this ORM graph to logic, which will help to build ontology, it will give a conceptual dimension to ontology, and it will use to do quires and extract data from ontology. So after presents the ORM semantics in details. Every construct in ORM discussed and mapped into SHOIN description logic [20].
Subtypes: depicted as an arrow ( → ) in ORM [21]. So from fig.2.
OSI_Model ⊑ Computer_Network,
Network_ Opreting_ System ⊑ Computer_Network, Therefore, for all sub classes.
Usual Relations: This relation without any constrains such as:
OSI_Model ⊑ ∃ Has Data as. Network_Data,
Network_Oprating_System ⊑ ∃ Has Topology as. Network_Topology.
Total and Exclusive Constraints: Disjunctive
Mandatory (inclusive-or), is depicted as (⨀) between two or more roles, illustrating that the disjunction of these roles is mandatory for members [21].
As an example, SROIQ description logic:
Network_Data ⊑ ∃ Has Form in.OsI_Model ⊔ ∃ Has Form in. Network_Hardware.
It means that individuals in Network_Data class must Has Form in at least OSI_Model or Network_Hardware or both.
-
B. Ontology Using Protégé Tool
After representing ontology using ORM Tool and SHOIN DL, Protégé tool used to build ontology and visualize data depending on OntoGraf, figure 3 shows main class, subclasses, and some individuals for OSI_Model class with object properties that related to Application-Layer individual.
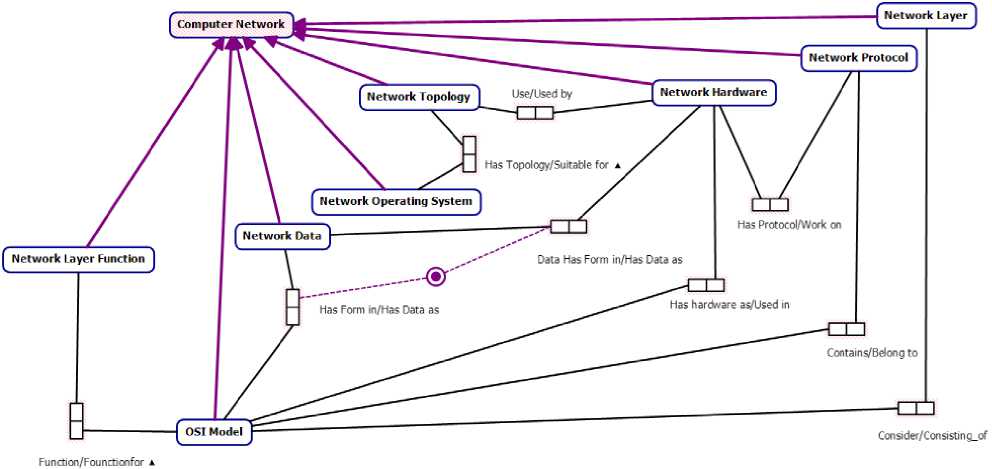
Fig.2. isualizing Computer Network Using ORM
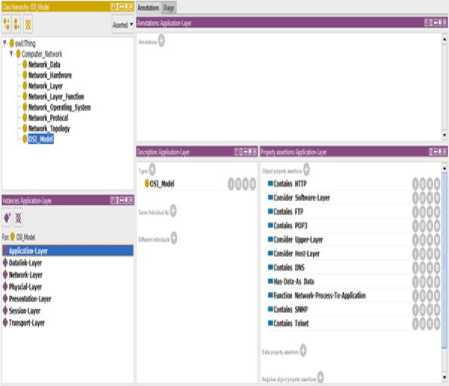
Fig.3. Ontology Main Class, Subclass, and Individual
Fig.4. shows how this ontology are visualize using OntoGraf, it represent Main class, subclasses and the relationships (Object Properties) between these classes.
The Main difference between this work and other works that this work not only aims to visualize data but also it construct a semantic relation between concepts, so user can find how this concepts or classes related to each other.
As an example figure5, shows OSI_Model class, and Object properties as present in figure, OSI_ Model is sub class from Computer_Network , table 1. Represents object properties that related to OSI_Model class, domain, range, and the inverse object properties that associated with it, and illustrate the relations between OSI_Model and It is individual.
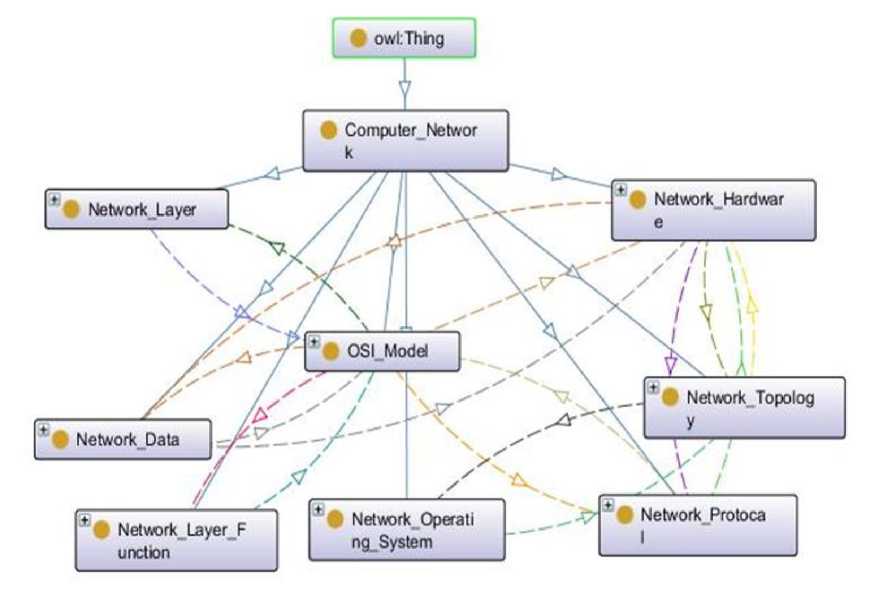
Fig.4. Ontology Classes in Protégé
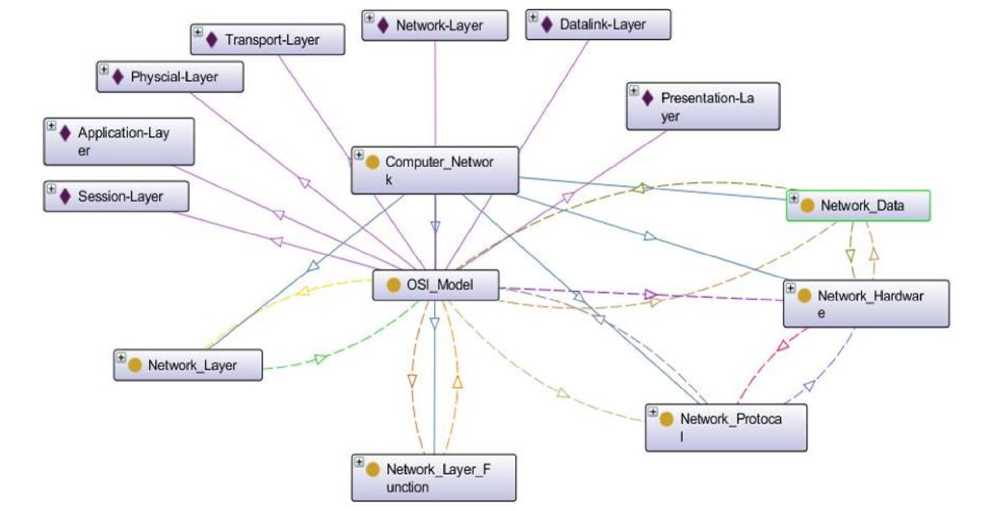
Fig. 5. Visualization for ISO_Model Class
The Classes implemented as rectangles with a small brown circle, and instances implemented as rectangles with a purple diamond.
The object properties and the inverse properties in table 1, illustrated in figure 5 by arrow, as an example the properties that linked OSI_Model class with Network_Layer class, Consider relation have an yellow color, the inverse relation Consisting-Of have an green color.
The OntoGraf give each object property color different from others. However, it give blue color for all subclasses relation. In other hand, the relation between each class and it is individuals have purple color.
The basic elements used to represent knowledge in the description logic formalism are concepts, individuals, and roles. Intuitively, concepts denote classes of things, such as OSI_Model or Network_layer . Individuals denote instances, such as Physical-Layer or Application-Layer. Roles denote relationships between things, such as contains [22].
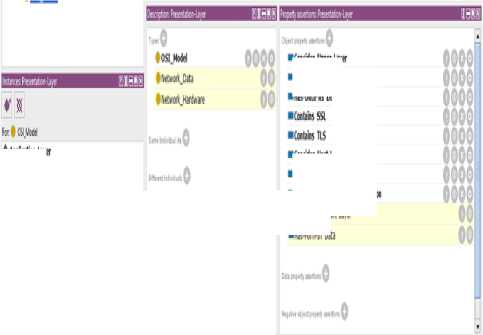
After building the ontology, the reasoning process was start using Pellet Reasoner to extract properties that do not created as in fig.6. Therefore, we can extract complete knowledge.
As an example Presentation layer individual (instance), represent other properties assertions that do not implemented such as ( Consider Software-Layer ), ( Has-Form-In Data ), and represent descriptions such as ( Network_Data ), and ( Network_Hardware ).
As ontology built in the notation of Knowledge Representation (KR), and it will give a conceptual model that make a domain of interest available to computer system.
Table 1. Osi_Model Class and Object Properties
|
N o. |
Object Property |
Domain |
Range |
Inverse of |
|
1. |
Contains |
OSI_Model |
Network_Protocal |
Belong_To |
|
2. |
Has-Hardwar e-As |
OSI_Model |
Network_Hardware |
Use-in |
|
3. |
Function |
OSI_Model |
Network_Layer_Fu nction |
Function-For |
|
4. |
Consider |
OSI_Model |
Network_Layer |
Consisting-Of |
|
5. |
Has-Data-As |
OSI_Model |
Network_Data |
Has-Form-In |
|
Individual Properties |
||||
|
1. |
Has individua l |
OSI_Model |
Application-Layer |
_ |
|
2. |
Has individua l |
OSI_Model |
Presentation-Layer |
_ |
|
3. |
Has individua l |
OSI_Model |
Session-Layer |
_ |
|
4. |
Has individua l |
OSI_Model |
Transport-Layer |
_ |
|
5. |
Has individua l |
OSI_Model |
Network-Layer |
_ |
|
6. |
Has individua l |
OSI_Model |
Datalink-Layer |
_ |
|
7. |
Has individua l |
OSI_Model |
Physical-Layer |
_ |
Which means any missing properties or descriptions will represented after reasoning process used. This will make ontology soundness, without any wrong conclusions, and completeness, without any missing conclusion. This will derived all entailed statements from the Knowledge Base (KB).
Depending on the proposed approach, the final step is creating Queries to extract information from ontology using description logic (DL) querying language in fig.7. Fig.8. and fig.9. Respectively represent some of these quires.
Pwltilifef
♦ ScHionliycr IlniiN'lwr
♦ Appliulion-layn ♦WLiw |MnH|K ywKw
Fig.6. Knowledge Extracted after Reasoning
■ion* Upprr-layrr
■Fuodkn DjljReprahta
■HatDiti'te Data
i(ons№f Host Ljyer
-
■ teion SynCh-And-SAkd-ToPtirt
-
■ I* tn(^igiiXWi«
-
■ Сел* 5^ift tiro
■Has-Fwro-ln Data
If the question come as: What are the OSI Model layers that has data as "Data"?
The DL Query: OSI_Model and Has-Data-As Value Network_Data
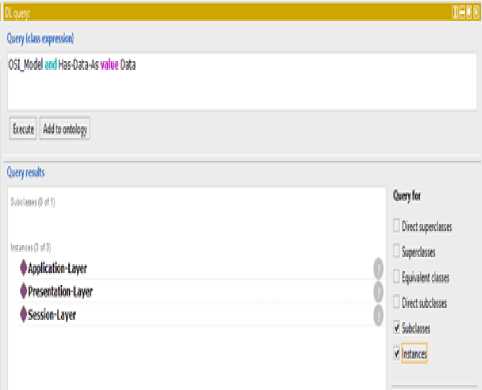
Fig.7. Results of DL Query to Retrieve OSI Layer has Data as "Data"
See the result come as Application layer, Presentation layer, and Session layer. This result represent the instances of network OSI Model layers that has represent data as "Data". This will represent visual data as semantic data.
If the question come as: What are the network protocols that belong to network layer?
The DL Query: Network_Protocol and Belong-To Value Network_Layer.
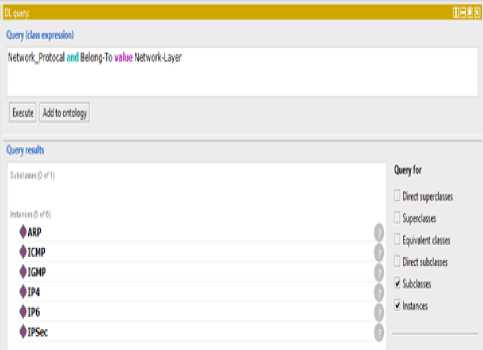
Fig.8. Results of DL Query to Retrieve Protocols belong to Network Layer
The figure show there are several protocols that belong to network layer such as ARP, ICMP, IGMP, IPv4, IPv6, and IPSec… etc.
If the question come as: What are the network topologies that suitable to peer-to-peer architecture?
The DL Query: Network_Toplogy and Suitable-For Value Peer-To-Peer
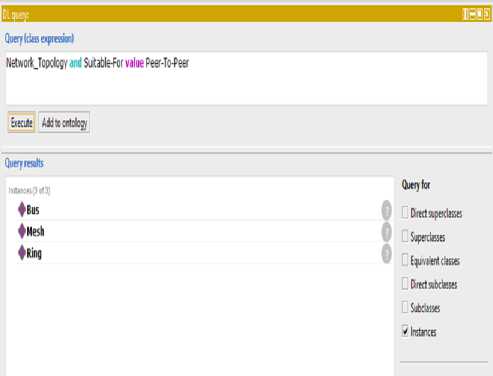
Fig.9. Results of DL Query to Retrieve Network Topologies that Suitable to Peer-to-Peer Architecture
The figure represent that Bus, Mesh, Ring topologies suitable to work with peer-to-peer architecture.
Using visualization to representing knowledge and extracting information from ontology consider the most important goal for the proposed approach, so after build ontology for computer network as case study, depending on ORM and DL the implementation process developed.
As shown this work implement ontology using Protégé tool, and visualize it using OntoGraf, then use Pellet Reasoner to extract roles that are not implement, and finally we use DL queries to extract information from ontology.
-
VI. Conclusion
As data visualization and ontology become more important and related, to visualize data in semantic Manner, this research paper aimed to developed ontology approach and use software tools to improve visualized knowledge.
So end user can use this visualized ontology and construct queries, to extract information by building queries using DL, or other querying system.
In Ontology representation the reasoning process will done to get other roles from the knowledge base that created. Computer network used as a case study and after creating ontology, ORM notations used as a fact-oriented modeling approach to represent the first prototype to visualized network system ontology then OntoGraf in Protégé used to visualized this system.
This ontology representing classes, and object properties, the result represents that using ontology and description logic (DL) as Knowledge representation formalism. It represents a powerful methodology to visualize data and well defined methodology to visualize data beside display it in semantic and full meaning data.
Acknowledgment
The authors thank god to help us to finish this research, and thank to the University of Jordan, Computer Science Department, and Information Technology Department.
References Developing ontology approach using software tool to improve data visualization (case study: computer network)
- Matthew Ward, Georges Grinstein, Daniel Keim, " Interactive Data Visualization Foundations, Techniques, and Applications", Taylor & Francis Group 6000 Broken Sound Parkway NW, Suite 300 Boca Raton, FL 33487-2742 © 2015 by Taylor & Francis Group, LLC.
- Ameen Shaheen, Rizik Al-Sayyed, Azzam Sleit," Improving visual analyses and communications of ontology by dynamic tree (case study: computer system)", International Journal of Advanced and Applied Sciences, 4(5) 2017, Pages: 62-66.
- Colin Ware," INFORMATION VISUALIZATION Perception for Design", Morgan Kaufmann Publishers is an imprint of Elsevier. 500 Sansome Street, Suite 400, San Francisco, CA 94111, 2004.
- Matthew N. O. Sadiku, Adebowale E. Shadare, Sarhan M. Musa, and Cajetan M. Akujuobi, " DATA VISUALIZATION", International Journal of Engineering Research And Advanced Technology(IJERAT), ISSN: 2454-6135, [Volume. 02 Issue.12, December– 2016]
- Dulclerci Sternadt Alexandre, João Manuel R. S. Tavares," Introduction of Human Perception in Visualization", 2007
- Helena Dudycz," Application of semantic network visualization as a managerial support instrument in financial analyses", Online Journal of Applied Knowledge Management A Publication of the International Institute for Applied Knowledge Management, Volume 5, Issue 1, 2017.
- Mohammad Mustafa Taye," Understanding Semantic Web and Ontologies: Theory and Applications", Journal of Computing, Volume 2, Issue 6, June 2010, ISSN 2151-9617.
- Nadia Catenazzi, Lorenzo Sommaruga, Riccardo Mazza, " User-friendly ontology editing and visualization tools: the OWLeasyViz approach", 2009 13th International Conference Information Visualisation.
- Steffen Lohmanna, Stefan Negrub, Florian Haag, Thomas Ertl, "Visualizing Ontologies with VOWL", 1570-0844/0-1900, IOS Press, 2016.
- Sean M. Falconer, R. Ian Bull, Lars Grammel, Margaret-Anne Storey, "Creating visualizations through ontology mapping", University of Victoria, 2009.
- Stamatia Dasiopoulou, Steffen Lohmann, Joan Codina, and Leo Wanner, " Representing and Visualizing Text as Ontologies: A Case from the Patent Domain", EU FP7-SME-606163 project iPatDoc, 2015.
- Sergei Mikhailov, Mikhail Petrov, and Birger Lantow," Ontology Visualization: a Systematic Literature Analysis", Government of the Russian Federation, Grant 074-U01, 2016.
- Stephan Grimm, "Knowledge Representation and Ontologies", M.M. Gaber (ed.), Scientific Data Mining and Knowledge Discovery: Principles and Foundations, DOI 10.1007/978-3-642-02788-8 6, © Springer-Verlag Berlin Heidelberg 2010.
- Fatma Ghorbel, Nebrasse Ellouze, Elisabeth Métais, Fayçal Hamdi, Faiez Gargouri, Noura Herradi, " MEMO GRAPH: An Ontology Visualization Tool for Everyone", ELSEVIER, 20th International Conference on Knowledge Based and Intelligent Information and Engineering Systems, Procedia Computer Science 96 ( 2016 ) 265 – 274.
- https://www.ormfoundation.org/files/folders/norma_the_software/entry3849.aspx
- Terry Halpin , "Logical Data Modeling (Part 8)", Business Rules Journal Vol. 17, No. 11, Nov. 2016) URL: http://www.brcommunity.com/a2016/b883.html).
- https://protege.stanford.edu.
- SAKTHI MURUGAN. R , P. SHANTHI BALA, AND DR. G. AGHILA, " AN ONTOLOGY FOR EXPLORING KNOWLEDGE IN COMPUTER NETWORKS", International Journal on Computational Sciences & Applications (IJCSA) Vol.3, No.4, August 2013.
- R. Sivakumar, and P.V. Arivoli, "ONTOLOGY VISUALIZATION PROTÉGÉ TOOLS –A REVIEW", International Journal of Advanced Information Technology (IJAIT) Vol. 1, No. 4, August 2011.
- Mustafa Jarrar: Mapping ORM into the SHOIN/OWL Description Logic- Towards a Methodological and Expressive Graphical Notation for Ontology Engineering . In OTM 2007 workshops: Proceedings of the International Workshop on Object-Role Modeling (ORM'07). Pages (729-741), LNCS 4805, Springer. ISBN: 9783540768890. Portogal. November, 2007.
- Rami Hodrob, Mustafa Jarrar: ORM to OWL 2 DL Mapping.. In proceedings of the International Conference on Intelligent Semantic Web – Applications and Services. Pages 131-137. ACM ISBN 9781450304757. June 2010.
- Stephan Grimm, "Knowledge Representation and Ontologies", M.M. Gaber (ed.), Scientific Data Mining and Knowledge Discovery: Principles and Foundations, DOI 10.1007/978-3-642-02788-8 6, © Springer-Verlag Berlin Heidelberg 2010.
