Developing territorial differentiation processes of agricultural production in the Non-Black Earth region and their current trends

Author: Kostyaev Aleksandr I., Nikonova Galina N.
Journal: Economic and Social Changes: Facts, Trends, Forecast @volnc-esc-en
Section: Environmental economics
Article in issue: 4 т.14, 2021.
Free access
In the Russian Non-Black Earth Region, an unacceptable contrast remains between the level of socio-economic development of cities and the presence of “desolation zones” in rural areas. In turn, rural areas of the regions are excessively differentiated and polarized. In some areas, innovative agricultural production is developing, and the number of rural residents is growing, in others, commodity production is declining, depopulation is increasing, and social desertification and space compression are taking place there. Socio-economic phenomena in rural areas depend on the directions and rates of dynamics of agricultural production. Hence, the main idea, presented in the article, is the consideration of differentiation process of agricultural production as the primary basis for the heterogeneity formation of rural areas. The purpose of the study is to identify the level and features of the formation of territorial differentiation of agricultural production in the Non-Black Earth Region during the planned (1974-1990) and market (1991-2019) economies, and to determine ways to reduce its excessive redundancy. At the same time, the authors analyze territorial differentiation from two sides: as a process and as a result of this process. Methodologically, the paper considers the development heterogeneity from the standpoint of the “center - periphery” concept and differential rent theory. The work uses the method of multicriteria stratification of the final rank scales. The ranking is carried out according to the Board rule, the countries are determined on ordinal scales using tertiles, quartiles, and quintiles. The article calculates the coefficients of Gini and funds. As a result, the authors have determined a sharp increase in interregional differentiation and polarization in the production of agricultural goods in 1991-2019. According to the dynamics of agricultural production in 1974-1990, there have been identified five types of regions, the rating positions of which have been transformed in six directions in the subsequent period. In conclusion, the authors have determined the aggregate level of interregional differentiation. The study identifies three groups and nine subgroups of regions, and defines the differences between them. The paper establishes current trends of the differentiation process in the production of agricultural goods, and proposes ways to reduce excessive differentiation and polarization of the regions.
Heterogeneity, rural areas, region, type, group, area, growth rates, program
Short address: https://sciup.org/147235422
IDR: 147235422 | UDC: 332.142.2 | DOI: 10.15838/esc.2021.4.76.9
Text of the scientific article Developing territorial differentiation processes of agricultural production in the Non-Black Earth region and their current trends
Russia’s Non-Black Earth Region is a vast territory with an area covering 2,411.2 thousand km2 north of the Central Black Earth Region up to the coast of the Arctic Ocean and from the Baltic Sea in the west to the Ural Mountains in the east. In 1974–1990, the Region was implementing a large-scale comprehensive program for the development of agriculture (hereinafter referred to as the Program)1; this resulted in the formation of the production potential and significant economic and social development in the rural areas.
With the transition to a market economy, the production potential in Russia’s Non-Black Earth Region was affected to a much greater extent than in the rest of Russia. Territorial differentiation increased, which has led to the polarization of agricultural production and rural territories there. Along with the areas where agricultural production is developing intensively and the number of rural residents is increasing, Russia’s Non-Black Earth Region has rural territories with depopulation and general depression. Academician A.V. Petrikov and other researchers note that peripheral rural territories of the Non-Black Earth Region, and especially its northwestern and central economic regions, are facing social desertification [1; 2]. We agree with T.G. Nefedova, who defines the ongoing processes as “fragmentation of rural space”, “compression of the peripheral rural space”, and highlights “black holes” in the supporting framework of collective agriculture in the Non-Black Earth Region [3; 4]. Other publications [5; 6] also note the “compression of space” phenomenon in the rural Non-Black Earth Region and its border territories. A number of authors distinguish areas and zones of desolation in the rural areas [7]. In the rural NonBlack Earth Region, the number of residents who leave the Region for seasonal work (the so-called otkhodnichestvo – a mass phenomenon, which disappeared more than 100 years ago and is now being revived), is increasing [8].
At the same time, a huge scientific, technological, industrial and human potential of Russia is concentrated in the Non-Black Earth Region. The Region comprises 32 RF constituent entities, it accounts for 42.2% of Russia’s population and about 50% of its GRP. The Non-Black Earth Region largely determines the socio-economic development and defense capability of Russia, being a de facto geostrategic territory in the system of spatial development. The contrast between the socio-economic potential of the Non-Black Earth Region and the fact that its rural territories have “desolation zones” that largely determine the redundancy of territorial heterogeneity – all this requires finding out the reasons for interregional differences and distinguishing the types of regions formed in the process of differentiation.
Hence, the goals of our present study are to identify the level and features of territorial differentiation of agricultural production in the Non-Black Earth Region under the planned (1974– 1990) and market (1991–2019) economies, and to determine ways to reduce its excessive redundancy.
Research objectives:
– to give a general assessment of trends in the process of changing the extent of heterogeneity of rural areas in the production of agricultural products;
– to study the process of regions’ differentiation using data on the increase in agricultural production during the implementation of the Program and after 1990, to establish the types of dynamics and structural shifts;
– to determine the total level of differentiation (as a process and result) of agricultural production in the regions, formed by 2015–2019;
– to identify modern trends in the process of differentiation of rural territories of regions in agricultural production;
– to substantiate ways to reduce excessive differentiation and polarization in the rural territories.
Theoretical aspects of the study
The agricultural sector in the Non-Black Earth Region is a priori heterogeneous due to zonal contrasts in the spatial distribution of agro-climatic and soil resources that make up the natural basis of production. Along with zoning, the process of differentiation of agricultural production is significantly influenced by azonal factors, primarily the presence of large cities and urban agglomerations, which are markets for agricultural products and centers of concentration of resources and services for the village. The dominance of centripetal forces in the “center–periphery” agglomeration process leads to the formation of inequality in the development of agricultural production and rural areas, primarily between the near, middle and far periphery. This phenomenon has been considered for quite a long time: J. Friedman – 1966 [9]; O.V. Gritsai, G.A. Ioffe, A.I. Treivish – 1991 [10]. According to the followers of J. Friedman, the driving force behind the reproduction of the “center–periphery” relationship system is the “continuing qualitative transformation of the core due to the production, introduction and diffusion of innovations”, which should then spread toward the periphery, providing it with an impetus for development [10, p. 15].
In Russian conditions, such a mechanism manifests itself unilaterally – mainly in the migration of the rural population and labor resources from peripheral areas to cities (centers) and to the near periphery, where investments are concen-trated [11, p. 226]. In turn, the feedback – the spread of innovations from the center to the periphery – is extremely weak, with all the ensuing consequences for the development of rural areas.
Unlike other researchers, we consider the theoretical structure “center – periphery” as a special case of the theory of differential rent. Zonal and azonal factors together determine territorial heterogeneity in the costs of agricultural production, and through it – the amount of differential income per unit of land. Under a planned economy, investments were distributed centrally and relatively evenly among rural territories of the regions. In market conditions, as a rule, investments are concentrated where the greatest income can be obtained from investments in agricultural production. In this case, the impact of market forces increases territorial heterogeneity. The state, in one way or another (programs, subsidies, subventions, etc.), influencing the development of agricultural production, levels off or strengthens the territorial heterogeneity predetermined by objective factors.
With this in mind, we understand territorial differentiation in two senses: 1) as a process that contributes to the division of socio-economic space into rural territories that are heterogeneous in a comparable set of characteristics; 2) as a result of this process, expressed in the heterogeneity of rural territories. In the second sense, the terms “territorial differentiation” and “territorial heterogeneity” are used as synonyms.
In the first case, the attributes of territorial differentiation are groups, types and classes of regions that are internally relatively homogeneous in terms of the growth rate of agricultural production, and in the second case – in terms of the current level of agricultural production.
Materials and methods
The methods for studying territorial heterogeneity are universal and are used for various socioeconomic phenomena and processes. These are methods of multidimensional and variational statistics, multidimensional scaling, ranking, and methods for assessing the differentiation of people’s income (Gini index, the ratio of the average income of the richest 10% to the poorest 10% (R/P 10% ratio), the Lorentz curve).
Multidimensional statistics methods (factor and cluster analysis) look attractive, but, along with positive results [12], they can produce abstract conclusions, which are quite difficult to interpret. Thus, in the typology of territories within the NonBlack Earth Region, the Leningrad Oblast with a highly developed agricultural sector was included in the same cluster as the Kostroma, Smolensk, Pskov oblasts and a number of other regions that have signs of depression [13].
The unevenness of the distribution of a particular phenomenon across territorial units is most often studied using indicators of variation (the scope of variation, the average linear and mean square deviation, variance and coefficient of variation) [14–18]. The differentiation of the EU member states by the level of socio-economic development was determined using the methods of variational statistics, the construction of a general synthetic indicator on their basis, and subsequent ranking [19].
Ranking methods (the k-means algorithm and its modifications; ranking by influence, according to the Borda count; Pareto partitioning, etc.) have become quite widespread [20; 21]. At the same time, B.G. Mirkin and M.A. Orlov approach the solution to the problem under consideration from the position of multicriteria stratification, when one conducts both ranking and partitioning simultaneously and defines a “vertical” hierarchical structure – ranking, and a “horizontal” hierarchical structure – layers of more or less homogeneous objects” [21].
E.S. Gubanova and V.S. Kleshch, when comparing the techniques for assessing territorial heterogeneity, have come to the conclusion that there is no technique that would have obvious advantages [18, p. 32]. Among the advantages of the methods identified by these authors, for our case, the most important are the following: “determining the territory relative to other territories”, “visibility and ease of interpretation of the results” and the minimum “level of complexity of calculations”. It is noted that the quality of the study can be improved with the help of two different methods.
In connection with the above, we used the multicriteria stratification technique as the basis [21] and checked whether we could use the following two methods at the ranking stage :
-
1. Ranking according to the Borda count [20], where for each object x. the ranks T j (xt) are set for all the indices j , and the final rank r for the object xi is determined by the sum of individual ranks:
-
2. Ranking by an integral indicator determined on the basis of the index X " that takes into account variational characteristics of the objects [16]:
r(xt)= E^r j (X i ) . (1)
X " = 1^2 , X "e [0;1] , (2)
Л where X" is the private rating of the region r in terms of i, Xrt = _——_, ^ G ^ 1].
’ i ^ max - д-min, i
-
x f is the value of the i -th indicator in the region r ;
Xmax , xmin are the maximum and minimum values of the i -th indicator in the considered set of regions in the corresponding period;
n is the number of regions [16, pp. 115–116].
In the course of verification, we have revealed that the results of both techniques are close to each other. There is a high and very high correlation between the indicators of the final rank scales obtained by using these techniques. The following Spearman’s correlation coefficients were obtained:
-
a) according to the growth rates of average annual agricultural production during the period when the Program was implemented (0.72), in 1991–2019 (0.83);
-
b) according to the average annual volumes of agricultural production in 1971–1975 and 1986– 1990 (1.0), 2015–2019 (0.94);
-
c) according to the average annual volumes of agricultural production per 100 hectares of farmland for all periods (0.99).
Having considered the results we obtained after comparing the techniques, and taking into account such advantages of ranking as “the minimum level of complexity of calculations” and “visibility and ease of interpretation of the results”, we chose to use the method according to the Borda count as the basis for our study.
At the stratification stage, the horizontal strata of regions were distinguished on the final rank scales, depending on the tasks being solved by dividing them by tertiles (Q1 , Q2) into three equal parts, by quartiles (Q1 , Q2 , Q3 ) into four equal parts, by quintiles (Q1 , Q2, Q3, Q4 ) into five equal parts. The obtained strata were analyzed, while special attention was paid to the composition of the regions in the upper and lower strata, which are characterized by the greatest deviation from the average values.
In the study of territorial differentiation as a process, the indicators were the growth rates of production of the main types of agricultural products separately for the period of implementation of the Program (1974–1990) and the period of a market economy (1991–2019).
Territorial heterogeneity in statics was determined by the volume of production of the main types of agricultural products in natural terms and calculated per 100 hectares of farmland (arable land) at the end of these periods. To exclude the influence of random (weather, epizootic, etc.) factors, the growth rates were determined based on the average annual data for the final five years (1986–1990) relative to the period preceding the start of the active implementation of the Program (1971–1975) and in 2015–2019 relative to 1986– 1990. The study was conducted using statistical data from the Central Statistical Administration and the State Statistics Committee of the RSFSR, and also the Federal Sate Statistics Service of Russia (Rosstat)2.
Major research findings and their discussion
General assessment of trends in the change of territorial heterogeneity in the volume of agricultural production . The ranking scales of the regions were constructed according to the production volumes of each main type of product in the direction from min to max , then the RF constituent entities were
Table 1. Coefficients of concentration and polarization of agricultural production in the territories of the Non-Black Earth Region, on average for the year
|
K |
Period |
Product |
||||||
|
Grain |
Potatoes |
Vegetable |
Flax fiber |
Milk |
Meat |
Eggs |
||
|
K g |
1971–1975 |
0.374 |
0.318 |
0.445 |
0.713 |
0.262 |
0.269 |
0.356 |
|
1986–1990 |
0.415 |
0.325 |
0.439 |
0.697 |
0.267 |
0.260 |
0.384 |
|
|
2015–2019 |
0.596 |
0.438 |
0.392 |
0.741 |
0.378 |
0.436 |
0.529 |
|
|
K f |
1971–1975 |
18.3 |
8.0 |
12.6 |
33.3 |
4.7 |
5.0 |
6.7 |
|
1986–1990 |
30.3 |
7.6 |
12.3 |
26.2 |
4.8 |
4.4 |
6.8 |
|
|
2015–2019 |
237.4 |
15.9 |
11.6 |
519.5 |
11.6 |
24.7 |
44.1 |
|
Source: Statistics Yearbooks “National Economy of the RSFSR” 1975, 1990; Rosstat.
stratified by the groups of 20%. Trends in changes in the level of heterogeneity were established using the Gini coefficients ( that reflect the territorial concentration of production, and R/P 10% ratios ( Kf ) that show its interregional polarization (Tab. 1).
The results of the calculations allowed us to draw a number of conclusions:
-
– at the stage of implementation of the Program, the level of territorial concentration of production (with the exception of grain and, partly, eggs) increased slightly, and even decreased for vegetables, flax fiber and meat, which was facilitated by the planned distribution of public procurement for products in Russia’s regions;
-
– a significant increase in the territorial concentration of production of all types of products (except vegetables) occurred after 1990, when market mechanisms began to operate in the agricultural sector;
-
– the transition and subsequent stages of development of the market economy has caused polarization of regions in terms of production of all items (except vegetables);
-
– the highest level of concentration of production volumes in regions of the fifth 20% group is noted in the production of flax fiber (85.4% of the total), grain (61.1%) and eggs (58.6%).
The current state of territorial heterogeneity of the agricultural sector in the Non-Black Earth Region was formed mainly after Russia’s transition to a market economy. At the same time, the processes taking place during the implementation of the Program had a significant impact on the formation of the types of regions and structural shifts in the placement of agricultural production.
Differentiation of regions by the rate of growth of agricultural products during the implementation of the Program . When addressing this task, we ranked the territories of the Non-Black Earth Region according to the growth rates from max to min; and for their stratification, we divided the final rank scale by quartiles into the parts of 25%. At the same time, the calculations did not take into account flax fiber, the production of which was localized in a limited number of regions. The group of northern territories (the Murmansk and Arkhangelsk oblasts and Komi ASSR) forming a single area had the highest growth rates (on a scale higher than Q1) (Tab. 2).
This also includes the Moscow, Leningrad and Sverdlovsk oblasts with centers in cities with a million-plus population, as well as the Tula Oblasst, which is directly adjacent to the capital region, and the Kaliningrad Oblast, which occupies a separate position. This group of regions is characterized by the highest growth rates. The second 25% group of regions includes the republics of the Volga Region (Chuvash, Udmurt, Mari and Mordovian ASSR) with increased growth rates, forming a single area. We define the remaining regions of the second 25% group and all regions of the third 25% group as territories with average growth rates of agricultural production volumes.
The most homogeneous was the group of regions on a scale below Q3 with the lowest growth rates for most types of agricultural products and their aggregate as a whole (Tab. 3) .
Table 2. The results of ranking the territories of the Non-Black Earth Region by the growth rate of agricultural production during the period of the Program implementation (from max to min)
|
Territory |
Individual rank for the type of products |
Sum of ranks |
Final rank |
|||||
|
grain |
potatoes |
vegetables |
milk |
meat |
eggs |
|||
|
Murmansk Oblast |
29 |
13 |
1 |
1 |
1 |
1 |
46 |
1 |
|
Komi ASSR |
27 |
6 |
5 |
11 |
2 |
3 |
54 |
2 |
|
Arkhangelsk Oblast |
11 |
7 |
8 |
21 |
6 |
2 |
55 |
3 |
|
Moscow oblast |
21 |
2 |
14 |
4 |
9 |
6 |
56 |
4 |
|
Kaliningrad Oblast |
4 |
1 |
6 |
18 |
20 |
8 |
57 |
5 |
|
Tula Oblast |
3 |
3 |
18 |
15 |
12 |
7 |
58 |
6 |
|
Leningrad Oblast |
25 |
16 |
10 |
2 |
3 |
4 |
60 |
7 |
|
Q1 Sverdlovsk Oblast |
19 |
11 |
7 |
5 |
10 |
9 |
61 |
8 |
|
Chuvash ASSR |
15 |
4 |
9 |
3 |
13 |
18 |
62 |
9 |
|
Udmurt ASSR |
6 |
5 |
12 |
8 |
15 |
17 |
63 |
10 |
|
Mari ASSR |
10 |
8 |
11 |
7 |
11 |
28 |
75 |
11 |
|
Perm Oblast |
16 |
19 |
4 |
19 |
14 |
5 |
77 |
12 |
|
Orel Oblast |
1 |
17 |
2 |
14 |
22 |
25 |
81 |
13 |
|
Mordovian ASSR |
14 |
10 |
3 |
9 |
24 |
22 |
82 |
14 |
|
Q2 Karelian ASSR |
28 |
15 |
15 |
6 |
8 |
11 |
83 |
15 |
|
Kaluga Oblast |
2 |
12 |
16 |
23 |
17 |
14 |
84 |
16 |
|
Vladimir Oblast |
12 |
22 |
24 |
12 |
5 |
10 |
85 |
17 |
|
Bryansk Oblast |
7 |
9 |
17 |
20 |
25 |
12 |
90 |
18 |
|
Ivanovo Oblast |
13 |
24 |
20 |
17 |
4 |
13 |
91 |
19 |
|
Gorky Oblast |
8 |
23 |
21 |
10 |
18 |
15 |
95 |
20 |
|
Ryazan Oblast |
9 |
14 |
13 |
13 |
26 |
21 |
96 |
21 |
|
Q3 Kirov Oblast |
5 |
18 |
22 |
16 |
16 |
23 |
100 |
22 |
|
Vologda Oblast |
20 |
21 |
19 |
22 |
7 |
20 |
109 |
23 |
|
Kostroma Oblast |
17 |
20 |
29 |
24 |
19 |
19 |
128 |
24 |
|
Yaroslavl Oblast |
23 |
26 |
25 |
26 |
23 |
16 |
139 |
25 |
|
Smolensk Oblast |
18 |
27 |
23 |
25 |
28 |
24 |
145 |
26 |
|
Novgorod Oblast |
26 |
25 |
28 |
27 |
21 |
26 |
153 |
27 |
|
Kalinin Oblast |
22 |
28 |
26 |
29 |
27 |
27 |
159 |
28 |
|
Pskov Oblast |
24 |
29 |
27 |
28 |
29 |
29 |
166 |
29 |
Source: Statistics Yearbooks “National Economy of the RSFSR” 1975, 1990.
Table 3. The growth rates of agricultural production during the implementation of the Program in the group of territories within the Non-Black Earth Region with the worst indicators, %
|
Territory |
Product |
||||||
|
Grain |
Flax fiber |
Potatoes |
Vegetables |
Milk |
Meat |
Eggs |
|
|
Vologda Oblast |
-26.5 |
-44.5 |
-40.3 |
-16.9 |
-1.8 |
64.1 |
51.2 |
|
Kostroma Oblast |
-14.6 |
-20.4 |
-36.5 |
-53.6 |
-7.3 |
28.9 |
53.2 |
|
Yaroslavl Oblast |
-32.6 |
-48.6 |
-47.7 |
-35.3 |
-14.4 |
20 |
57.3 |
|
Smolensk Oblast |
-19.7 |
-35.3 |
-48.1 |
-26.6 |
-13.2 |
2.9 |
27.7 |
|
Novgorod Oblast |
-41.9 |
-62.3 |
-47.7 |
-53.2 |
-14.5 |
27.8 |
20.1 |
|
Kalinin Oblast |
-30.7 |
-35.9 |
-48.7 |
-43.2 |
-20.7 |
5 |
14.7 |
|
Pskov Oblast |
-37.3 |
-68.3 |
-55.7 |
-49.9 |
-16.6 |
-5.7 |
-10 |
|
Non-Black Earth Region as a whole |
-0.8 |
-40.2 |
-29.9 |
-13.4 |
7.8 |
36 |
76 |
Source: Statistics Yearbooks “National Economy of the RSFSR” 1975, 1990.
It includes seven regions of the central and north-western territories within the Non-Black Earth Region; they form a continuous strip that encircles the Moscow Oblast from the northeast, north and north-west and then adjoins the Leningrad Oblast from the south and east. The growth rates of agricultural production in these territories were lower than the average for the NonBlack Earth Region; as for the Pskov Oblast, they were negative on all the positions there.
Thus, when assessing structural changes in the Non-Black Earth Region during the implementation of the Program, we consider five types of territories according to the growth rates of agricultural production, based on their place in the final ranking scale (see Tab. 2): Type I – regions with the highest growth rates (three regions); Type II – regions with high growth rates (five regions);
type III – regions with above-average growth rates (4 regions); type IV – regions with average growth rates (10 regions); Type V – regions with the lowest growth rates (7 regions) (Fig. 1) .
Our calculations have shown that the growth rates of agricultural production over the years of the Program implementation for these types of regions are highly differentiated (Fig. 2).
Based on the analysis of the extent of differentiation of regions by the rate of production growth, we determined the structural shifts that occurred during the implementation of the Program. For type I regions, a noticeable positive structural shift was noted in the production of meat and eggs, an insignificant shift – in the production of milk, a zero shift – in the production of grain and a negative shift – in the production of flax fiber (Fig. 3) .
Figure 1. Types of territories within the Non-Black Earth Region according to the growth rates of agricultural products during the implementation of the Program
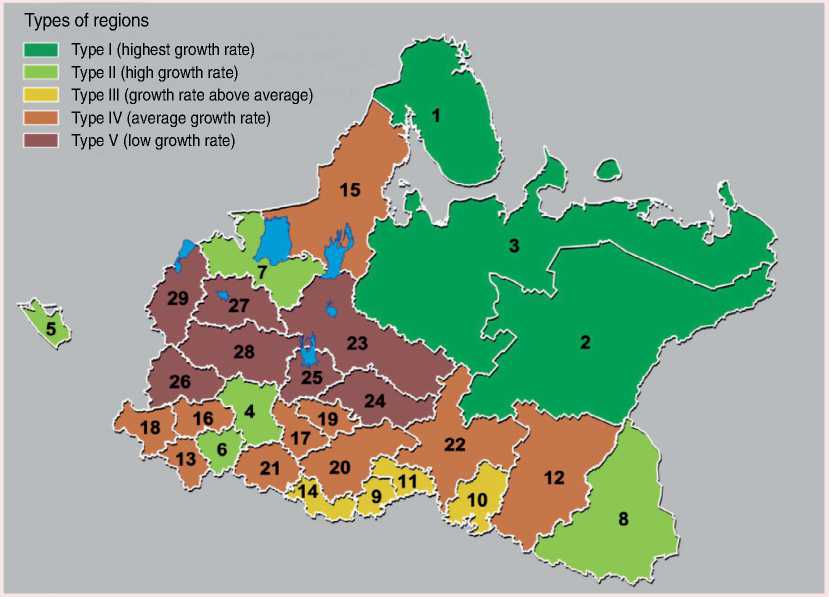
The figures show the place of the territories in the final ranking scale.
Source: data from Tab. 2.
Figure 2. Growth rates of agricultural production volumes by types of territories within the Non-Black Earth Region for the period of the Program implementation, %
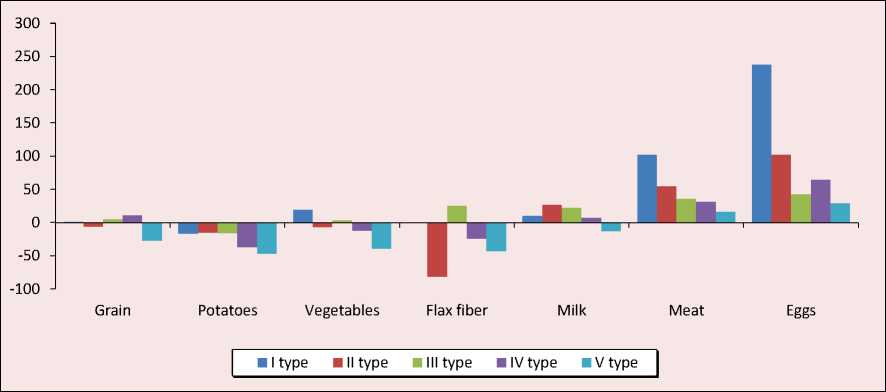
Source: Rosstat.
Figure 3. Structural shifts in the production of agricultural products by types of territories within the Non-Black Earth Region for the period of implementation of the Program, p.p.
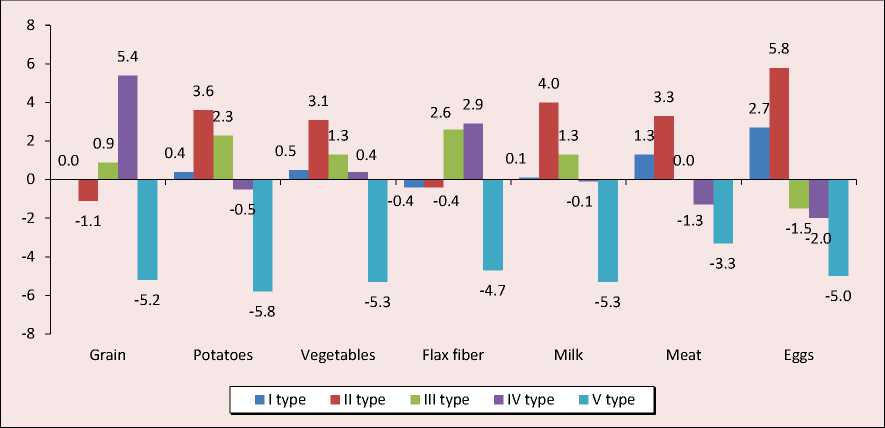
Source: Rosstat.
Type II regions were characterized by a positive structural shift in all types of agricultural products, except grain and flax fiber. The situation with grain and flax fiber is due to the orientation of rural territories of these regions toward the development of suburban agriculture – the production of low-transportable vegetable and dairy products, which led to the redistribution of sown areas in favor of fodder production. Type III regions had a positive structural shift in all types of products, except meat and eggs. In the production of meat, the increase was zero, in the production of eggs – negative. Type IV regions were characterized by noticeable positive shifts in the production of grain and flax fiber, insignificant positive shifts – in the production of vegetables, and negative shifts – in the production of other types of products. Type V regions had a negative shift for all types of products.
The structural changes led to the fact that by the end of the Program implementation period, over 45% of all vegetable and egg production in the NonBlack Earth Region was concentrated in type II regions (Fig. 4) .
In type IV regions, grain production was concentrated by more than 50%, and for potatoes, milk and meat, these regions dominated relative to regions of other types. Against the background of a general decline in flax production, more than 80% of flax fiber volume was produced in type V regions.
Finally, the volume of production of all types of agricultural products in type I regions, despite the high growth rates and noticeable positive structural shifts, turned out to be insignificant relative to regions of other types.
Differentiation of regions according to the growth rates of agricultural production under a market economy. Ranking the regions according to the growth rates of production of certain types of agricultural products in 1991–2019, determining the final ranks according to the Borda count, and comparing them with similar final ranks for the period of the Program implementation allowed us to distinguish the types of regions according to the shift in their rating positions after 1990 (Fig. 5).
First of all, it is noticeable that the Moscow Oblast and three northern RF constituent entities that had the best ratings during the implementation of the Program, as well as the Republic of Karelia, which occupied the median position on the final rating scale, were among the regions that lowered their rating positions dramatically. All the northern regions turned out to be below the Q3 quartile, at the very bottom of the final ranking scale. The Tver and Smolensk oblasts, which slightly improved their positions, could not get out of the fourth 25% group of regions; the Ivanovo Oblast also moved to this group. At the same time, the Kostroma Oblast left this group, as did the Vologda, Yaroslavl, Novgorod, and Pskov oblasts, which improved their rating position dramatically. However, we should note that
Figure 4. Proportion of the types of territories within the Non-Black Earth Region in the production of the main types of agricultural products in 1986–1990 in average annual terms, %
13.6
28.2
6.8
45.7
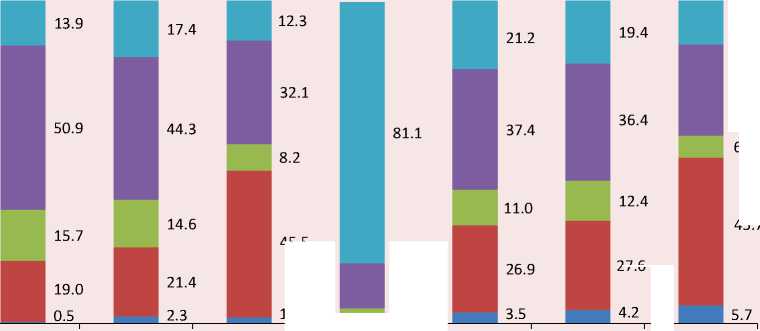
27.6
45.5
13.8
1.9
4.6
Grain
Potatoes Vegetables Flax
Milk
Meat Eggs
■ I type ■ II type ■ III type ■ IV type ■ V type
Source: Rosstat.
Figure 5. Types of territories within the Non-Black Earth Region according to the shift in the final rating positions in terms of the increase in agricultural production in 1991–2019 relative to the period of implementation of the Program
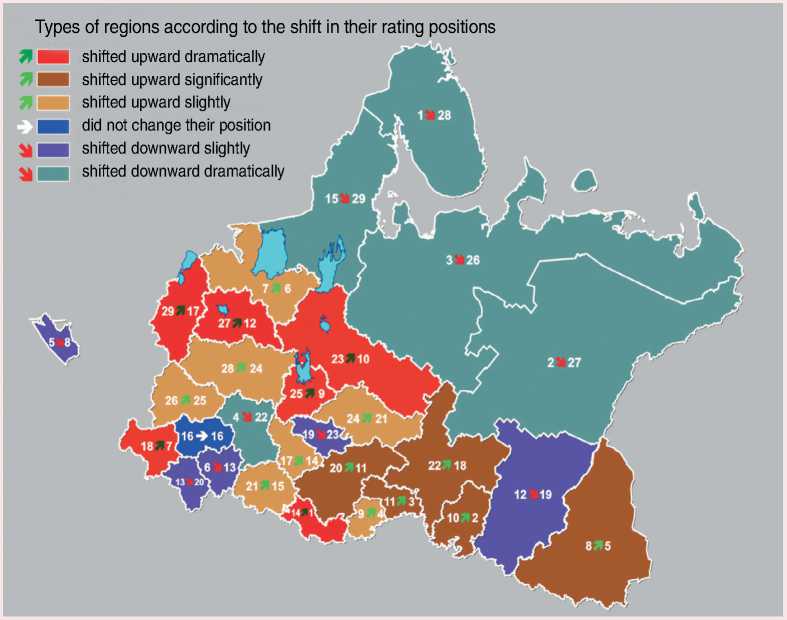
Source: data from Tab. 2 and the results of the territories’ ranking.
the Kostroma and Pskov oblasts have risen up the scale only due to the growth rates in the production of eggs and pig meat at large farms.
A slight increase in the rating allowed the Chuvash Republic to strengthen its position in the first 25% group of regions, in which the Sverdlovsk Oblast retained its positions. The Udmurt Republic, the Republic of Mari-El and the Bryansk Oblast also moved here – they significantly improved their position, as well as the Republic of Mordovia. The Leningrad Oblast, which slightly lowered its rating positions, retained its place in the group of regions above the Q1 quartile.
Thus, the composition of the first 25% group has changed significantly. Along with the Sverdlovsk and Leningrad oblasts, which retained their places, the republics within the Volga Region moved here as well, taking the first four rating positions; the Bryansk Oblast joined the first 25% group, too.
The aggregate level of differentiation (as a process and as a result) of regions by the level of development of agricultural production formed by 2015–2019. The ranking of the sum of the final ranks was carried out according to: a) the growth rate of agricultural production; b) the average annual production of agricultural products in 2015–2019; c) the average annual production of agricultural products in 2015– 2019 per 100 hectares of farmland (arable land).
In this case, the integral rank absorbed the values of three final ranks, each of which was calculated on the basis of seven positions. At the same time, the rating position of the regions according to 21 initial indicators was taken into account in total. Considering the wide coverage of the initial indicators, the stratification of regions on the basis of an ordered scale of integral ranks was carried out with the allocation of three strata using tertiles ( Q1 , Q2 ; Tab. 4 ).
Table 4. Stratification of territories within the Non-Black Earth Region by average annual volumes of agricultural production and their growth rates in 2015–2019
|
Territory |
Final rank |
integral rank |
|||
|
according to the growth rate of production volumes |
by production volumes |
by production volumes per 1 00 hectares of land area |
sum of ranks |
||
|
I group – regions with the highest rating indicators |
|||||
|
Leningrad Oblast |
6 |
4 |
1 |
11 |
1-2 |
|
Sverdlovsk Oblast |
5 |
1 |
5 |
11 |
1-2 |
|
Udmurt Republic |
2 |
3 |
9 |
14 |
3 |
|
Republic of Mordovia |
1 |
7 |
8 |
16 |
4 |
|
Republic of Mari El |
3 |
12 |
2 |
17 |
5 |
|
Chuvash Republic |
4 |
11 |
3 |
18 |
6 |
|
Bryansk Oblast |
7 |
5 |
7 |
19 |
7 |
|
Nizhny Novgorod Oblast |
11 |
2 |
13 |
26 |
8 |
|
Moscow oblast |
22 |
6 |
4 |
32 |
9 |
|
Kaliningrad Oblast |
8 |
20 |
6 |
34 |
10 |
|
II group – regions with average rating indicators |
|||||
|
Yaroslavl Oblast |
9 |
14 |
12 |
35 |
11 |
|
Tula Oblast |
13 |
9 |
15 |
37 |
12 |
|
Vladimir Oblast |
14 |
16 |
10 |
40 |
13 |
|
Ryazan Oblast |
15 |
10 |
20 |
45 |
14 |
|
Novgorod Oblast |
12 |
21 |
14 |
47 |
15-16 |
|
Vologda Oblast |
10 |
19 |
18 |
47 |
15-16 |
|
Perm Oblast |
19 |
8 |
24 |
51 |
17 |
|
Kaluga Oblast |
16 |
17 |
19 |
52 |
18 |
|
Kirov Oblast |
18 |
13 |
27 |
58 |
19 |
|
Oryol Oblast |
20 |
15 |
26 |
61 |
20 |
|
III group – regions with low rating indicators |
|||||
|
Komi Republic |
27 |
27 |
11 |
65 |
21-22 |
|
Pskov Oblast |
17 |
23 |
25 |
65 |
21-22 |
|
Kostroma Oblast |
21 |
24 |
23 |
68 |
23 |
|
Ivanovo Oblast |
23 |
25 |
21 |
69 |
24 |
|
Tver Oblast |
24 |
18 |
28 |
70 |
25 |
|
Murmansk Oblast |
28 |
29 |
16 |
73 |
26 |
|
Republic of Karelia |
29 |
28 |
17 |
74 |
27-28 |
|
Arkhangelsk Oblast |
26 |
26 |
22 |
74 |
27-28 |
|
Smolensk Oblast |
25 |
22 |
29 |
76 |
29 |
|
Source: Rosstat. |
|||||
Consequently, the differentiation of territories by agricultural production in the Non-Black Earth Region after 1990 was formed due to the differences in the reduction of production rather than the unevenness of growth rates. The groups of regions highlighted above fundamentally differ from each other in terms of the growth rate of production volumes. For most types of agricultural products, we note a pattern: the rate of reduction in production volumes increases in the direction from the first group to the third. The pattern is disrupted only in relation to meat and eggs due to the appearance of large pig breeding complexes and poultry farms against the background of a general decline in the production of other types of products. Thus, the initial level of regional differentiation in 1990 and the uneven growth rates of production volumes in the future predetermined the state of its heterogeneity that developed by 2015–2019 (Tab. 5).
With a few exceptions (grain, flax fiber), each of the three indicators has maximum values in the first group of regions, average values in the second and
Table 5. Differentiation of average annual agricultural production volumes by groups of territories of the Non-Black Earth Region in 2015–2019, %
|
Product |
Share of groups of territories in the volume of production for the Non-Black Earth Region |
Ratio to the average indicator for the Non-Black Earth Region |
|||||||
|
production volume per territory |
production volume per 100 hectares of land area |
||||||||
|
I group |
II group |
III group |
I group |
II group |
III group |
I group |
II group |
III group |
|
|
Grain |
44.0 |
52.0 |
4.0 |
127.6 |
150.7 |
13.0 |
115.9 |
117.7 |
22.5 |
|
Potatoes |
58.5 |
31.1 |
10.4 |
169.5 |
90.3 |
33.6 |
154.2 |
70.5 |
57.8 |
|
Vegetables |
60.4 |
29.9 |
9.7 |
175.1 |
86.8 |
31.1 |
159.1 |
68.2 |
54.2 |
|
Flax fiber |
37.8 |
24.3 |
37.9 |
107.4 |
71.6 |
119.3 |
96.2 |
53.4 |
213.8 |
|
Milk |
51.3 |
36.8 |
11.9 |
148.6 |
106.8 |
38.5 |
279.8 |
87.4 |
56.7 |
|
Meat |
61.1 |
24.2 |
14.7 |
177.1 |
70.2 |
47.5 |
332.9 |
58.0 |
69.8 |
|
Eggs |
54.1 |
36.0 |
9.9 |
156.9 |
104.5 |
31.8 |
142.7 |
81.6 |
54.8 |
|
Source: Rosstat. |
|||||||||
minimum values in the third. In the first group of regions, more than 50% of milk, eggs and potatoes, more than 60% of vegetables and meat is produced, and production volumes per region are higher, respectively, by 49, 57, 69, 75 and 77% than the average for the Non-Black Earth Region. In terms of production volumes per 100 hectares of land area, the first group of regions exceeds the average indicators for the Non-Black Earth Region for milk by 180%, for meat – by 233%.
Thus, the stratification of territories of the NonBlack Earth Region on the basis of the methodology adopted above made it possible to identify their significant differentiation that had developed by 2015–2019. The study also shows that these groups are internally insufficiently homogeneous, and therefore subgroups are allocated in each of them, in most cases taking into account the neighborhood of regions and the formation of areals.
The first group of regions with the highest rating indicators includes four regions whose centers are millionaire cities (subgroup Ia ) , and four compactly located republics of the Volga Region (subgroup Ib ) (Fig. 6) .
A separate subgroup (Ic ) includes the Bryansk and Kaliningrad oblasts, which stand out among other regions not only in group I, but also in the Non-Black Earth Region as a whole. The Bryansk Oblast is characterized by high rates of agricultural production dynamics, and the Kaliningrad Oblast is characterized by special natural and socioeconomic conditions. Subgroup Ia is characterized by the highest concentration of production of vegetables, milk, meat and eggs, somewhat less – potatoes; subgroup Ib is characterized by a noticeable concentration of vegetables, milk and meat; subgroup Ic has a high concentration of potatoes and a slightly lower concentration of flax fiber, meat and grain (Tab. 6).
The second group of regions with average rating indicators is divided into three subgroups: IIa – the Tula, Ryazan, Kaluga and Oryol oblasts located to the south and southwest of the capital region; IIb – the Vladimir, Yaroslavl, Vologda and Novgorod oblasts that form a single area of regions, most of which after 1990 dramatically improved their rating positions in terms of growth rates of agricultural production and left the group of depressed territories; IIc – the Kirov and Perm oblasts, united within one areal in the east of the Non-Black Earth Region.
Subgroup IIa is distinguished by the highest concentration of grain production, considerable volume of production of potatoes, absence of flax fiber production; and for other types of products, the indicators per region are 15–40% lower than the average for the Non-Black Earth Region. Subgroup IIb is characterized by a noticeable concentration of flax fiber and egg production, has milk production indicators close to the average
Figure 6. Subgroups of territories within the Non-Black Earth Region by indicators of integral ranks reflecting the state of differentiation of agricultural production in 2015–2019
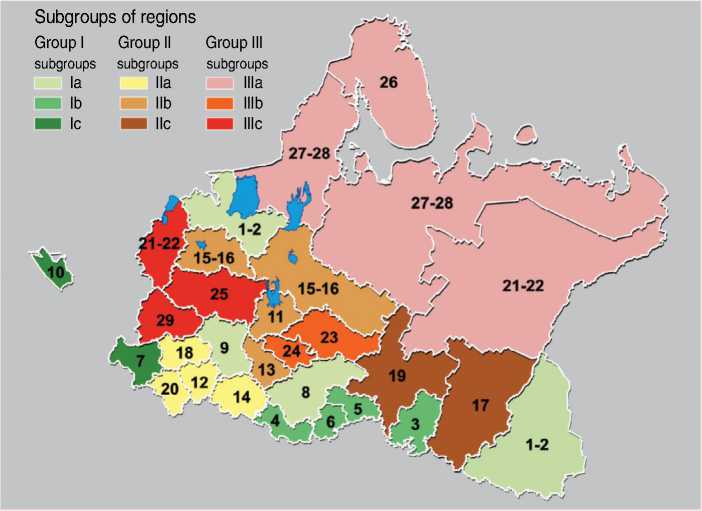
Numbers indicate the place of the territories in the integral rank scale.
Source: data from Tab. 4.
Table 6. The ratio of the average annual production of agricultural products per territory to the average for the Non-Black Earth Region in 2015–2019, %
The regions of the third group have low rating indicators: subgroup IIIa – the northern territories, which have sharply reduced the growth rates of agricultural production; subgroup IIIb – the Ivanovo and Kostroma oblasts, united in one areal to the east of the capital region; subgroup IIIc – the Pskov, Smolensk, Tver oblasts, forming an areal in the west of the Non-Black Earth Region.
The regions of subgroup IIIa do not produce grain and flax fiber and have the lowest production volumes of meat and eggs; here the indicators for the production of potatoes, vegetables and milk are 80–85% lower. In subgroup IIIb, whose regions have traditionally grown flax, the level of concentration of flax fiber production is minimal. The indicators for egg production are as close as possible to the average value per one region within the Non-Black Earth Region, and the indicators for the production of vegetables and milk are 60% lower, for the production of potatoes – almost 70% lower. The regions in subgroup IIIc are distinguished by a high concentration of flax fiber production, noticeable concentration of meat production, low concentration of grain and eggs production. The level of production of potatoes, vegetables and milk per region is 40–50% lower than the average for the Non-Black Earth Region.
Modern trends in the process of differentiation in the production of agricultural products. The downward trends in the production of agricultural products in the Non-Black Earth Region slowed down in 2012–2013, and then, due to the implementation of the import substitution strategy, they changed their direction to the opposite. At the same time, these processes are going on in different directions and at different rates, being quite clearly differentiated by subgroups of territories (Tab. 7) .
We can forecast that if the growth rates of production volumes remain the same, then in the coming future their growth will continue in subgroups Ia, Ib, Ic (except for milk), Ia, Ib, (except for flax). In subgroups IIc and IIIc, an upward trend is observed for half of the products, and for the rest there is a downward trend, in subgroup IIIb – an upward trend for grain and egg, and in subgroup IIIa – a downward trend for all products. For potatoes, vegetables and milk, negative growth rates are observed in four out of the nine subgroups of territories, for meat –in three subgroups, for eggs and flax fiber – in two subgroups, for grain – in one subgroup.
The increase in regional differentiation in the future will occur due to higher growth rates of grain and meat production in subgroups Ib, Ic, IIa, IIIc, potatoes and vegetables – in subgroups Ic, IIa , flax fiber – in subgroups Ib, Ic , milk – in subgroups IIa, IIb, IIc , eggs – in subgroups IIb, IIc , as well as due to the decline in production of potatoes and vegetables in subgroups IIc, IIIa, IIIb, IIIc , milk – in subgroups IIIa, IIIb, IIIc, meat – in subgroups IIc, IIIa, IIIb .
Ways to reduce excessive differentiation and polarization . We can identify two main directions for solving this problem by stimulating agricultural production in the territories within subgroups IIc, IIIa, IIIb, IIIc : a) a differentiated approach within the current measures of state support for agriculture; b) a program approach to mobilize local potential.
Currently, at the level of the federal center, attempts are being made to take additional measures to support RF constituent entities, the territories of which are regarded as unfavorable for agricultural production. In accordance with the rules for the implementation of WTO regional assistance
Table 7. Average annual growth rates of agricultural production by subgroups of territories within the Non-Black Earth Region in 2013–2019, %
At the same time, if the inclusion of the republics of Karelia and Komi, the Arkhangelsk, Murmansk oblasts (subgroup IIIa ), the Ivanovo Oblast (subgroup IIIb ), Perm Krai (subgroup IIc) in this list is justified, then the presence of the Republic of Mordovia, the Bryansk and Leningrad oblasts in the list looks very unexpected. Therefore, it was quite fair to exclude the Bryansk Oblast from the list in 2021, and the exclusion of the Ivanovo Oblast was absolutely inexplicable. The inclusion of the Vladimir and Novgorod oblasts (subgroup IIb ) in the list can be assessed as acceptable.
Based on the results of the study, the Government of the Russian Federation is proposed to include the Pskov, Smolensk, and Tver oblasts (subgroup IIIc), where the production potential has been deteriorating over the past 40–50 years, in the list of territories with unfavorable conditions for agricultural production. The increased rates of meat production and related grain production in recent years have not affected the rural territories of the regions as a whole, but are observed only in some areas. It is necessary to return the Ivanovo Oblast to the list and include the Kostroma Oblast in the list: together, these two regions make up subgroup IIIb. The list should be supplemented with the Kirov Oblast, which, along with Perm Krai, is part of subgroup IIc.
A differentiated approach within the existing measures of state support for agriculture for the regions in subgroups IIc, IIIa, IIIb, IIIc will promote the development of agricultural production within the current level, but will not provide them with a breakthrough in development. In fact, this requires special targeted comprehensive programs adopted at the federal level and aimed at the development of agricultural production and rural areas in: a) the republics of Karelia and Komi, the Arkhangelsk and Murmansk oblasts; b) the Pskov, Smolensk and Tver oblasts; c) the Ivanovo and Kostroma oblasts; d) Perm Krai and the Kirov Oblast. The programs should focus on investing in the mobilization of local resource, human, social and entrepreneurial potential in order to overcome the depressive state in agricultural production and development in rural territories of these regions.
It is advisable that the Decree of the President of Russia should include these rural territories in the list of priority areas for settlement by compatriots living abroad within the framework of the program to assist voluntary resettlement4 and also expand the “Far Eastern Hectare” program5 for them, as has already been done for the territories of the Arctic zone, by making appropriate amendments to Federal Law 119-FZ of May 2, 2016. It would be advisable to extend the provisions of the Concept for development of the border territories of RF constituent entities that are part of the Far Eastern Federal District so that the provisions were valid for the Republic of Karelia, the Murmansk, Pskov and Smolensk oblasts6. The solution to this issue is within the competence of the Government of the Russian Federation. There are also other program mechanisms for boosting agricultural production and rural development in the territories within the Non-Black Earth Region, where downward trends in agricultural production continue to dominate.
In turn, the regions of subgroups Ia, Ib, Ic, IIa, IIb in their majority have now become attractive for agribusiness; this fact, no doubt, will remain in the future. Here it is necessary to support and improve those legal, organizational and economic mechanisms for the development of agricultural production that have already shown themselves positively in practice.
Conclusion
Theoretical and applied results of the research
The research we have conducted makes a certain contribution to the theory of rural development in terms of dividing the factors, which contribute to the formation of heterogeneity of rural territories, into zonal and azonal; the research also highlights the special role of the differential rent mechanism in the formation of heterogeneity of rural territories; we investigated the theoretical construction “center–periphery” as a special case of the theory of differential rent (unlike other researchers); we looked into the essence of the territorial differentiation of rural areas in two meanings – as a process and as a result of this process, expressed by the heterogeneity of rural territories.
The most significant contribution to the practice of applied research consists in the proposed methodological constructions that help identify types, groups, areas of regions with homogeneous features of rural territories, establish modern trends in the development of the differentiation process and determine ways to reduce its redundancy. All this, ultimately, allows us to give practical recommendations to federal authorities on the application of a differentiated approach to the development of rural areas.
Specific conclusions based on the findings of the research
Agricultural production, being a system-forming activity in rural areas, is the main attribute of the village as a social institution and provides rural residents with employment and income.
Agricultural production in the Non-Black Earth Region will remain heterogeneous in the future as well; its territorial differentiation will be influenced by the trends discussed above and by the continuing trend of population and production concentration in the zone of influence of urban agglomerations, large and medium-sized cities.
The rural territories of the Non-Black Earth Region, which occupy high rating positions according to the integral indicator of the development of agricultural production, are the most favorable in socio-demographic terms and very attractive for migrants; all this ensures the overall growth of the rural population. By 2020, compared to 1989, the number of rural population in the Republic of Udmurtia, the Tula, Sverdlovsk and Moscow oblasts increased by 4–6%, in the Leningrad Oblast – by almost 10%, and in the Kaliningrad Oblast – by 22.9%, with a total reduction in the amount of rural population in the Non-Black Earth Region by 17.6%.
During the same period, in the regions of group III with low rating indicators, the rural population decreased by 30–40% or more, which led to the liquidation of 60–70% of municipalities of the first level. According to the latest population census, in most regions of this group, more than 20% of rural settlements had no inhabitants, and in the territories with the highest rating indicators (group I), there were less than 6% of such settlements.
The interrelation and mutual influence of the development of agricultural production and changes in socio-demographic processes in rural areas can aggravate interregional differentiation in the NonBlack Earth Region, lead to even greater social desertification in the RF constituent entities that we have classified as group III. In the current situation, it is problematic to reduce the excessive differentiation of rural territories only through measures to develop agricultural production in this group. Therefore, in order to reduce the excessive differentiation and polarization of rural areas, it is necessary to develop non-agricultural activities in this group. This could be facilitated by the transition to an endogenous and further to a neo-endogenous paradigm of rural development, which are successfully formed and implemented in the EU countries [23; 24; 25]. These paradigms are based on the knowledge economy, the use of local resource potential of territories, promotion of human and social capital, development of information technologies and widespread use of web networks.
References Developing territorial differentiation processes of agricultural production in the Non-Black Earth region and their current trends
- Petrikov A.V. Economic growth in Russian agriculture: factors and problems. Nauchnye trudy Vol'nogo ekonomicheskogo obshchestva Rossii=Scientific Works of the Free Economic Society of Russia, 2018, vol. 214, no. 6, pp. 450–469. (In Russian).
- Kostyaev A.I. et al. Rural Nechernozemye: From plan to market. APK: ekonomika, upravlenie=Agro-Industrial Complex: Economics, Management, 2021, no. 5, pp. 3–15. DOI: 10.33305/215-3 (In Russian).
- Nefedova T.G. Development of the Post-Soviet agricultural sector and rural spatial polarization in European Russia. Prostranstvennaya ekonomika=Spatial Economics, 2019, vol. 15, no. 4, pp. 36–56. DOI: 10.14530/se.2019.4.036-056 (In Russian).
- Nefedova T.G., Medvedev A.A. Shrinkage of active space in Central Russia: Population dynamics and land use in countryside. Izvestiya Rossiiskoi akademii nauk. Seriya geograficheskaya=Bulletin of the Russian Academy of Sciences. Series Geography, 2020, no. 5, pp. 645–659. DOI: 10.31857/S258755662005012X (In Russian).
- Averkieva K.V. Innovations in agriculture in the non-black-soil zone of Russia as a response to shrinkage of space. Regional Research of Russia, 2013, vol. 3, no. 1, pp. 52–61. DOI: 10.1134/S2079970513010036
- Romanova E., Vinogradova O., Frizina I. Social and economic space compression in border areas: The case of the Northwestern Federal District. Baltic Region, 2015, no. 3 (25), pp. 28–46. DOI: 10.5922/2079-8555-2015-3-3
- Urasova A.A. , Balandin D.A., Pytkin F.N., Kovaleva E.B., Zagoruiko I.Y. Spatial development of rural territories in Russian regions: Growth areas or desolation zones? International Journal of Recent Technology and Engineering, vol. 8, no. 2, pp. 4110–4122. DOI: 10.35940/ijrte.B3083.078219. Available at: https://www.ijrte.org/wp-content/uploads/papers/v8i2/B3083078219.pdf
- Averkieva K.V. Labor markets and the role of otkhodnichestvo in the employment of rural inhabitants of Russians Non-Chernozem zone. Regional Research of Russia, 2016, vol. 6, no. 1, pp. 21–31. DOI: 10.1134/S2079970516010020
- Friedmann J. Regional Development Policy: A Case Study of Venezuela. Cambridge, Mass. M.I.T. Press, 1966. 279 р.
- Gritsai O.V., Ioffe G.A., Treivish A.I. Tsentr i periferiya v regional'nom razvitii [Center and periphery in regional development]. Moscow: Nauka, 1991. 161 p.
- Prioritetnye napravleniya razvitiya agropromyshlennogo kompleksa Rossii [Priority directions in the development of the agro-industrial complex of Russia]. Moscow: Tekhnologiya TsD, 2018. 416 p.
- Tretyakovа L.A., Vladyka M.V., Vlasova T.A., Glotov D.S. Differentiation of the regions of the Central Federal district of the Russian Federation according to the level of competitive advantages. Humanities & Social Sciences Review, 2019, vol. 7, no. 5, pp. 835–839. DOI: 10.18510/hssr.2019.75108. Available at: https://giapjournals.com/index.php/hssr/article/view/hssr.2019.75108
- Farinyuk Yu.T., Egorova E.V. Typology of the regions of the Non-Chernozem zone by the level of agricultural development. Ekonomika, trud, upravlenie v sel'skom khozyaistve=Economics, Labor, Management in Agriculture, 2015, no. 1 (22), pp. 35–38. (In Russian).
- Kostyaev A.I. Territorial'naya differentsiatsiya sel'skokhozyaistvennogo proizvodstva: voprosy metodologii i teorii [Territorial differentiation of agricultural production: methodological and theoretical issues]. Saint Petersburg: Izd-vo SPbGUEF, 2006. 240 p.
- Zubarevich N.V., Safronov S.G. Inequality of socio-economic development of regions and cities of Russia in the 2000s: growth or decline? Obshchestvennye nauki i sovremennost'=Social Sciences and Contemporary World, 2013, no. 6, pp. 15–26. (In Russian).
- Bufetova A.N. Interregional differences in the standard of living in Russia. Vestn. Novosib. gos. un-ta. Seriya: Sotsial'no-ekonomicheskie nauki=Vestnik NSU. Series: Social and Economics Sciences, 2014, vol. 14, no. 3, pp. 113–123. (In Russian).
- Moroshkina M.V. Interregional differentiation of Russian regions: trends and prospects of convergence. Teoreticheskaya i prikladnaya ekonomika=Theoretical and Applied Economics, 2018, no. 3, pp. 48–60. DOI: 10.25136/2409-8647.2018.3.18700. Available at: https://nbpublish.com/library_read_article.php?id=18700 (In Russian).
- Gubanova E.S., Kleshch V.S. Methods to evaluate uneven socio-economic development of a region. Problemy razvitiya territorii=Problems of Territory's Development, 2018, no. 6 (98), pp. 30–41. DOI: 10.15838/ptd.2018.6.98.2 (In Russian).
- Stec M.A., Filip P.B., Grzebyk M.J., Pierscieniak A. Socio-economic development in the EU member states – concept and classification. Economics of Engineering Decisions, 2014, vol. 25, no. 5, pp. 504–512. DOI: https://doi.org/10.5755/j01.ee.25.5.6413
- Mironenkov A.A. Hierarchical Pareto classification of the Russian regions by the population’s quality of life indicators. Ekonomicheskie i sotsial'nye peremeny: fakty, tendentsii, prognoz=Economic and Social Changes: Facts, Trends, Forecast, 2020, vol. 13, no. 2, pp. 171–185. DOI: 10.15838/esc.2020.2.68.11 (In Russian).
- Mirkin B.G., Orlov M.A. Metody mnogokriterial'noi stratifikatsii i ikh eksperimental'noe sravnenie [Methods of multi-criteria stratification and their experimental comparison]. Moscow: Izd. dom Vysshei shkoly ekonomiki, 2013. 32 p.
- Ward N., Atterton J., Kim T.Y., Lowe P., Phillipson J., Thompson N. Universities. The Knowledge Economy and ‘Neo-Endogenous Rural Development’. Centre for Rural Economy Discussion Paper Series. 2005, no. 1, pp. 1–15. Available at: http://www.ncl.ac.uk/cre/publish/discussionpapers/pdfs/discussionpaper1.pdf
- van der Ploeg J.D., Marsden T.K. Unfolding Webs: The Dynamics of Regional Rural Development. Assen: The Netherlands: Van Gorcum. 2008. 262 p. Available at: http://orca.cardiff.ac.uk/id/eprint/11659
- Guinjoan Е., Badia А., Tulla A.F. The new paradigm of rural development. Territorial considerations and reconceptualization using the “Rural Web”. Boletín de la Asociación de Geógrafos Españoles, 2016, no. 71, pp. 495–500. DOI: 10.21138/bage.2279.
