Development and experimental research of materials for forming stable bottom and side ledges

Author: Arkhipov Gennadiy V., Poliakov Peter V., Shaydulin Evgeniy R., Avdeev Yuriy O.
Journal: Журнал Сибирского федерального университета. Серия: Техника и технологии @technologies-sfu
Article in issue: 5 т.9, 2016.
Free access
The main purpose of this paper is to find a solution for saving energy in the cell room. Another purpose of the paper is to find materials suitable for stable side and bottom ledge formation, research the properties of such materials, and study their behavior in cryolite-alumina melts, including selection of the most suitable material. Moreover, the paper is concerned with energy consumption reduction by forming stable side and bottom ledges. Furthermore, as mentioned earlier, several materials have been selected to form stable side and bottom ledges during the post-start-up period. The properties of the selected materials have been analyzed.
Electrolysis, electrolytic cell, start-up of electrolytic cell, forming stable bottom and side ledges
Short address: https://sciup.org/146115097
IDR: 146115097 | UDC: 669.7.018.672 | DOI: 10.17516/1999-494X-20169-5-617-631
Разработка и экспериментальные исследования материала для формирования устойчивой настыли и гарнисажа
Целью данной работы является разработка технических решений для повышения энергоэффективности действующих алюминиевых электролизеров, включающая подбор материалов для создания искусственной настыли и экспериментальные исследования свойств выбранных материалов, их поведения в криолитоглиноземных расплавах с последующим выбором материала с оптимальными свойствами, а также снижение удельного расхода электроэнергии за счет создания искусственной настыли и гарнисажа. По результатам работы установлены два вида материалов для создания искусственной настыли: на основе SiС-SiN композиции, на основе магнезита. Оба вида материалов показали хорошую стойкость в расплаве электролита и могут быть рекомендованы для создания искусственной настыли.
Text of the scientific article Development and experimental research of materials for forming stable bottom and side ledges
Table 1. Composition and some physical features of silicon carbide blocks and magnesite blocks
Thermal conductivity of silicon carbide and magnesite blocks
The coefficient of thermal conductivity (λ) of silicon carbide blocks is one of the crucial properties which define side ledge formation. Carbon blocks were superseded by silicon carbide blocks mainly because of a high thermal conductivity of the latter. According to the Siacatec 75 Quality Certificate, the coefficient of thermal conductivity of the blocks lowers as the temperature rises. Figure 1 shows λ vs. (temp.) within the temperature range of 20 to 900 °C, which falls quite well on the straight line described by the following equation:
λ = 45.153 – 0.0285 t, W/m∙K, (1)
where ‘t’ stands for the temperature measured in °C.
Figure 2 shows λ vs. (temp.) within the temperature range of 300 to 1,200 °C, according to [1]. The dependency becomes non-linear at t>800 °C.
During cell operation, the coefficient of thermal conductivity of the blocks decreases. According to [2], a reduction in the coefficient of thermal conductivity may reach 38 % and 77 %. Figure 3 shows an even more severe decrease, which was seen during the research period [3]. For instance, for a block taken out from a 270-day-old, shut-down cell, the coefficient of thermal conductivity of the material contacting the bath, at 550 to 700 °C (the temperature of the block during cell operation; the cell with the side ledge), was 3 times lower than the initial value (28 W/m∙K), which is equal to the coefficient of thermal conductivity of carbon blocks. It is clear that a decrease in thermal conductivity leads to side ledge melting.
The coefficient of thermal conductivity decreased significantly only at the areas of contact with the bath, whereas in the gas-phase area the coefficient of thermal conductivity barely changed. Such a significant decrease in the bath area may be caused by the formation of sodium silicate, which is characterized by a lower thermal conductivity.
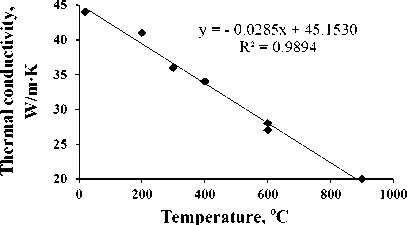
Fig. 1. Thermal conductivity vs. temperature for silicon carbide blocks
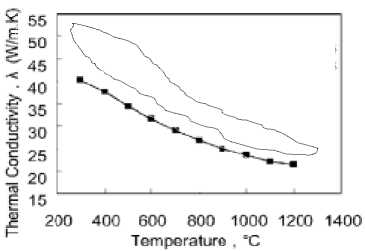
Fig. 2. Thermal conductivity vs. temperature for silicon carbide blocks, according to [3]
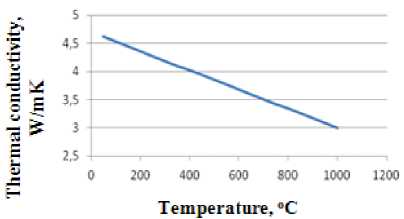
Fig. 3. Thermal conductivity vs. temperature for magnesite blocks, according to [4]
Figure 3 shows thermal conductivity vs. temperature for magnesite blocks, which is described by the following equation (according to [4]):
λ = 4.7 – 0.0017 t, W/m∙K,
where ‘t’ stands for temperature measured in °C.
Figure 4 shows thermal conductivity vs. temperature for magnesite blocks, which is described by the following equation (according to [5]):
λ = 5 + 0.0015 t, W/m∙K,
where ‘t’ stands for the temperature measured in °C.
Since the thermal conductivity measurements described in the literature differ significantly, several independent experiments were conducted during this research to define the coefficient of thermal conductivity of magnesite blocks.
Specific electrical resistivity
Figures 5 and 6 show specific electrical resistivity, ρ vs. temperature for silicon carbide and magnesite blocks [5].
As shown in the above graphs, the specific electrical resistivity of both silicon carbide and magnesite blocks decreases significantly when the temperature rises. Within the temperature range of 25 to 800 °C, electrical resistivity vs. temperature is described by the following linear equation:
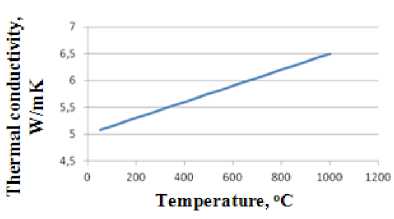
Fig. 4. Thermal conductivity vs. temperature for magnesite blocks, according to [5]
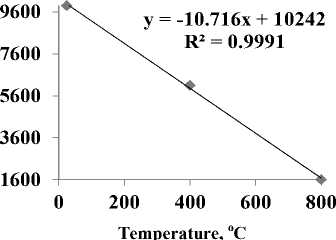
Fig. 5. Specific electrical resistivity vs. temperature s
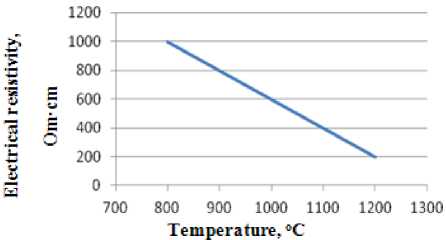
Fig. 6. Specific electrical resistivity vs. temperature for magnesite blocks [5]
ρ = 10,242 – 10,716∙t, Ohm∙cm, (4)
where ‘t’ stands for the temperature measured in °C.
Experimental research of silicon carbide and magnesite blocks for ledge formation purposes
The following materials were provided for testing:
-
– periclase-spinel refractory based on sintered periclase and aluminum spinel. Block type: PShGS-64 (ПШГС-64), manufactured by Magnesit , LLC , the city of Satka, Russia. Block size: 600x230x90 mm;
-
- silicon carbide block, manufactured by the Volzhskiy Abrasive Works , block size: 350x350x65 mm.
Samples (035x90; 040x50; 065x50 mm) were taken from the above materials by drilling and lathing.
The following characteristics of the materials were defined:
-
– spinning wear in the bath and molten aluminum;
-
– thermal expansion within the temperature range of 20 to 950 °C; and
-
– thermal conductivity within the temperature range of 100 to 950 °C.
Spinning wear of silicon carbide and magnesite blocks in the bath and molten aluminum
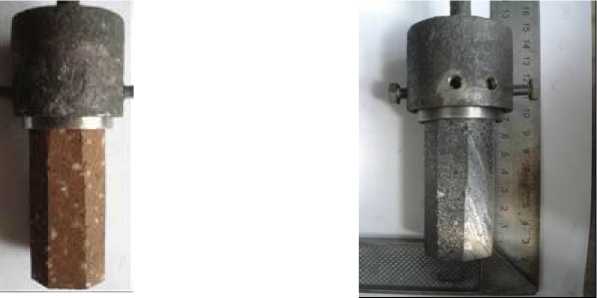
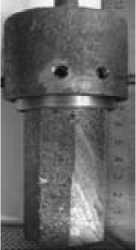
The tests were run using an erosive wear measurement system in accordance with the erosive wear testing methodology for spinning samples in the bath and molten aluminum. Figure 7 shows the sample appearance.
Silicon carbide blocks are difficult to lathe, so it was impossible to make a cylindrical sample. Silicon carbide and magnesite samples were made in the form of octagon, which was the closest to the form of a cylinder. The dimensions of the samples are listed in Table 3.
The samples were mounted (Fig. 7), put into the chamber filled with molten aluminum and the bath and, then, were spun at a certain speed. The aluminum level was 25 mm, and the bath level was
a b
Fig. 7. Mounted samples, before spinning in the bath and aluminum: a – magnesite block; b – silicon carbide block
-
25 mm. Table 2 shows the experimental composition of the bath. During testing, the bath temperature was 980 °C.
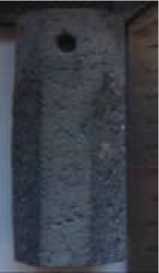
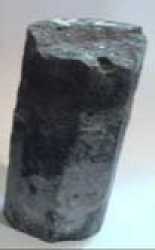
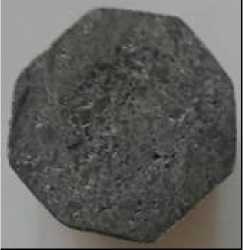
Silicon carbide blocks. The test results are listed in Table 3 and shown in Fig. 8–9 demonstrates the cross-section of the sample at the aluminum/bath interface after spinning in the bath/Al system for 12 hours.
The appearance of the samples and the cross-section of Sample 2 did not change as a result of the tests (as shown in Fig. 8, 9) This means that the material did not react with the bath. The change in the sample dimensions as a function of time / height is shown in Fig. 10 and 11.
The graphs show that the maximum wear of the silicon carbide samples is observed on the edges both in the area of contact with aluminium and in the aluminum/bath interface area after 12 hours. The distance between the longitudinal edges decreased by 0.36 mm and 0.44 mm, respectively.
Magnesite blocks, PShGS–64 (ПШГС–64). The appearance of the samples before and after the test is shown in Fig. 12 After 12-hour and 24-hour experiments, the samples were cross cut at a height
Table 2. Experimental bath composition
|
Na 3 AlF 6 + AlF 3 (CR = 2,0) |
NaF, Analytical grade |
Al 2 O 3 , Analytical grade |
CaF 2 , Analytical grade |
CR |
|
77, % by mass |
14, % by mass |
4, % by mass |
5, % by mass |
2,65 |
CR – cryolite ratio.
Table 3. Test results: measuring the spinning wear of silicon carbide blocks in the bath-aluminum system
|
Test No. |
Testing time, hours |
Sample spinning speed, cm/s |
Average sample dimensions and mass |
Before test |
After test |
Difference |
|
|
1 |
6 |
16 |
D pl.* , mm |
at the bottom |
33.400 |
33.400 |
0.000 |
|
D ed.** , mm |
35.520 |
35.450 |
–0.070 |
||||
|
D pl.* , mm |
at the height of 25 mm |
33.530 |
33.450 |
–0.080 |
|||
|
D ed.** , mm |
35.880 |
35.760 |
–0.120 |
||||
|
D pl.* , mm |
at the height of 50 mm |
33.212 |
33.175 |
–0.037 |
|||
|
D ed.** , mm |
34.920 |
34.780 |
–0.140 |
||||
|
Height, mm |
88.700 |
88.700 |
0.000 |
||||
|
Mass, grams |
208.200 |
208.200 |
0.000 |
||||
|
2 |
12 |
32 |
D pl.* , mm |
at the bottom |
32.275 |
32.250 |
–0.025 |
|
D ed.** , mm |
34.300 |
33.940 |
–0.360 |
||||
|
D pl.* , mm |
at the height of 25 mm |
33.025 |
33.175 |
0.150 |
|||
|
D ed.** , mm |
34.580 |
34.140 |
–0.440 |
||||
|
D pl.* , mm |
at the height of 50 mm |
32.775 |
32.550 |
–0.225 |
|||
|
D ed.** , mm |
34.840 |
34.620 |
–0.220 |
||||
|
Height, mm |
88.900 |
88.900 |
0.000 |
||||
|
Mass, grams |
195.500 |
195.500 |
0.000 |
||||
D pl.* – distance between the planes; D ed.** – distance between the edges.
а
b
-
Fig. 8. Sample 1, silicon carbide: а – before the test; b – after the test
а
b
c
-
Fig. 9. Sample 2, silicon carbide: а – before the test; b – after the test; c – cross-section when cut at the bath/ aluminum interface
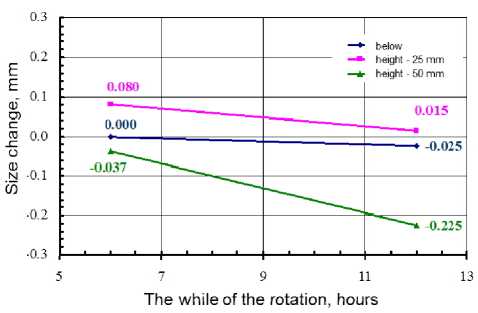
Fig. 10. Change in the distance between the faces of the silicon carbide samples vs. spinning time
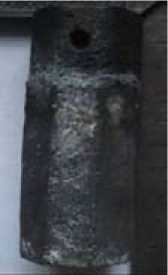
of 15 and 35 mm. Fig. 13, 14 demonstrate cross-sections of the sample in three areas: a) aluminum area; b) bath area; and c) area above the bath.
As seen in the above Figures, the sample was impregnated the most within the bath area. The test results are listed in Table 4.
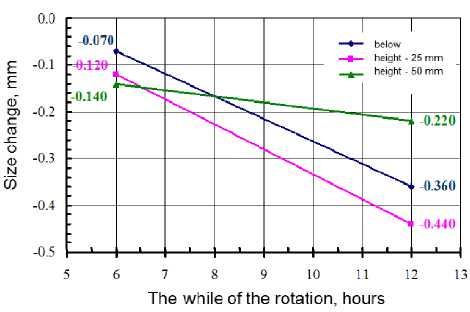
Fig. 11. Change in the distance between the edges of the silicon carbide samples vs. spinning time
a b c d e
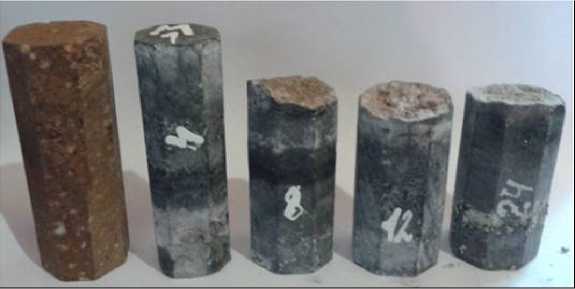
Fig. 12. The appearance of magnesite samples: a – before the test; b – after 4 hours; c – after 8 hours; d – after 12 hours; e – after 24 hours of spinning in the bath and aluminum
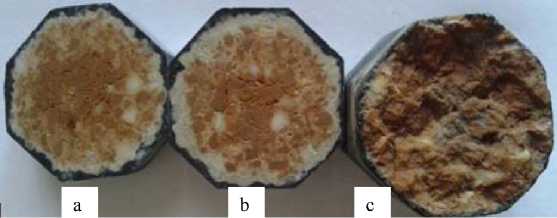
Fig. 13. Sample cross-section after 12 hours of spinning in the bath and aluminum: а – aluminum area; b – bath area; c – area above the bath
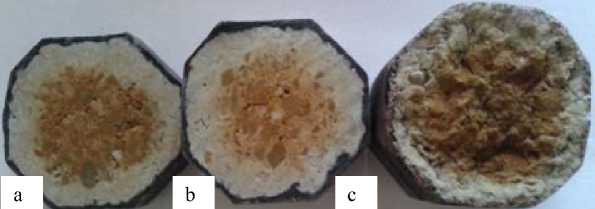
Fig. 14. Sample cross-section after 24 hours of spinning in the bath and aluminum: а – aluminum area; b – bath area; c – area above the bath
Table 4. Test results: measuring the spinning wear of magnesite blocks in the bath-aluminum system
|
Test No. |
Testing time, hours |
Sample spinning speed, cm/s |
Average sample dimensions and mass |
Before test |
After test |
Difference |
|
|
1 |
2 |
3 |
4 |
5 |
6 |
7 |
8 |
|
1 |
4 |
16 |
D pl.* , mm |
at the bottom |
27.375 |
27.750 |
0.375 |
|
D ed.** , mm |
29.320 |
29.260 |
–0.060 |
||||
|
D pl.* , mm |
at the height of 25 mm |
27.800 |
27.700 |
–0.100 |
|||
|
D ed.** , mm |
29.500 |
29.500 |
0.000 |
||||
|
D pl.* , mm |
at the height of 50 mm |
27.700 |
27.875 |
0.175 |
|||
|
D ed.** , mm |
29.480 |
29.320 |
–0.160 |
||||
|
Height, mm |
89.900 |
0.000 |
|||||
|
Mass, grams |
178.800 |
18.800 |
|||||
|
2 |
8 |
16 |
D pl.* , mm |
at the bottom |
32.875 |
33.400 |
0.525 |
|
D ed.** , mm |
35.340 |
35.440 |
0.100 |
||||
|
D pl.* , mm |
at the height of 25 mm |
32.900 |
33.025 |
0.125 |
|||
|
D ed.** , mm |
35.280 |
35.340 |
0.060 |
||||
|
D pl.* , mm |
at the height of 50 mm |
32.875 |
33.400 |
0.525 |
|||
|
D ed.** , mm |
35.220 |
35.140 |
–0.080 |
||||
|
Height, mm |
89.750 |
0.000 |
|||||
|
Mass, grams |
253.000 |
25.900 |
|||||
|
3 |
12 |
9 |
D pl.* , mm |
at the bottom |
33.300 |
33.525 |
0.225 |
|
D ed.** , mm |
35.560 |
35.740 |
0.180 |
||||
|
D pl.* , mm |
at the height of 25 mm |
33.300 |
33.575 |
0.275 |
|||
|
D ed.** , mm |
35.580 |
35.900 |
0.320 |
||||
|
D pl.* , mm |
at the height of 50 mm |
33.250 |
33.400 |
0.150 |
|||
|
D ed.** , mm |
34.660 |
35.280 |
0.620 |
||||
|
Height, mm |
89.340 |
0.000 |
|||||
|
Mass, grams |
255.900 |
24800 |
|||||
|
4 |
24 |
9 |
D pl.* , mm |
at the bottom |
33.350 |
33.275 |
–0.075 |
|
D ed.** , mm |
35.900 |
36.000 |
0.100 |
||||
|
D pl.* , mm |
at the height of 25 mm |
33.300 |
33.375 |
0.075 |
|||
|
D ed.** , mm |
35.440 |
35.600 |
0.160 |
||||
Table 4. Continued
|
1 |
2 |
3 |
4 |
5 |
6 |
7 |
8 |
|
D pl.* , mm |
at the height of 50 mm |
33.375 |
33.55 |
0.175 |
|||
|
D ed.** , mm |
35.520 |
35.460 |
–0.060 |
||||
|
Height, mm |
89.400 |
0.000 |
|||||
|
Mass, grams |
260.100 |
31.100 |
|||||
D pl.* – distance between the planes; D ed.** – distance between the edges.
The while of the rotation, hours
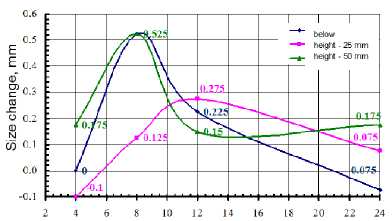
Fig. 15. Change in the distance between the faces of the magnesite samples vs. spinning time
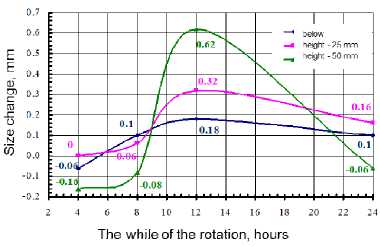
Fig. 16. Change in the distance between the edges of the magnesite samples vs. spinning time
It is shown that all the samples became heavier after the tests, which makes it impossible to define the extent of spinning wear of these blocks in the bath-aluminum system.
Figures 15 and 16 show the change in the sample dimensions as a function of time and height.
The graphs and pictures demonstrate that the samples were impregnated to a great extent and became bigger. The change in the dimensions was less significant at the later stage of the test, so the PShGS-64 (ПШГС-64) samples were supposedly subject to wear, but it was difficult to define the degree of wear.
The tests showed that neither of the materials was destroyed by the bath and aluminum after 24 hours of testing, so both of them can be used for forming artificial ledges, because the walls of the cell are usually fully protected by a layer of molten aluminum in 18 – 26 hours after the start-up.
Coefficient of Thermal Expansion (CTE) for magnesite blocks
The rated CTE of silicon carbide blocks is 4.6∙10-6 K-1 (according to the quality certificate). The CTE of magnesite blocks was not defined by the manufacturer, so it was necessary to measure it. The IK-4 (ИК-4) measurement system was used. The experiment was run according to the methods of CTE experimental measurement in the temperature range of 20 to 950 °C.
The graph in Fig. 17 shows the results of the measurement within the temperature range of 20 to 950 °C. The vertical axis represents the relative change in the height of the sample defined as:
ε = ∆h/h 0 ⋅100 %, (5)
where ε stands for the relative change measured in %; ∆h stands for the absolute change measured in mm; h0 stands for the initial height of the sample measured in mm.
The Coefficient of Thermal Expansion (CTE) was counted as:
α = ε / ΔT (6)
where α stands for the CTE measured in оК-1; stands for the relative change in the height of the sample heated from the room temperature T 0 to T = (950 ± 10) °C; ∆Т stands for the change in temperature from the room temperature T0 to T = (950 ± 10) °C.
The measurement results for PShGS–64 (ПШГС-64) are listed in the Table 5.
The experiments showed that the magnesite block’s CTE ranged within 11.1∙10-6 to 11.2∙10-6 in the temperature range of 20 to 950 °C. This means that magnesite is a suitable material for artificial ledges, since the internal stress will not break it when the temperature rises.
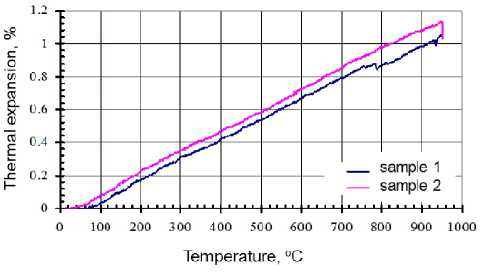
Fig. 17. Thermal expansion of the PShGS–64 (ПШГС-64) block vs. temperature
Table 5. Characteristics of the PShGS–64 (ПШГС-64) magnesite samples before and after the experiment
|
Experiment No. |
m, g |
d, mm |
h, mm |
Density, grams/cm 3 |
CTE, °K -1 |
|
|
1 |
Before the experiment |
205.40 |
42.92 |
50.67 |
2.80 |
11.2∙10 -6 |
|
After the experiment |
205.00 |
41.65 |
50.89 |
2.96 |
||
|
2 |
Before the experiment |
204.10 |
41.51 |
50.47 |
2.99 |
11.1∙10 -6 |
|
After the experiment |
203.60 |
42.00 |
50.78 |
2.89 |
||
Thermal conductivity (TC)
of silicon carbide and magnesite blocks
The rated TC of silicon carbide blocks is 28 W/m∙К (T=300 °C) and 20 W/m∙К (T=950 °C) (according to the quality certificate). The TC of magnesite blocks was not defined by the manufacturer, so it was necessary to measure it. The TEP (ТЭП) measurement system was used. The experiment was run according to the methods of thermal conductivity experimental measurement within the temperature range of 100 to 950 °C.
The results of the measurement within the temperature range of 100 to 950 °C are shown in Fig. 18 as TC/temperature dependency graphs. The measured TC values at different temperature levels for magnesite blocks are listed in Table 6.
These results can be used for mathematical modeling when estimating the thermal balance of the cell.
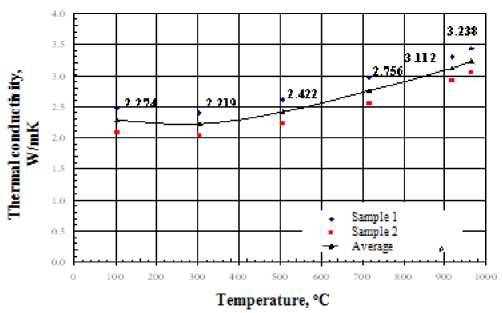
Fig. 18. Thermal conductivity of the PShGS–64 (ПШГС–64) magnesite block
Table 6. Thermal conductivity of the PShGS–64 (ПШГС–64) magnesite block
|
Experiment No. |
Temperature, °C |
TC, W/m•K |
Apparent density before the experiment, g/cm 3 |
Apparent density after the experiment, g/cm 3 |
|
1 |
103.28 |
2.469 |
2.79 |
2.78 |
|
303.84 |
2.397 |
|||
|
506.25 |
2.616 |
|||
|
716.32 |
2.963 |
|||
|
918.71 |
3.303 |
|||
|
963.41 |
3.437 |
|||
|
2 |
103.28 |
2.078 |
2.79 |
2.78 |
|
303.84 |
2.041 |
|||
|
506.25 |
2.229 |
|||
|
716.32 |
2.548 |
|||
|
918.71 |
2.920 |
|||
|
963.41 |
3.040 |
Properties of silicon carbide and magnesite blocks for mathematical modelling
Apparent density p, g/cm 3
-
- PShGS-64 magnesite block (experimental value) - 2.79
-
- Silicon carbide block (rated value) - 2.58
Coefficient of Thermal Expansion a , °K-1
-
- PShGS-64 magnesite block (experimental value) - 11.2-10-6
-
- Silicon carbide block (rated value) - 4.6^10-6
Thermal conductivity X, W/m^K
-
- PShGS-64 magnesite block (experimental value
|
Т,°С 100 |
300 |
500 |
700 |
800 |
900 |
950 |
|
λ, W/m•K 2.25 |
2.20 |
2.40 |
2.73 |
2.90 |
3.07 |
3.21 |
|
- Silicon carbide block (rated value) |
||||||
Т,°С 300 950
λ, W/m•K 28 20
The tests showed that neither of the materials was destroyed when exposed to the circulating bath melt for 24 hours. Neither material was subject to wear when exposed to the circulating aluminum melt. Thus, both materials can be used for artificial ledges, because the walls of the cell are usually fully protected by a layer of molten aluminum in 18 – 26 hours after the startup.
Experiments showed that the magnesite block’s CTE ranged within 11,1∙10-6 to 11,2∙10-6 in the temperature range of 20 to 950 °C. This means that magnesite is a suitable material for artificial cell ledge formation, since the internal stress will not break it when the temperature rises.
Conclusions
The following goals were achieved by this research:
-
– the thermal conductivity of silicon carbide and magnesite blocks was investigated;
-
– temperature vs. electrical resistivity of silicon carbide and magnesite blocks was analyzed;
-
– the thermal expansion coefficient for magnesite blocks was defined;
-
– the properties of silicon carbide and magnesite blocks were investigated for mathematical modelling purposes;
-
– wear-resistance tests of the materials were conducted.
As a result of the research, two materials were chosen for artificial ledge formation:
-
а) SiС-SiN based material; and
-
b) magnesite based material.
Both materials demonstrated high resistivity against the bath melt and can be recommended for artificial ledge formation.
References Development and experimental research of materials for forming stable bottom and side ledges
- Appendix 1 to the production certificate for silicon carbide blocks.
- Production certifi cate № 32010575 от 07.10.2014 for magnesite blocks.
- Chunxia Liu, Zhigang Huang, Guohua Liu, Zhiping Zhang. Excellent Cryolite Resistence and High Thermal Conductivity SiC Sidewall Material For High Amperage Aluminium Reduction Cells, Light Metals, 2010, 889-894.
- George E., Marguni O., Temme P. Use of nitride-bonded silicon carbide bricks as a refractory material for aluminum cells, Siberian Aluminum: collection of scientifi c articles. Bona Company. Krasnoyarsk, 2003, 203-208.
- Wang Zh., Skybakmoen E., Grande T. Spent Si3N4 Bonded SiC Sidelining Materials in Aluminium Electrolysis Cells, LightMetals, 2009, 353-358.
- Чиркин В.С. Теплофизические свойства материалов ядерной техники. М.: Атомиздат, 1967, 474 c.
- Казанцев Е.И. Промышленные печи. Справочное руководство для расчетов и проектирования, 2-еизд., доп. иперераб. М.: Металлургия, 1975, 368 с.
